
Houses for sale & to rent in Quinton, Birmingham
House Prices in Quinton
Properties in Quinton have an average house price of £271k and had 741 Property Transactions within the last 3 years¹.
Quinton is an area in Birmingham, Birmingham with 9,514 households², where the most expensive property was sold for £1.8M.
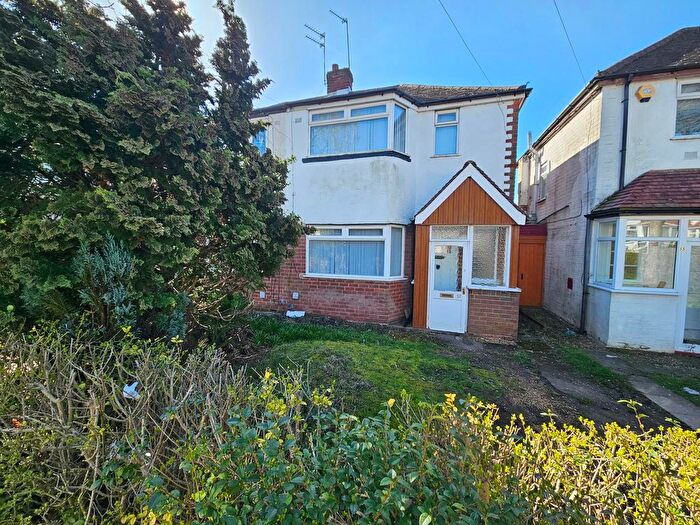
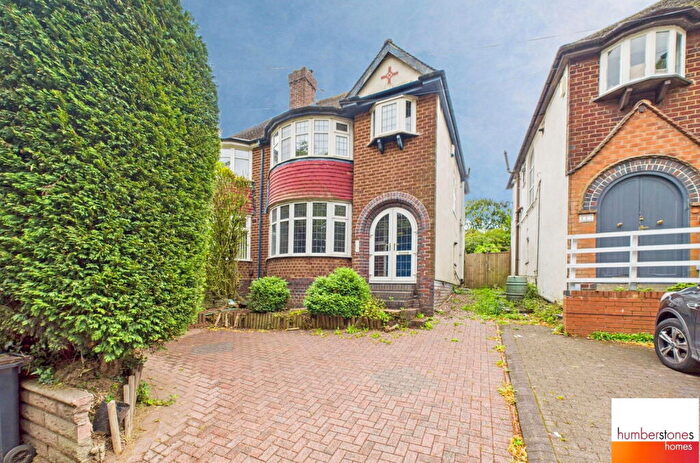
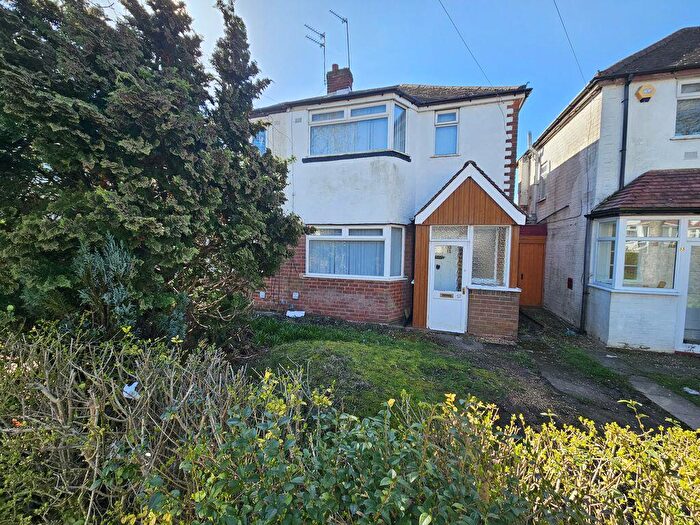
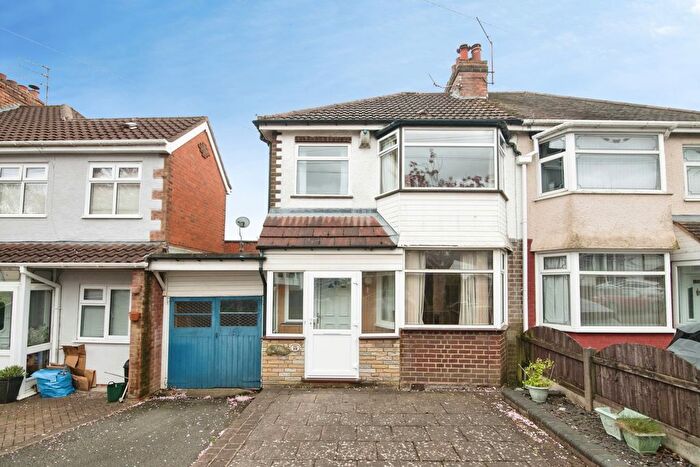
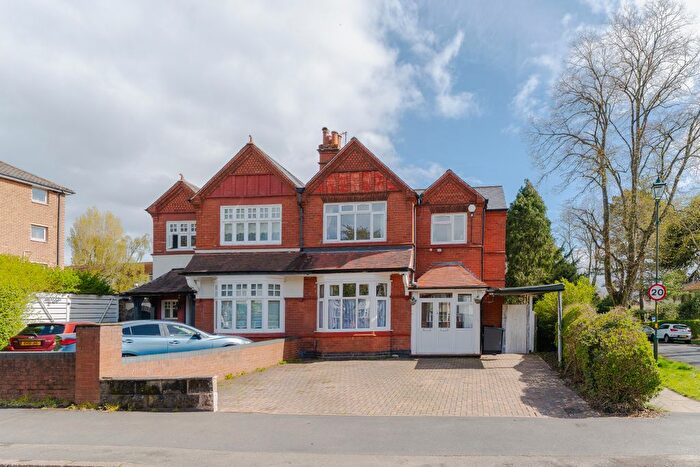
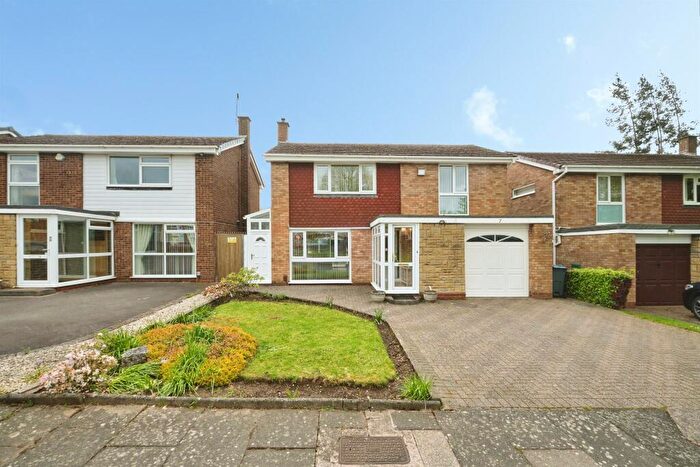
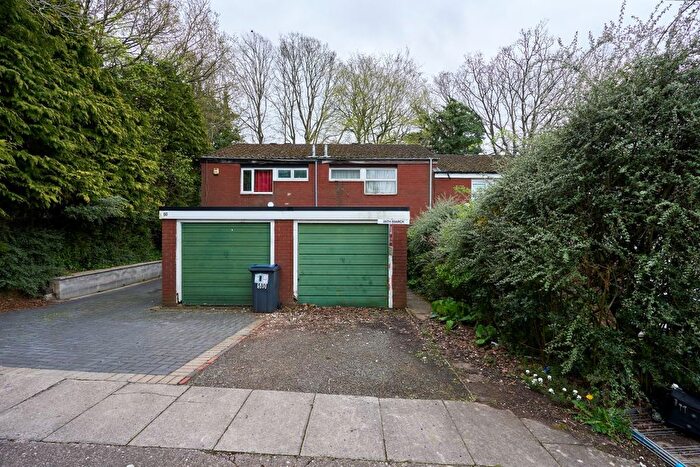
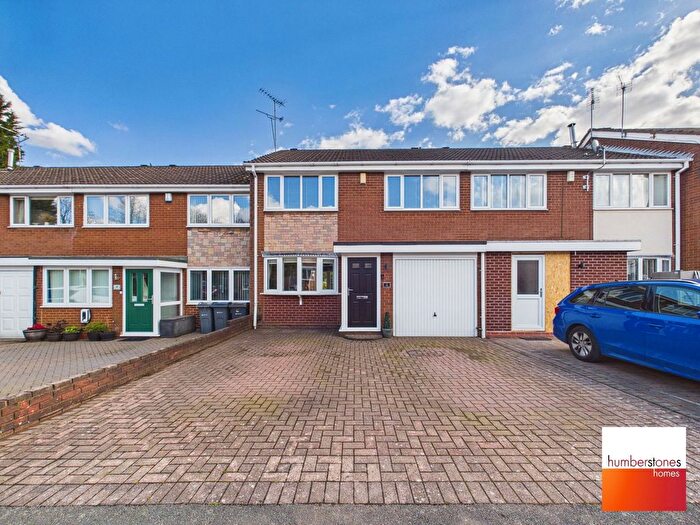
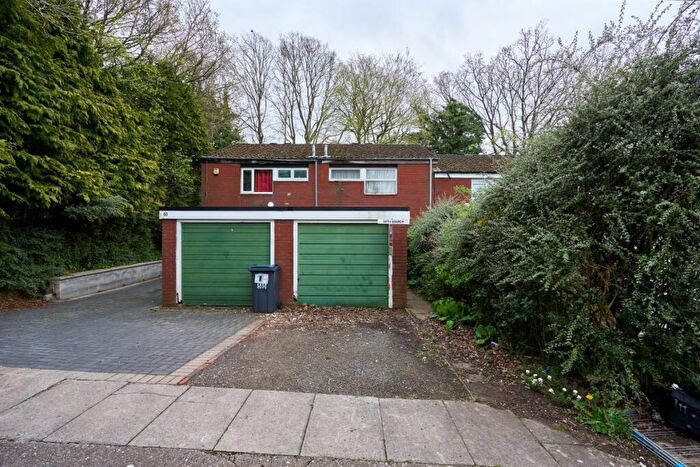
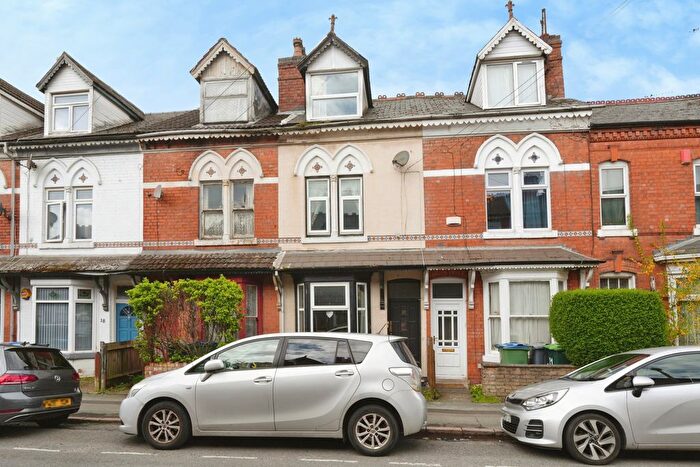
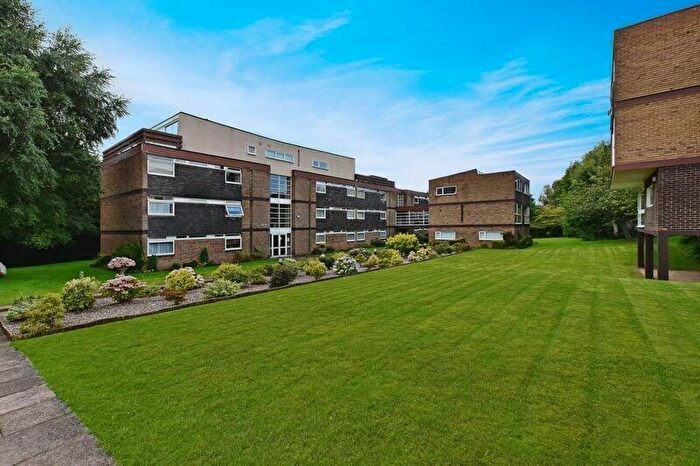
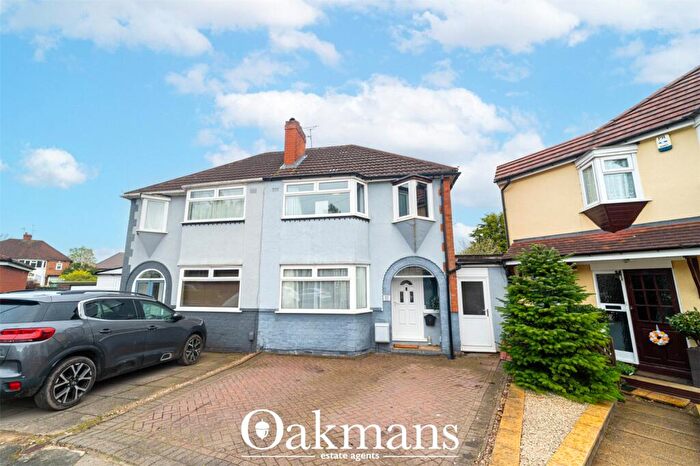
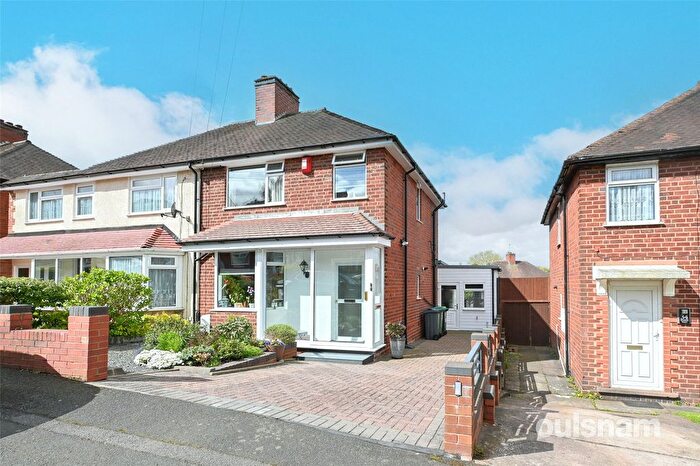
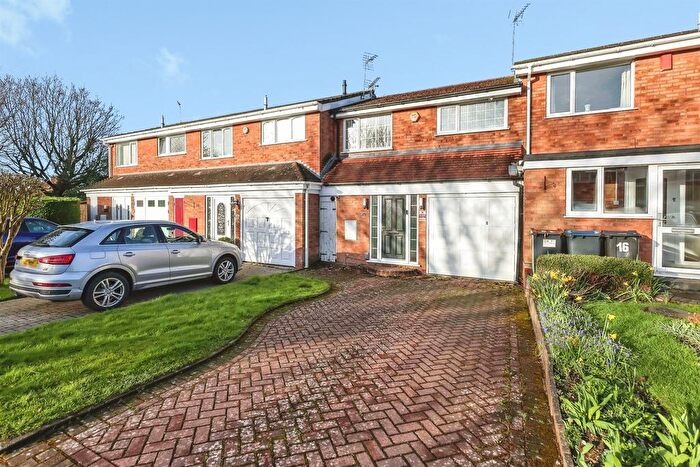
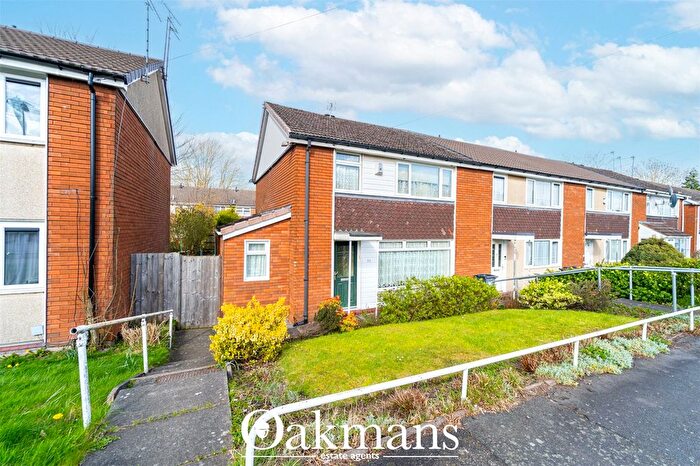
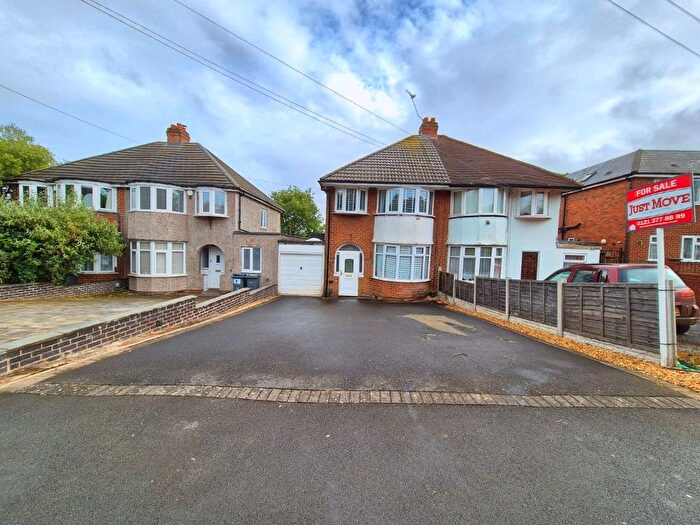
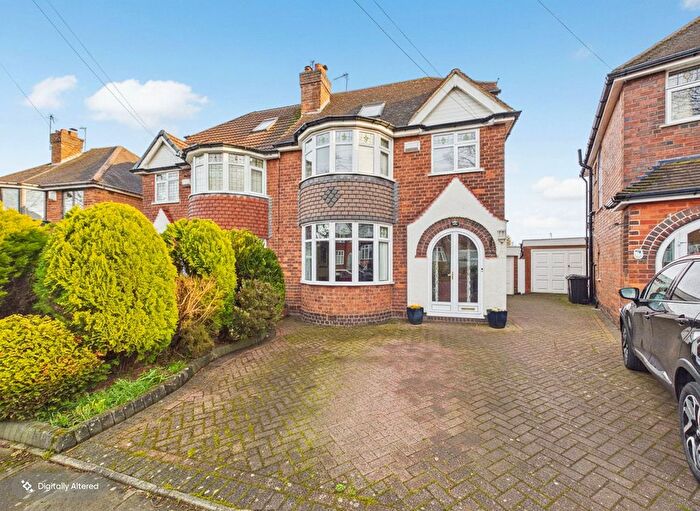
Properties for sale in Quinton
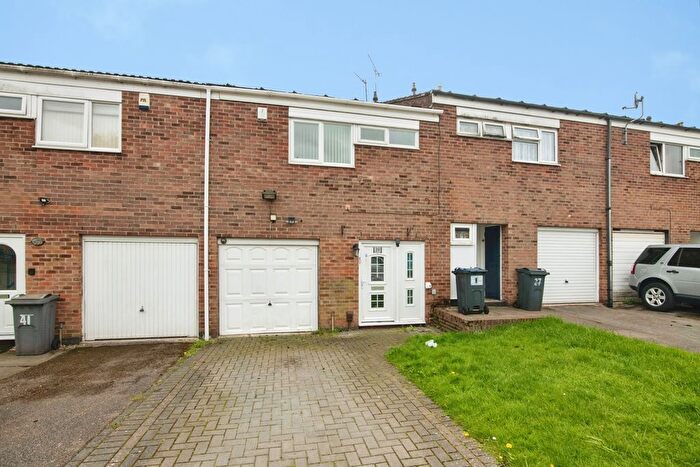

![]()
If you are looking to sell your house, let it out, or receive a property valuation, an expert can help you.
Click the button below to get started.

Roads and Postcodes in Quinton
Navigate through our locations to find the location of your next house in Quinton, Birmingham for sale or to rent.
Transport near Quinton
-
 Rowley Regis Station
 -
University Station
-
Selly Oak Station
-
Langley Green Station
-
Smethwick Rolfe Street Station
-
Smethwick Galton Bridge Station
- FAQ
- Price Paid By Year
- Property Type Price
Frequently asked questions about Quinton
What is the average price for a property for sale in Quinton?
The average price for a property for sale in Quinton is £270,879. This amount is 15% higher than the average price in Birmingham. There are 4,997 property listings for sale in Quinton.
What streets have the most expensive properties for sale in Quinton?
The streets with the most expensive properties for sale in Quinton are Fitz Roy Avenue at an average of £1,213,118, Hamilton Avenue at an average of £1,200,000 and Blackbushe Close at an average of £1,095,000.
What streets have the most affordable properties for sale in Quinton?
The streets with the most affordable properties for sale in Quinton are Hunslet Road at an average of £77,000, Rutters Meadow at an average of £94,400 and Savoy Close at an average of £117,500.
Which train stations are available in or near Quinton?
Some of the train stations available in or near Quinton are Rowley Regis, University and Selly Oak.
Property Price Paid in Quinton by Year
The average sold property price by year was:
| Year | Average Sold Price | Price Change |
Sold Properties
|
|---|---|---|---|
| 2026 | £220,000 | -25% |
1 Property |
| 2025 | £274,581 | 1% |
236 Properties |
| 2024 | £271,793 | 2% |
258 Properties |
| 2023 | £266,576 | -6% |
246 Properties |
| 2022 | £282,241 | 3% |
317 Properties |
| 2021 | £274,629 | 14% |
365 Properties |
| 2020 | £236,935 | 4% |
293 Properties |
| 2019 | £227,032 | 3% |
345 Properties |
| 2018 | £219,111 | -2% |
364 Properties |
| 2017 | £223,131 | 6% |
402 Properties |
| 2016 | £210,307 | 14% |
407 Properties |
| 2015 | £180,813 | 11% |
351 Properties |
| 2014 | £161,346 | -7% |
316 Properties |
| 2013 | £172,586 | 6% |
278 Properties |
| 2012 | £162,914 | 6% |
222 Properties |
| 2011 | £153,350 | -8% |
200 Properties |
| 2010 | £164,883 | 5% |
210 Properties |
| 2009 | £155,910 | -16% |
217 Properties |
| 2008 | £180,085 | 3% |
227 Properties |
| 2007 | £174,237 | 4% |
413 Properties |
| 2006 | £167,366 | 12% |
417 Properties |
| 2005 | £147,197 | -2% |
358 Properties |
| 2004 | £150,310 | 10% |
418 Properties |
| 2003 | £135,702 | 23% |
432 Properties |
| 2002 | £105,143 | 16% |
468 Properties |
| 2001 | £87,968 | 7% |
424 Properties |
| 2000 | £81,668 | 8% |
424 Properties |
| 1999 | £75,188 | 7% |
374 Properties |
| 1998 | £70,156 | 12% |
375 Properties |
| 1997 | £61,703 | 2% |
354 Properties |
| 1996 | £60,734 | 2% |
340 Properties |
| 1995 | £59,330 | - |
232 Properties |
Property Price per Property Type in Quinton
Here you can find historic sold price data in order to help with your property search.
The average Property Paid Price for specific property types in the last three years are:
| Property Type | Average Sold Price | Sold Properties |
|---|---|---|
| Semi Detached House | £275,419.00 | 325 Semi Detached Houses |
| Detached House | £562,515.00 | 64 Detached Houses |
| Terraced House | £236,247.00 | 267 Terraced Houses |
| Flat | £142,720.00 | 85 Flats |