
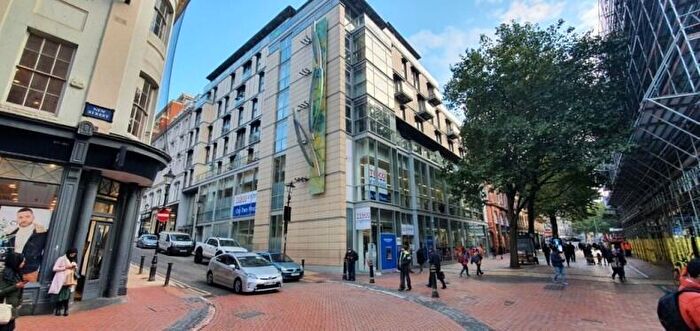
Houses for sale & to rent in Ladywood, Birmingham
House Prices in Ladywood
Properties in Ladywood have an average house price of £212k and had 1,052 Property Transactions within the last 3 years¹.
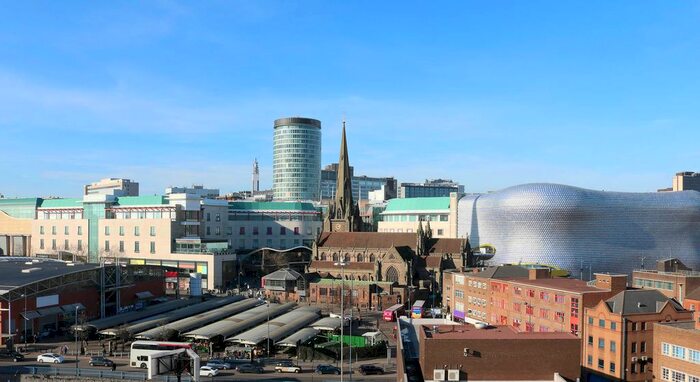
Ladywood is an area in Birmingham, Birmingham with 15,337 households², where the most expensive property was sold for £5.11M.
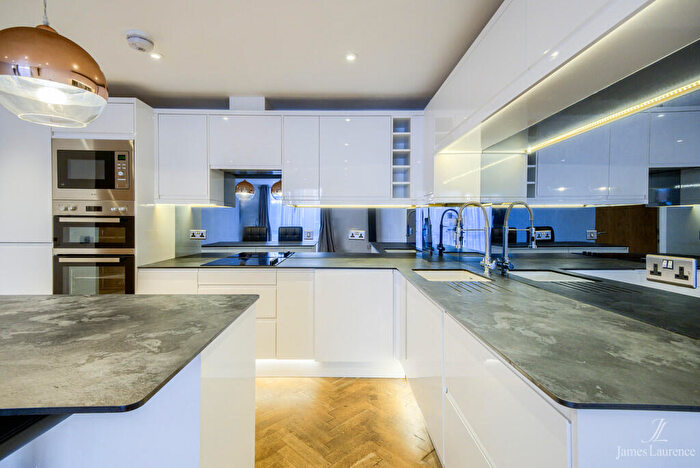
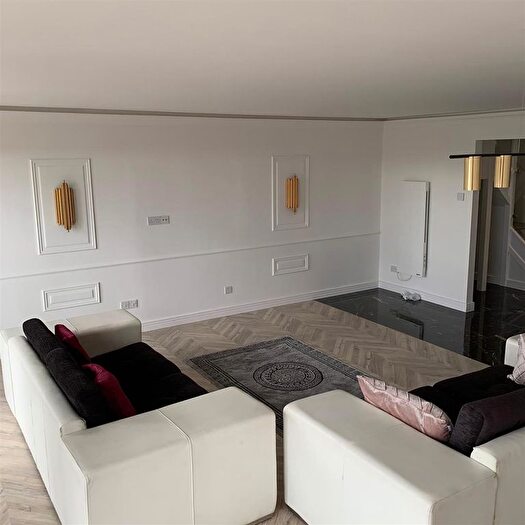
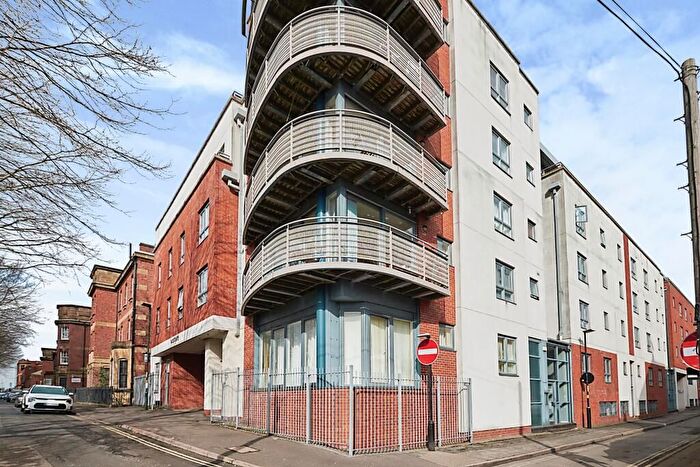
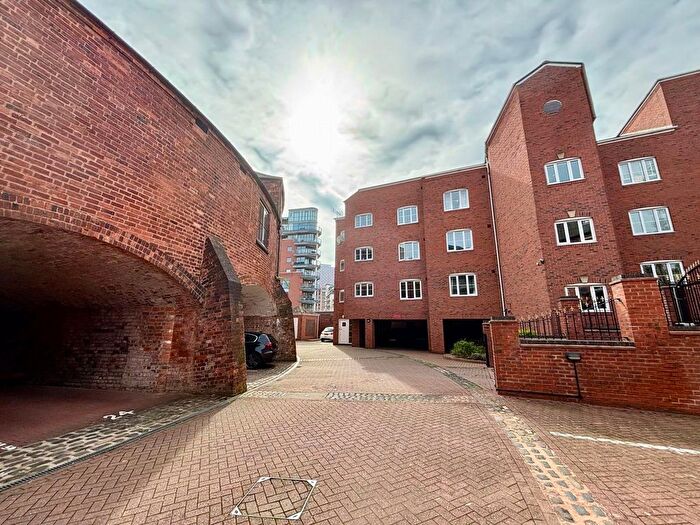
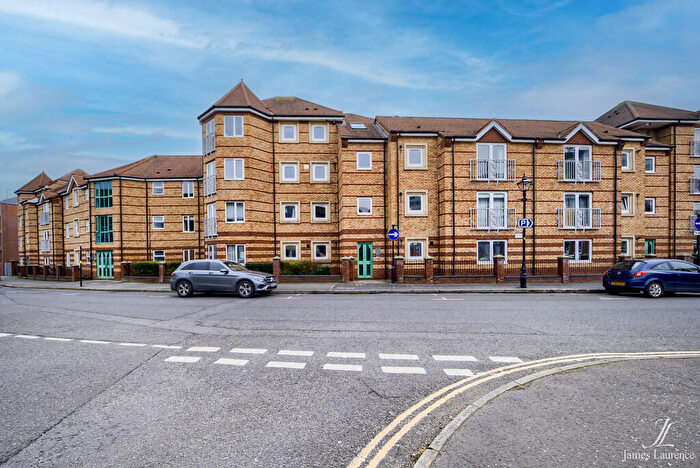
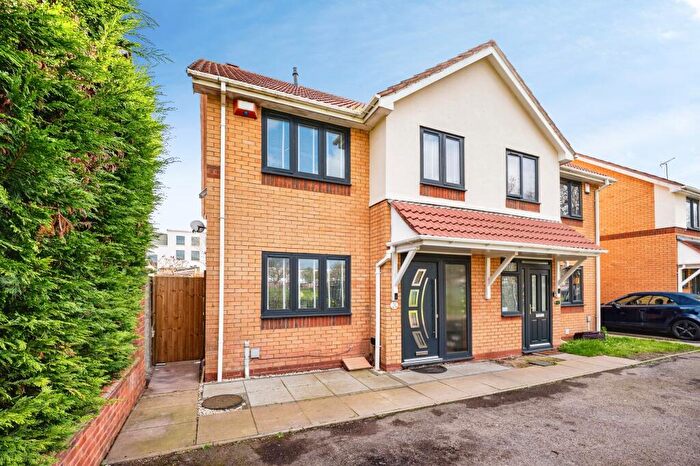
Properties for sale in Ladywood
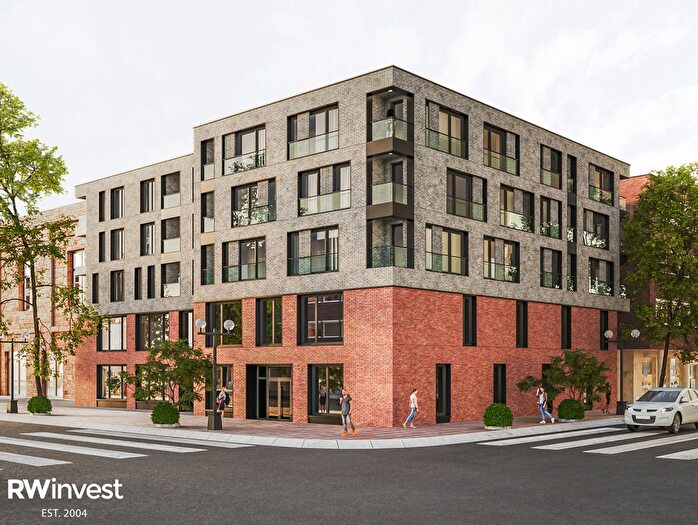
![]()
If you are looking to sell your house, let it out, or receive a property valuation, an expert can help you.
Click the button below to get started.


Roads and Postcodes in Ladywood
Navigate through our locations to find the location of your next house in Ladywood, Birmingham for sale or to rent.
Transport near Ladywood
-
 Birmingham New Street Station
 -
Five Ways Station
-
Birmingham Snow Hill Station
-
Jewellery Quarter Station
-
Birmingham Moor Street Station
-
Birmingham Bordesley Station
-
Duddeston Station
-
University Station
-
Adderley Park Station
-
Small Heath Station
- FAQ
- Price Paid By Year
- Property Type Price
Frequently asked questions about Ladywood
What is the average price for a property for sale in Ladywood?
The average price for a property for sale in Ladywood is £211,872. This amount is 10% lower than the average price in Birmingham. There are more than 10,000 property listings for sale in Ladywood.
What streets have the most expensive properties for sale in Ladywood?
The streets with the most expensive properties for sale in Ladywood are Temple Row at an average of £5,107,000, Marshall Street at an average of £612,500 and Selwyn Road at an average of £489,400.
What streets have the most affordable properties for sale in Ladywood?
The streets with the most affordable properties for sale in Ladywood are Acorn Grove at an average of £76,500, Brindley Drive at an average of £94,500 and Skipton Road at an average of £96,666.
Which train stations are available in or near Ladywood?
Some of the train stations available in or near Ladywood are Birmingham New Street, Five Ways and Birmingham Snow Hill.
Property Price Paid in Ladywood by Year
The average sold property price by year was:
| Year | Average Sold Price | Price Change |
Sold Properties
|
|---|---|---|---|
| 2026 | £194,500 | -3% |
5 Properties |
| 2025 | £200,529 | -0,5% |
303 Properties |
| 2024 | £201,466 | -15% |
371 Properties |
| 2023 | £231,670 | 6% |
373 Properties |
| 2022 | £218,405 | -3% |
489 Properties |
| 2021 | £224,126 | -0,5% |
569 Properties |
| 2020 | £225,242 | 3% |
791 Properties |
| 2019 | £218,027 | 7% |
992 Properties |
| 2018 | £203,846 | 2% |
1,370 Properties |
| 2017 | £199,709 | 16% |
902 Properties |
| 2016 | £168,178 | 0,5% |
1,214 Properties |
| 2015 | £167,413 | 13% |
916 Properties |
| 2014 | £146,365 | 7% |
929 Properties |
| 2013 | £135,533 | 0,3% |
617 Properties |
| 2012 | £135,096 | -1% |
455 Properties |
| 2011 | £136,580 | 2% |
499 Properties |
| 2010 | £133,920 | -0,1% |
475 Properties |
| 2009 | £134,069 | -14% |
508 Properties |
| 2008 | £153,387 | -11% |
972 Properties |
| 2007 | £169,717 | -5% |
1,316 Properties |
| 2006 | £177,944 | 8% |
1,342 Properties |
| 2005 | £163,434 | -1% |
1,096 Properties |
| 2004 | £165,150 | -1% |
1,356 Properties |
| 2003 | £167,034 | 8% |
1,711 Properties |
| 2002 | £152,901 | 6% |
849 Properties |
| 2001 | £144,057 | 23% |
769 Properties |
| 2000 | £110,779 | 22% |
380 Properties |
| 1999 | £86,855 | 19% |
251 Properties |
| 1998 | £70,201 | 1% |
203 Properties |
| 1997 | £69,358 | -9% |
225 Properties |
| 1996 | £75,313 | 40% |
238 Properties |
| 1995 | £45,552 | - |
123 Properties |
Property Price per Property Type in Ladywood
Here you can find historic sold price data in order to help with your property search.
The average Property Paid Price for specific property types in the last three years are:
| Property Type | Average Sold Price | Sold Properties |
|---|---|---|
| Semi Detached House | £310,464.00 | 42 Semi Detached Houses |
| Terraced House | £267,021.00 | 118 Terraced Houses |
| Detached House | £338,250.00 | 6 Detached Houses |
| Flat | £198,998.00 | 886 Flats |