
Houses for sale & to rent in Newtown, Birmingham
House Prices in Newtown
Properties in Newtown have an average house price of £190k and had 20 Property Transactions within the last 3 years¹.
Newtown is an area in Birmingham, Birmingham with 1,886 households², where the most expensive property was sold for £420k.
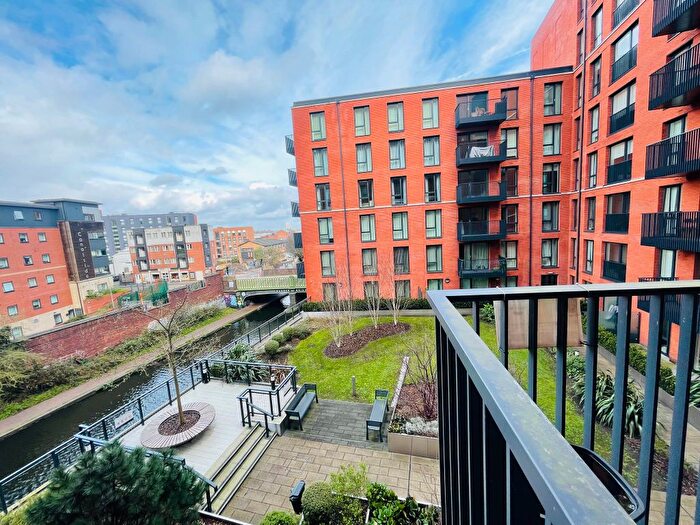
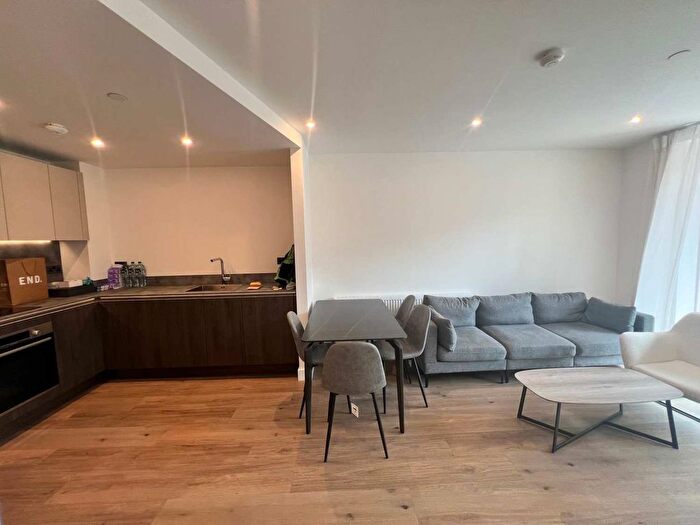
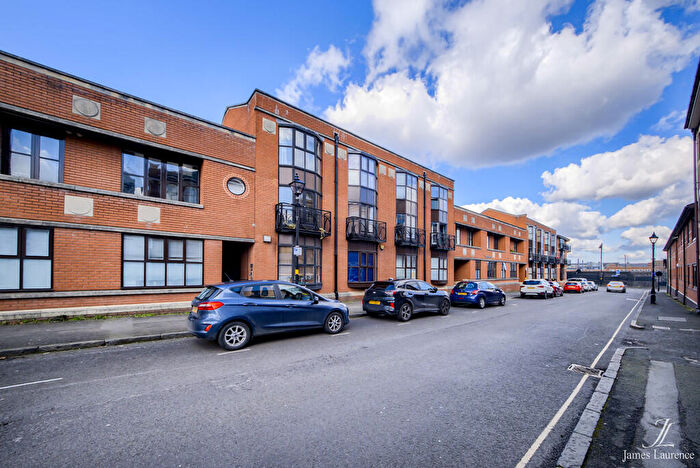
Properties for sale in Newtown
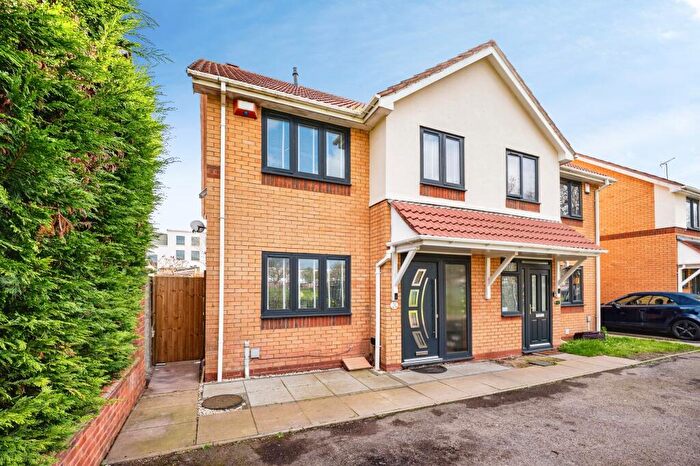
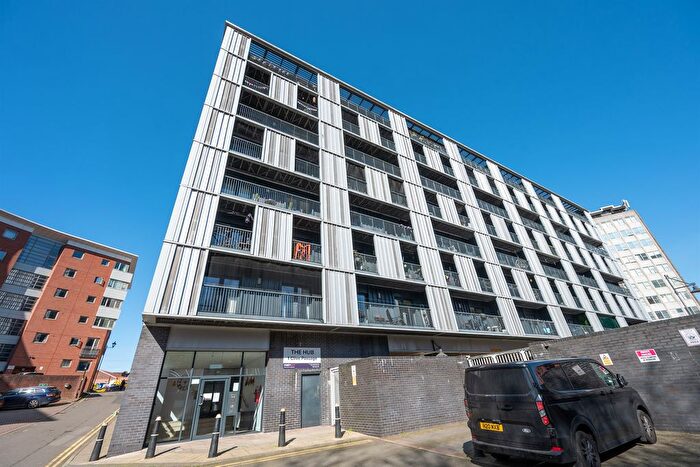
![]()
If you are looking to sell your house, let it out, or receive a property valuation, an expert can help you.
Click the button below to get started.
Roads and Postcodes in Newtown
Navigate through our locations to find the location of your next house in Newtown, Birmingham for sale or to rent.
Transport near Newtown
-
 Birmingham Snow Hill Station
 -
Jewellery Quarter Station
-
Birmingham Moor Street Station
-
Duddeston Station
-
Birmingham New Street Station
-
Aston Station
-
Witton Station
-
Perry Barr Station
-
Birmingham Bordesley Station
-
Five Ways Station
- FAQ
- Price Paid By Year
- Property Type Price
Frequently asked questions about Newtown
What is the average price for a property for sale in Newtown?
The average price for a property for sale in Newtown is £189,600. This amount is 20% lower than the average price in Birmingham. There are 3,597 property listings for sale in Newtown.
What streets have the most expensive properties for sale in Newtown?
The streets with the most expensive properties for sale in Newtown are Shadwell Street at an average of £301,000 and GREAT HAMPTON STREET at an average of £255,400.
What streets have the most affordable properties for sale in Newtown?
The street with the most affordable properties for sale in Newtown is Great Hampton Row at an average of £134,400.
Which train stations are available in or near Newtown?
Some of the train stations available in or near Newtown are Birmingham Snow Hill, Jewellery Quarter and Birmingham Moor Street.
Property Price Paid in Newtown by Year
The average sold property price by year was:
| Year | Average Sold Price | Price Change |
Sold Properties
|
|---|---|---|---|
| 2025 | £150,000 | -52% |
4 Properties |
| 2024 | £227,666 | 15% |
3 Properties |
| 2023 | £193,000 | -63% |
13 Properties |
| 2022 | £314,895 | 15% |
10 Properties |
| 2021 | £266,579 | 19% |
90 Properties |
| 2020 | £215,700 | 22% |
8 Properties |
| 2019 | £168,000 | -89% |
7 Properties |
| 2018 | £318,345 | 37% |
10 Properties |
| 2017 | £198,973 | 58% |
119 Properties |
| 2016 | £83,316 | 53% |
4 Properties |
| 2015 | £39,166 | -111% |
1 Property |
| 2014 | £82,500 | -199% |
1 Property |
| 2009 | £246,500 | 4% |
2 Properties |
| 2008 | £237,000 | -49% |
5 Properties |
| 2005 | £352,500 | 40% |
1 Property |
| 2004 | £210,000 | 62% |
1 Property |
| 2001 | £80,000 | -75% |
1 Property |
| 1999 | £140,000 | 79% |
1 Property |
| 1997 | £30,000 | - |
1 Property |
Property Price per Property Type in Newtown
Here you can find historic sold price data in order to help with your property search.
The average Property Paid Price for specific property types in the last three years are:
| Property Type | Average Sold Price | Sold Properties |
|---|---|---|
| Flat | £219,384.00 | 13 Flats |
| Terraced House | £134,285.00 | 7 Terraced Houses |