
Houses for sale & to rent in B35 6LY, Turnhouse Road, Tyburn, Birmingham
House Prices in B35 6LY, Turnhouse Road, Tyburn
Properties in B35 6LY have no sales history available within the last 3 years. B35 6LY is a postcode in Turnhouse Road located in Tyburn, an area in Birmingham, Birmingham, with 5 households².
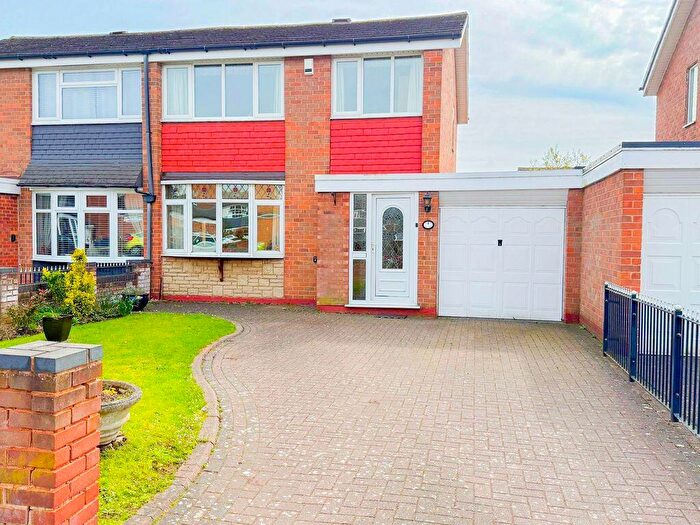
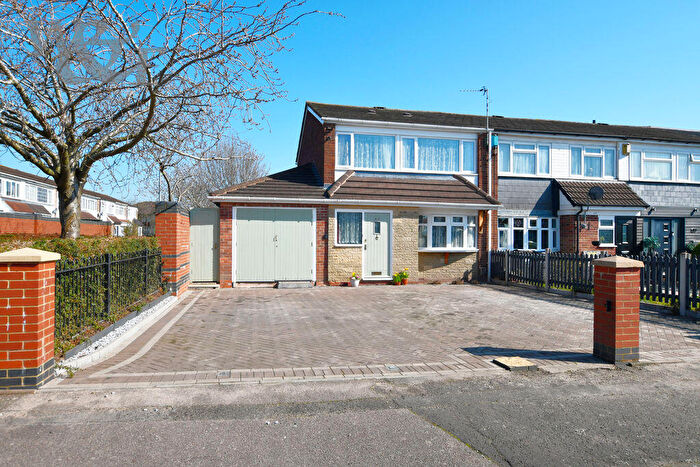
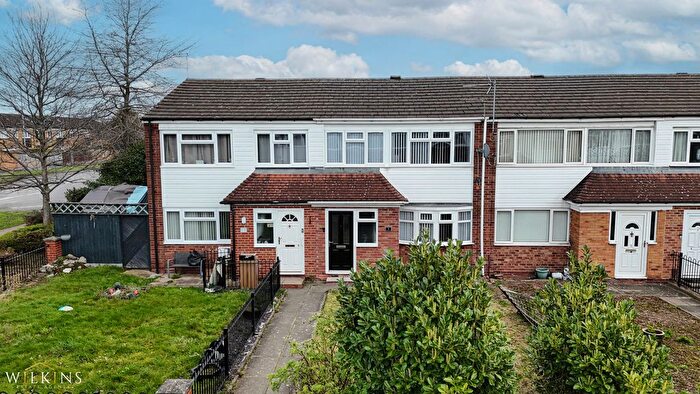
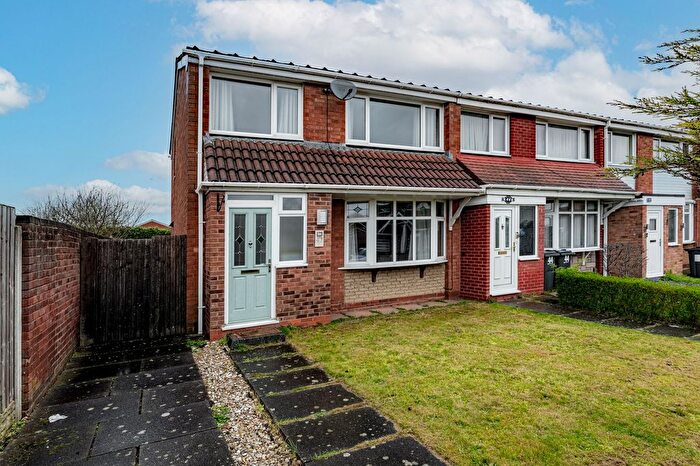
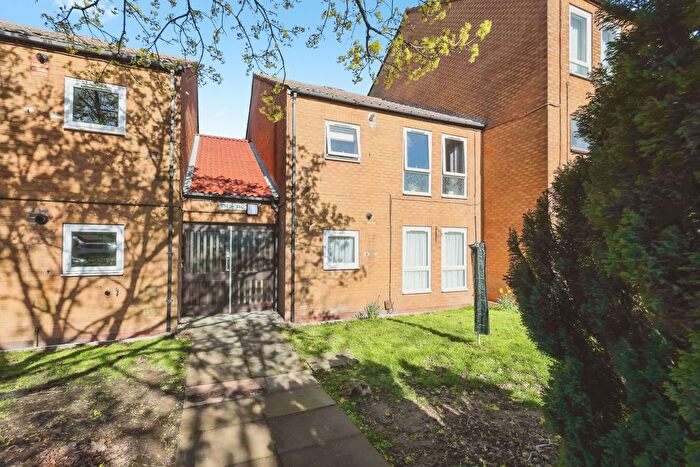
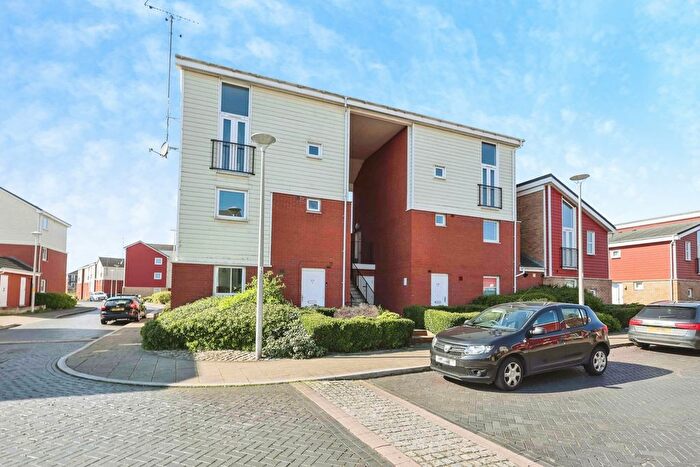
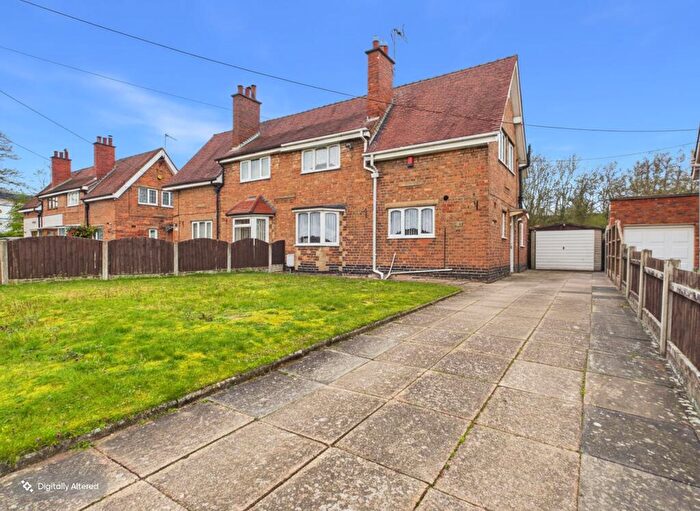
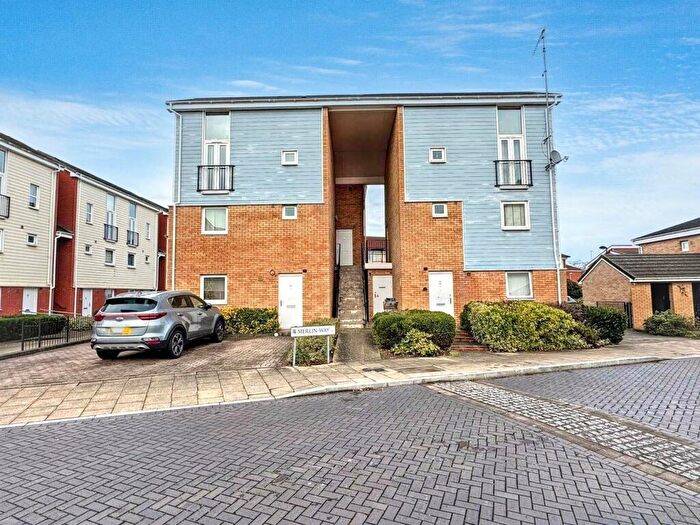
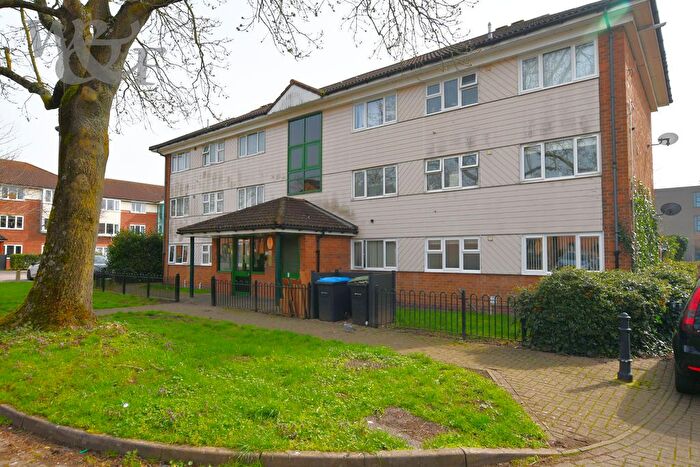
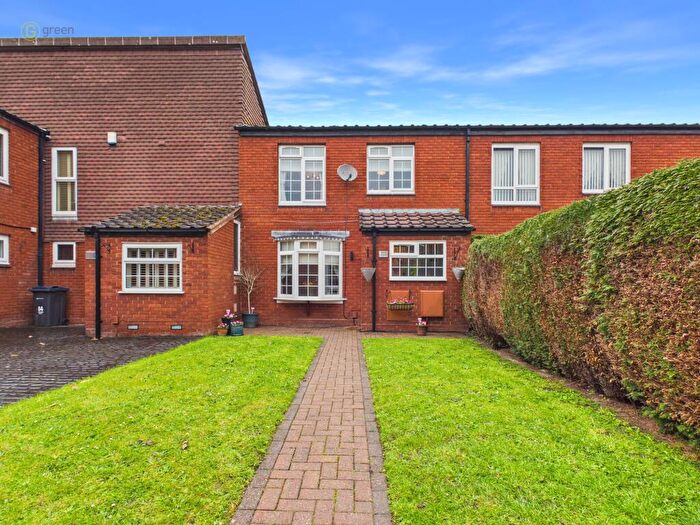
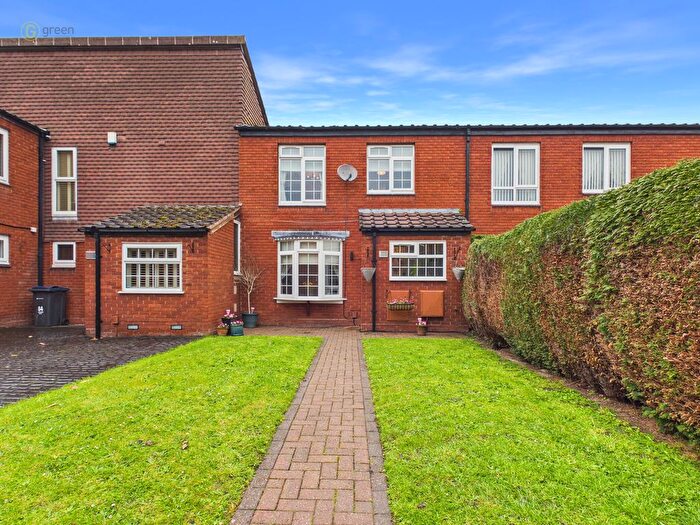
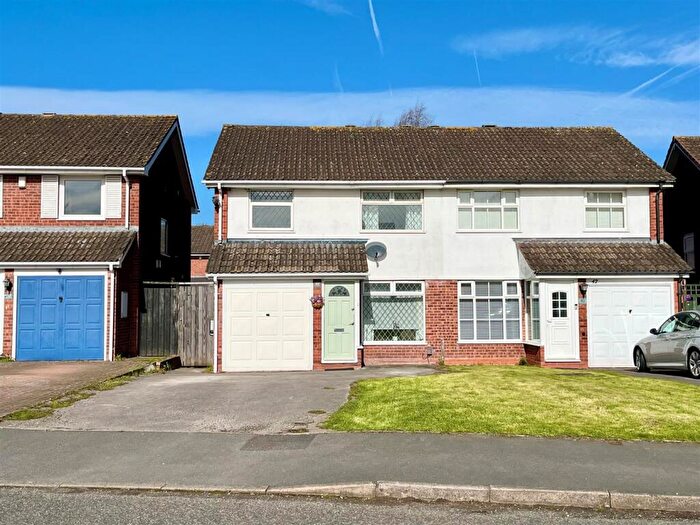
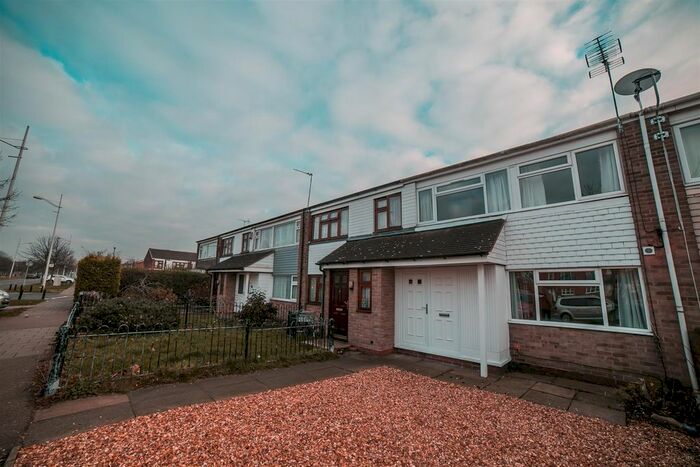
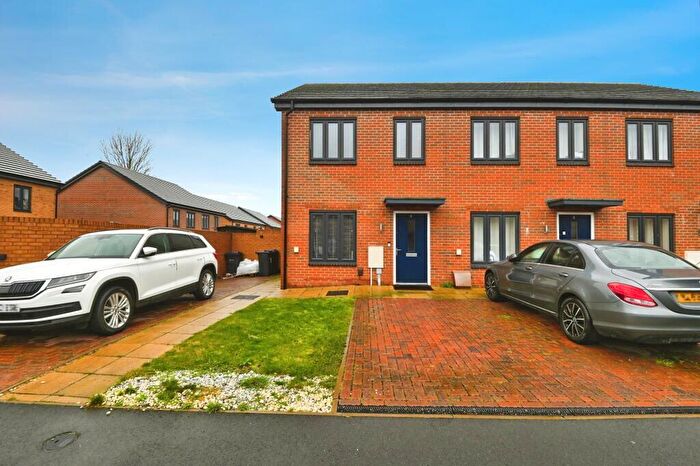
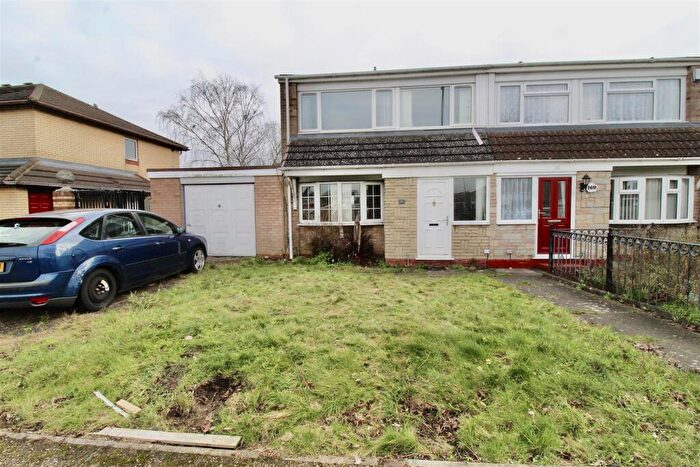
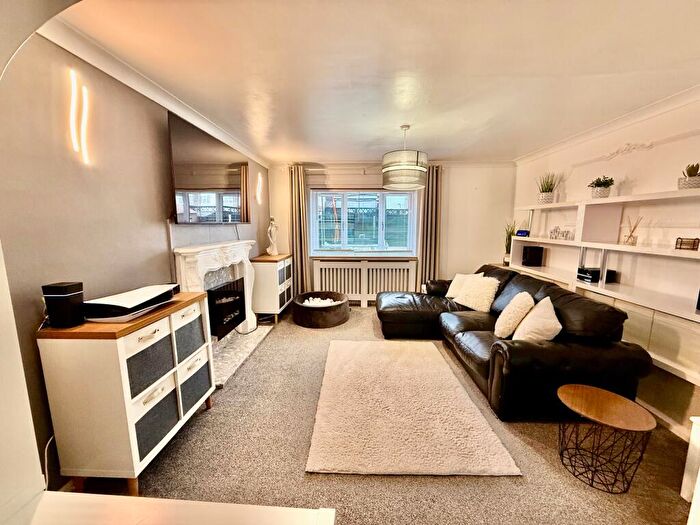
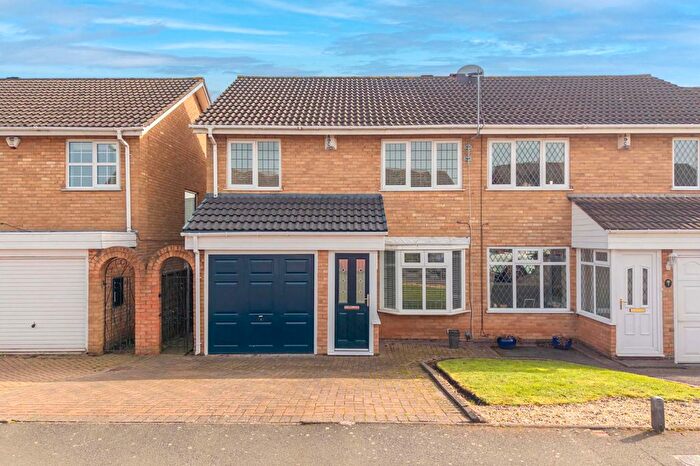
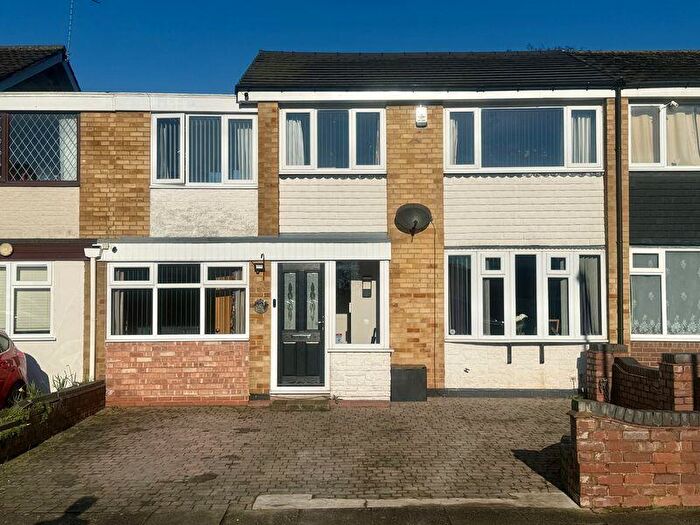
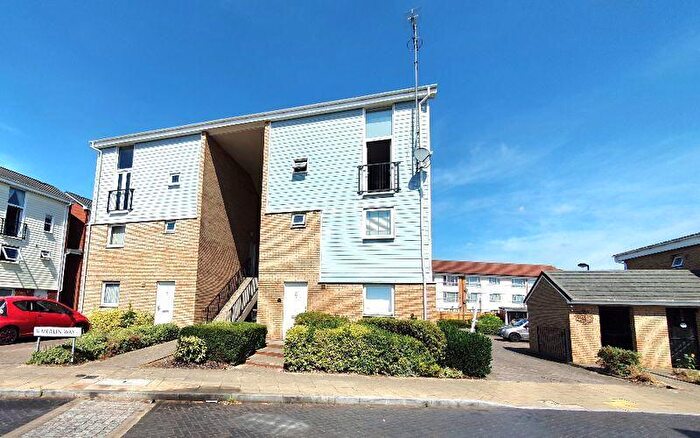
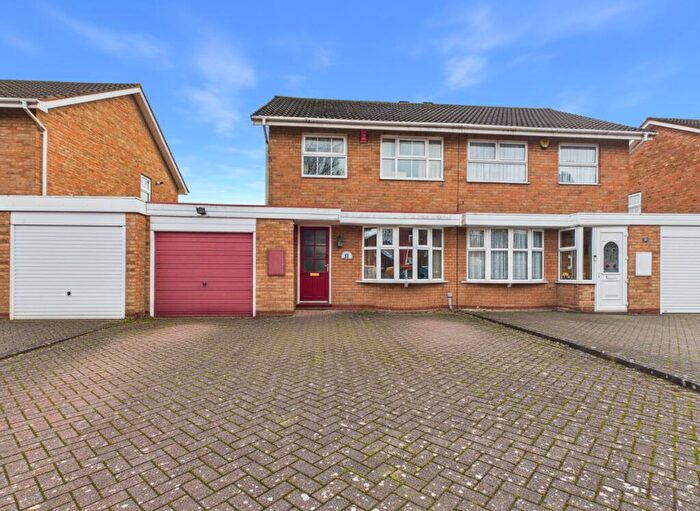
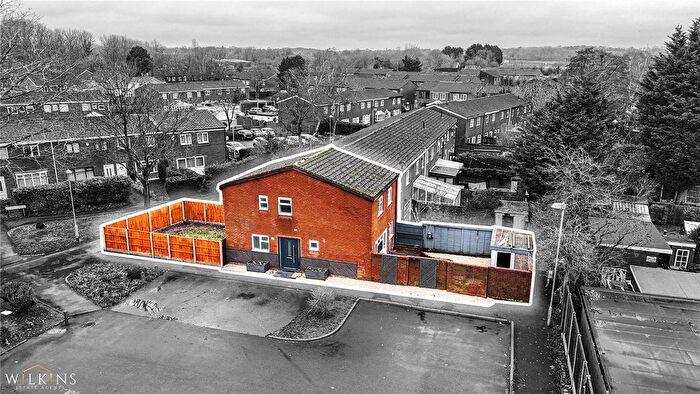
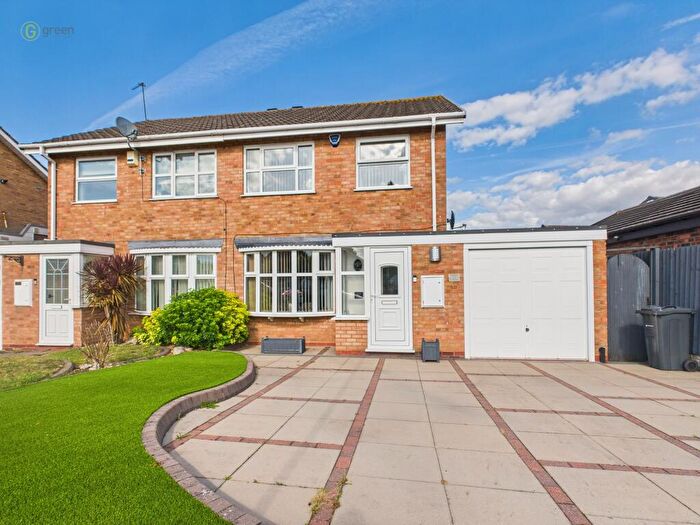
Properties for sale near B35 6LY, Turnhouse Road

![]()
If you are looking to sell your house, let it out, or receive a property valuation, an expert can help you.
Click the button below to get started.

Price Paid in Turnhouse Road, B35 6LY, Tyburn
155 Turnhouse Road, B35 6LY, Tyburn Birmingham
Property 155 has been sold 2 times. The last time it was sold was in 31/05/2017 and the sold price was £164,000.00.
This terraced house, sold as a freehold on 31/05/2017, is a 86 sqm end-terrace house with an EPC rating of C.
| Date | Price | Property Type | Tenure | Classification |
|---|---|---|---|---|
| 31/05/2017 | £164,000.00 | Terraced House | freehold | Established Building |
| 27/04/2012 | £92,000.00 | Terraced House | freehold | Established Building |
147 Turnhouse Road, B35 6LY, Tyburn Birmingham
Property 147 has been sold 1 time. The last time it was sold was in 01/06/2001 and the sold price was £41,000.00.
This is a Terraced House which was sold as a freehold in 01/06/2001
| Date | Price | Property Type | Tenure | Classification |
|---|---|---|---|---|
| 01/06/2001 | £41,000.00 | Terraced House | freehold | Established Building |
153 Turnhouse Road, B35 6LY, Tyburn Birmingham
This is a 82 square meter Mid-terrace House with an EPC rating of C. Currently, there is no transaction history available for this property.
Postcodes in Turnhouse Road, Tyburn
Navigate through other locations in Turnhouse Road, Tyburn, Birmingham to see more property listings for sale or to rent.
Transport near B35 6LY, Turnhouse Road
-
 Water Orton Station
 -
Chester Road Station
-
Erdington Station
-
Wylde Green Station
-
Stechford Station
-
Lea Hall Station
House price paid reports for B35 6LY, Turnhouse Road
Click on the buttons below to see price paid reports by year or property price:
- Price Paid By Year
Property Price Paid in B35 6LY, Turnhouse Road by Year
The average sold property price by year was:
| Year | Average Sold Price | Price Change |
Sold Properties
|
|---|---|---|---|
| 2017 | £164,000 | 44% |
1 Property |
| 2012 | £92,000 | 55% |
1 Property |
| 2001 | £41,000 | - |
1 Property |