
Houses for sale & to rent in B35 7HP, Round Moor Walk, Tyburn, Birmingham
House Prices in B35 7HP, Round Moor Walk, Tyburn
Properties in B35 7HP have no sales history available within the last 3 years. B35 7HP is a postcode in Round Moor Walk located in Tyburn, an area in Birmingham, Birmingham, with 14 households².
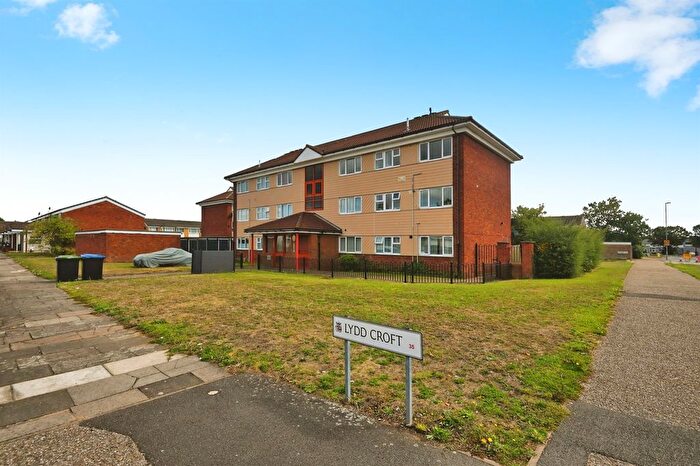
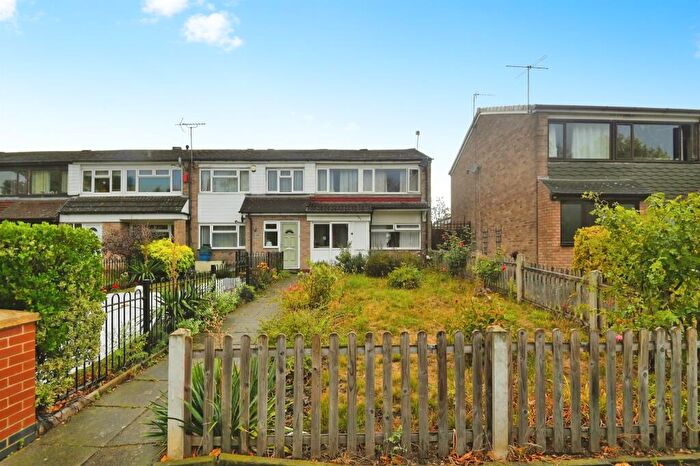
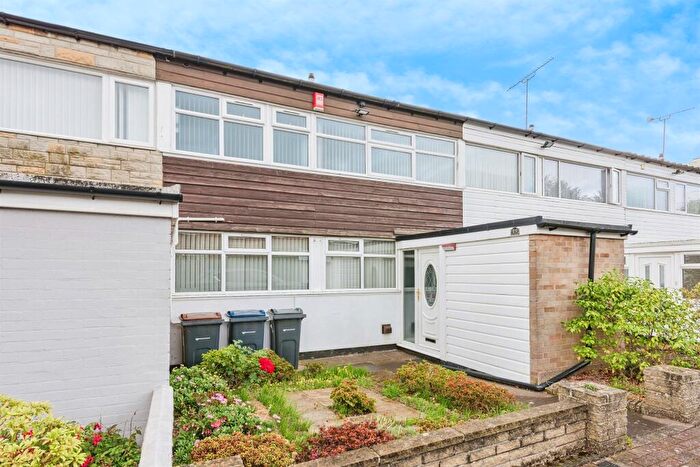
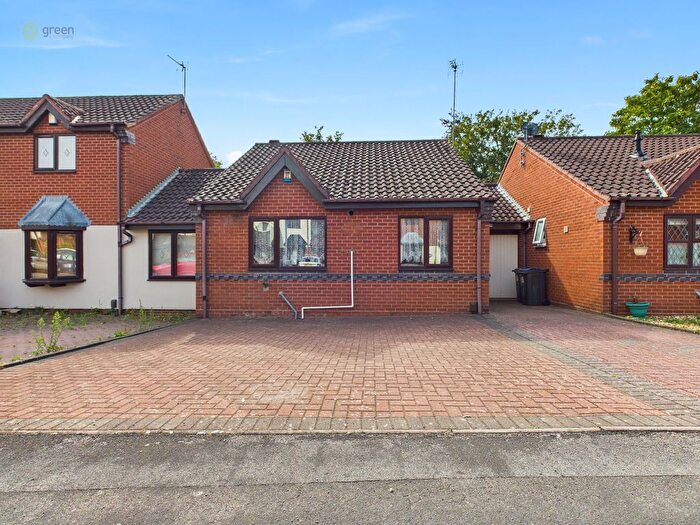
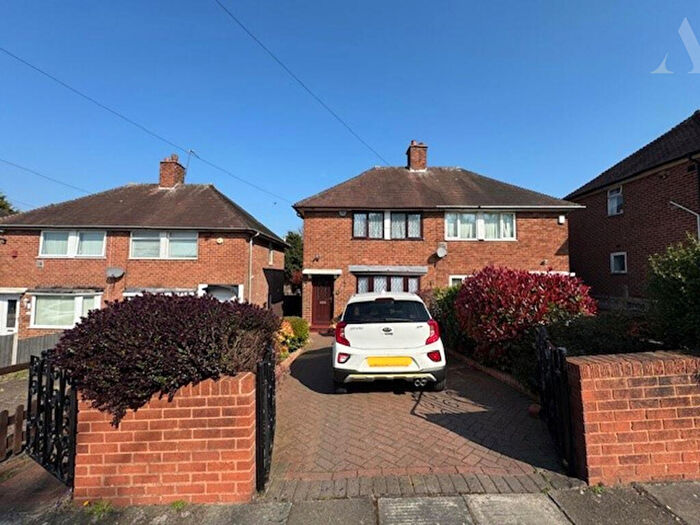
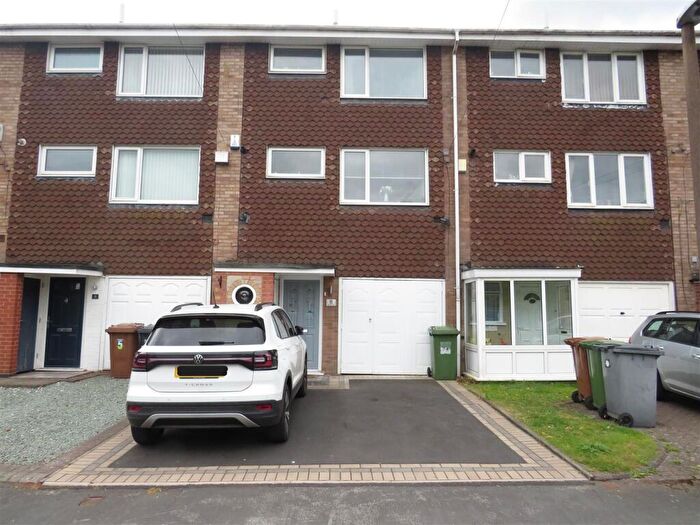
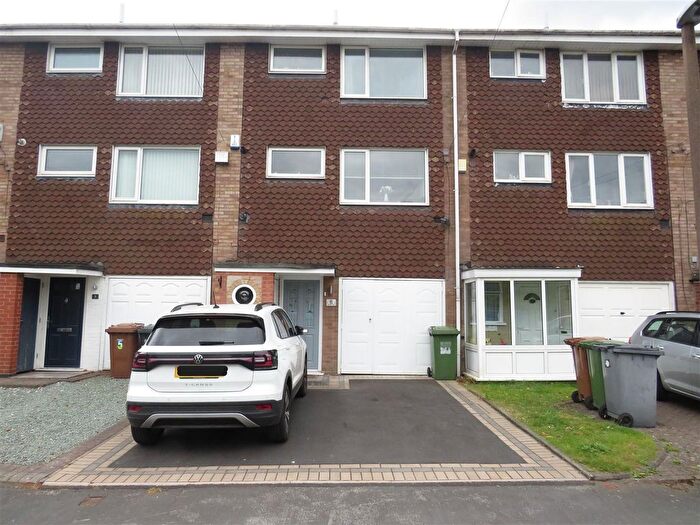
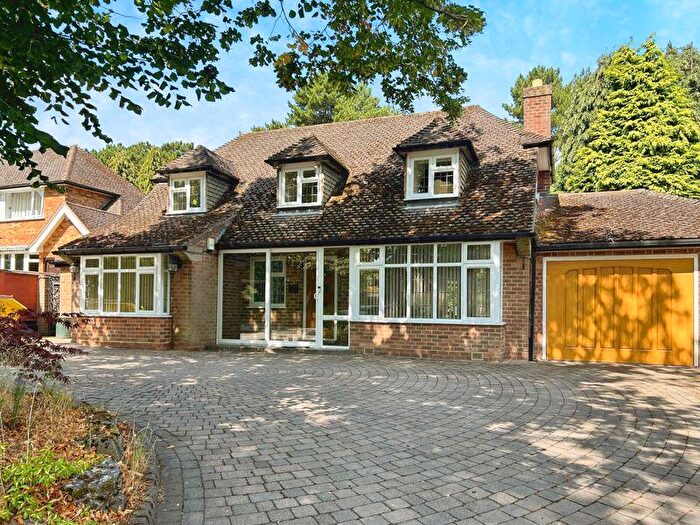
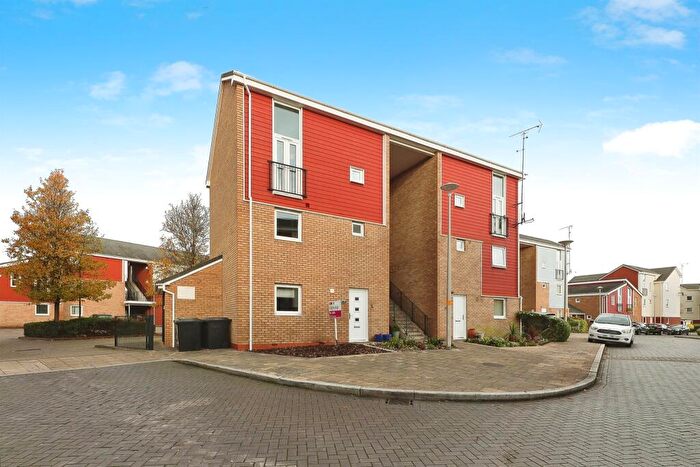
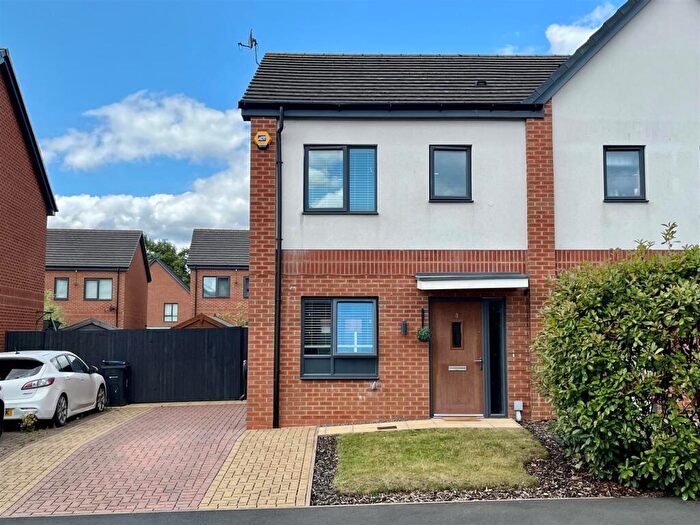
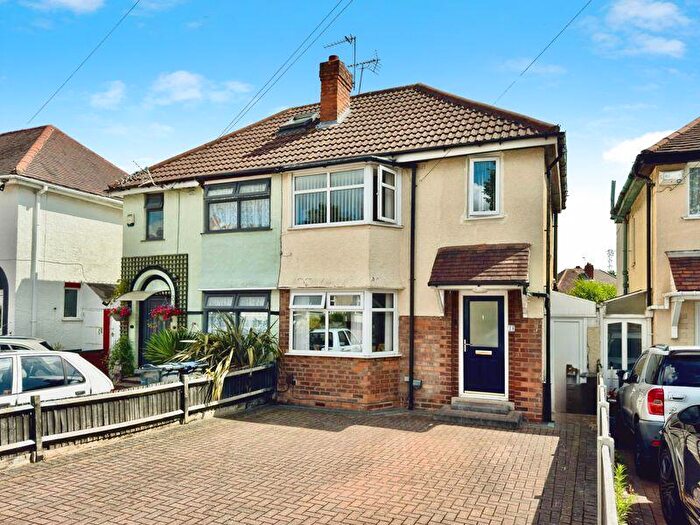
Properties for sale near B35 7HP, Round Moor Walk


![]()
If you are looking to sell your house, let it out, or receive a property valuation, an expert can help you.
Click the button below to get started.


Price Paid in Round Moor Walk, B35 7HP, Tyburn
52 Round Moor Walk, B35 7HP, Tyburn Birmingham
Property 52 has been sold 2 times. The last time it was sold was in 25/06/2018 and the sold price was £115,000.00.
This terraced house, sold as a freehold on 25/06/2018, is a 79 sqm mid-terrace house with an EPC rating of C.
| Date | Price | Property Type | Tenure | Classification |
|---|---|---|---|---|
| 25/06/2018 | £115,000.00 | Terraced House | freehold | Established Building |
| 30/03/2007 | £105,000.00 | Terraced House | freehold | Established Building |
56 Round Moor Walk, B35 7HP, Tyburn Birmingham
Property 56 has been sold 3 times. The last time it was sold was in 17/02/2017 and the sold price was £140,000.00.
This terraced house, sold as a freehold on 17/02/2017, is a 81 sqm end-terrace house with an EPC rating of E.
| Date | Price | Property Type | Tenure | Classification |
|---|---|---|---|---|
| 17/02/2017 | £140,000.00 | Terraced House | freehold | Established Building |
| 02/10/2007 | £105,000.00 | Terraced House | freehold | Established Building |
| 13/08/2004 | £109,950.00 | Terraced House | freehold | Established Building |
62 Round Moor Walk, B35 7HP, Tyburn Birmingham
Property 62 has been sold 2 times. The last time it was sold was in 02/04/2015 and the sold price was £90,000.00.
This terraced house, sold as a freehold on 02/04/2015, is a 81 sqm mid-terrace house with an EPC rating of E.
| Date | Price | Property Type | Tenure | Classification |
|---|---|---|---|---|
| 02/04/2015 | £90,000.00 | Terraced House | freehold | Established Building |
| 31/03/2005 | £90,000.00 | Terraced House | freehold | Established Building |
64 Round Moor Walk, B35 7HP, Tyburn Birmingham
Property 64 has been sold 2 times. The last time it was sold was in 30/09/2014 and the sold price was £105,000.00.
This terraced house, sold as a freehold on 30/09/2014, is a 76 sqm semi-detached house with an EPC rating of C.
| Date | Price | Property Type | Tenure | Classification |
|---|---|---|---|---|
| 30/09/2014 | £105,000.00 | Terraced House | freehold | Established Building |
| 19/02/2010 | £115,000.00 | Terraced House | freehold | Established Building |
70 Round Moor Walk, B35 7HP, Tyburn Birmingham
Property 70 has been sold 1 time. The last time it was sold was in 28/11/1997 and the sold price was £41,000.00.
This is a Terraced House which was sold as a freehold in 28/11/1997
| Date | Price | Property Type | Tenure | Classification |
|---|---|---|---|---|
| 28/11/1997 | £41,000.00 | Terraced House | freehold | Established Building |
66 Round Moor Walk, B35 7HP, Tyburn Birmingham
This is a 83 square meter End-terrace House with an EPC rating of C. Currently, there is no transaction history available for this property.
60 Round Moor Walk, B35 7HP, Tyburn Birmingham
This is a 80 square meter Mid-terrace House with an EPC rating of C. Currently, there is no transaction history available for this property.
58 Round Moor Walk, B35 7HP, Tyburn Birmingham
This is a 77 square meter End-terrace House with an EPC rating of C. Currently, there is no transaction history available for this property.
Postcodes in Round Moor Walk, Tyburn
Navigate through other locations in Round Moor Walk, Tyburn, Birmingham to see more property listings for sale or to rent.
Transport near B35 7HP, Round Moor Walk
-
 Water Orton Station
 -
Chester Road Station
-
Erdington Station
-
Stechford Station
-
Lea Hall Station
-
Wylde Green Station
-
Gravelly Hill Station
House price paid reports for B35 7HP, Round Moor Walk
Click on the buttons below to see price paid reports by year or property price:
- Price Paid By Year
Property Price Paid in B35 7HP, Round Moor Walk by Year
The average sold property price by year was:
| Year | Average Sold Price | Price Change |
Sold Properties
|
|---|---|---|---|
| 2018 | £115,000 | -22% |
1 Property |
| 2017 | £140,000 | 36% |
1 Property |
| 2015 | £90,000 | -17% |
1 Property |
| 2014 | £105,000 | -10% |
1 Property |
| 2010 | £115,000 | 9% |
1 Property |
| 2007 | £105,000 | 14% |
2 Properties |
| 2005 | £90,000 | -22% |
1 Property |
| 2004 | £109,950 | 63% |
1 Property |
| 1997 | £41,000 | - |
1 Property |