
Houses for sale & to rent in Boscombe West, Bournemouth
House Prices in Boscombe West
Properties in Boscombe West have an average house price of £202k and had 511 Property Transactions within the last 3 years¹.
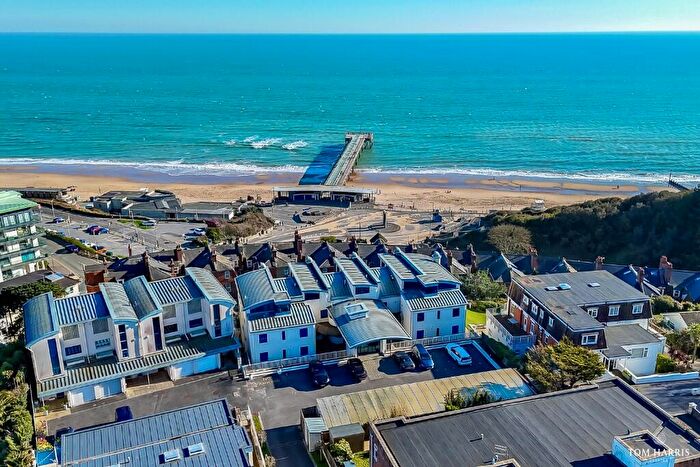
Boscombe West is an area in Bournemouth, Bournemouth with 5,452 households², where the most expensive property was sold for £1.28M.
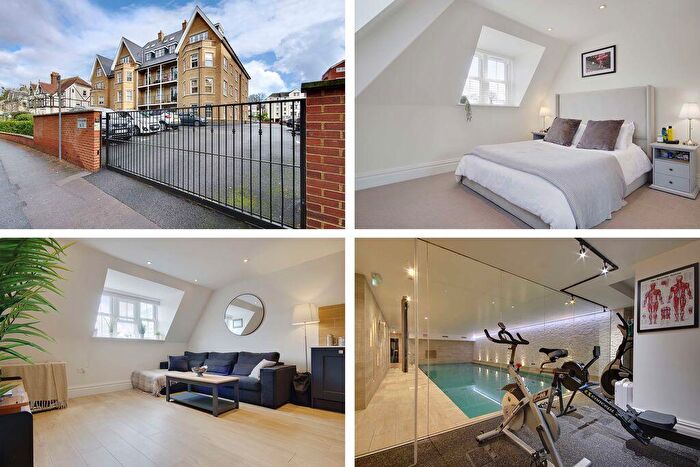
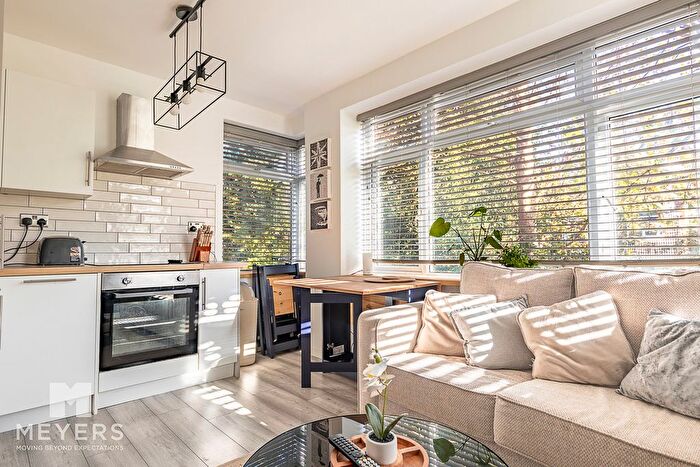
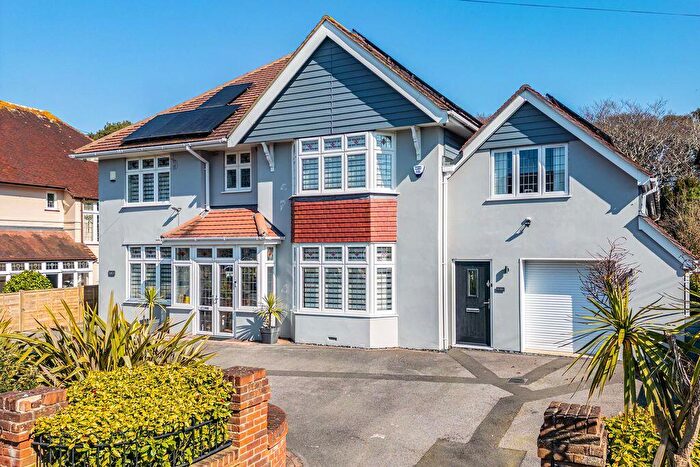
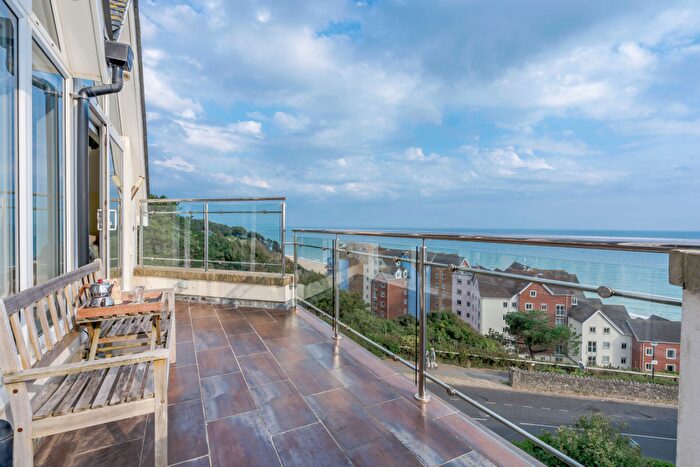
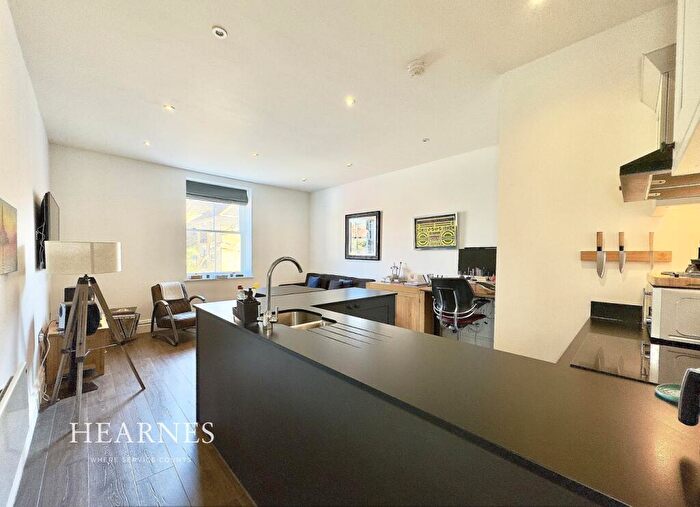
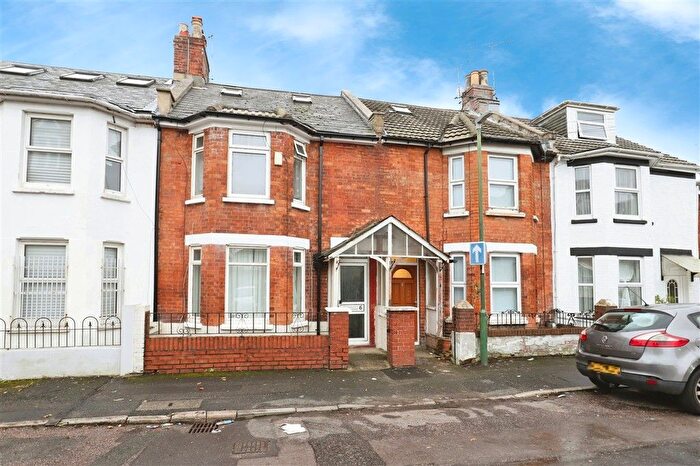
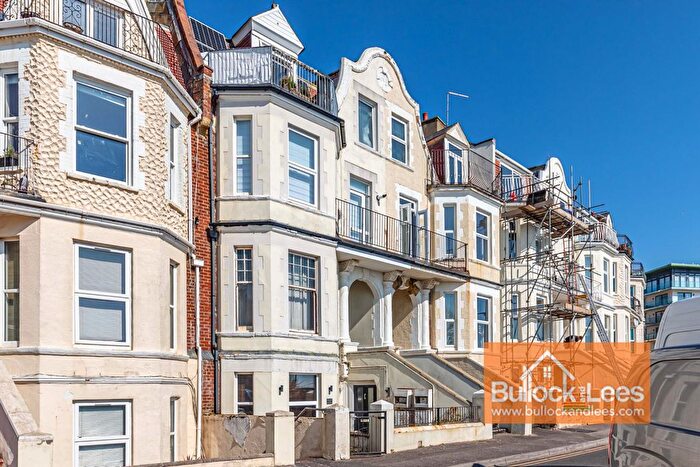
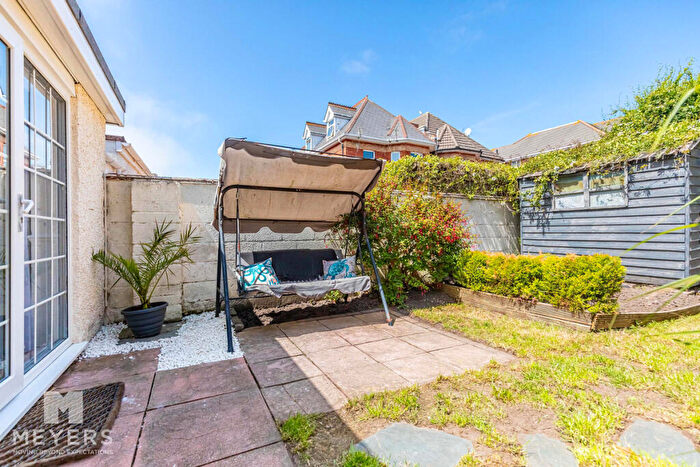
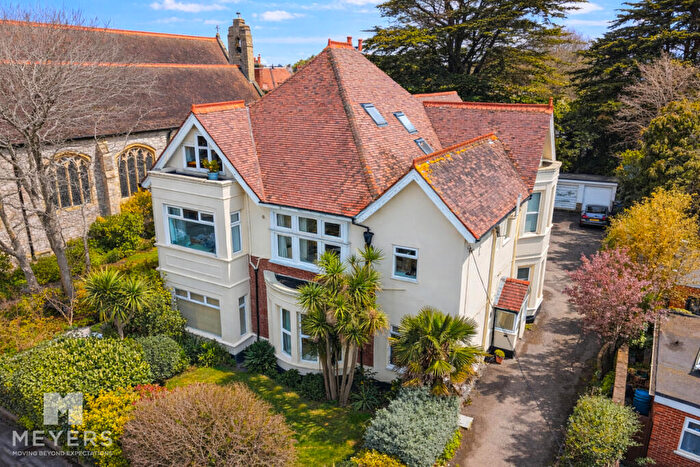
Properties for sale in Boscombe West

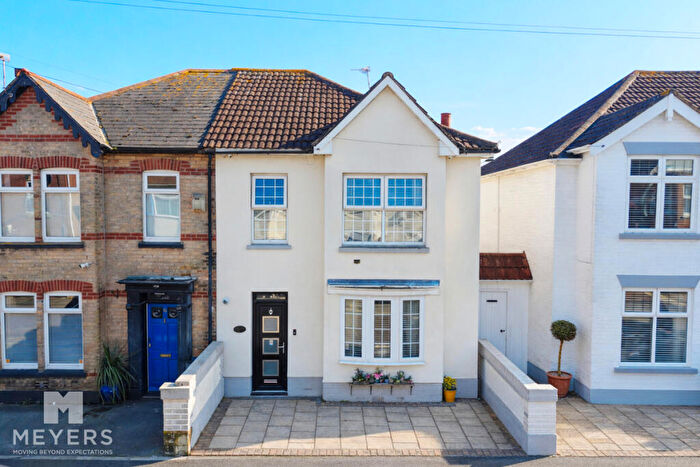
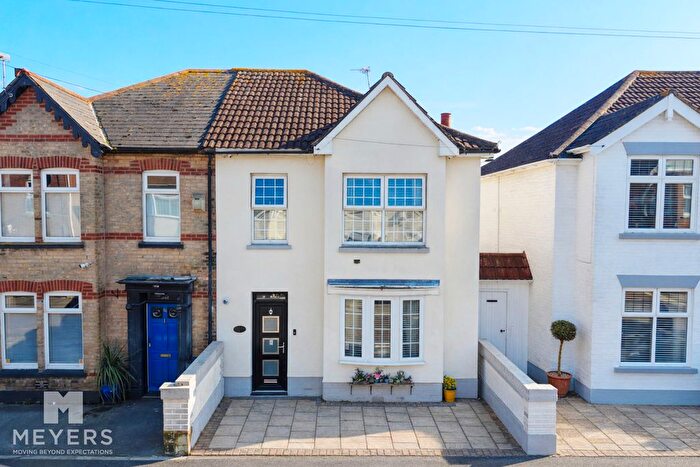
![]()
If you are looking to sell your house, let it out, or receive a property valuation, an expert can help you.
Click the button below to get started.

Roads and Postcodes in Boscombe West
Navigate through our locations to find the location of your next house in Boscombe West, Bournemouth for sale or to rent.
Transport near Boscombe West

- FAQ
- Price Paid By Year
- Property Type Price
Frequently asked questions about Boscombe West
What is the average price for a property for sale in Boscombe West?
The average price for a property for sale in Boscombe West is £201,865. This amount is 41% lower than the average price in Bournemouth. There are 3,487 property listings for sale in Boscombe West.
What streets have the most expensive properties for sale in Boscombe West?
The streets with the most expensive properties for sale in Boscombe West are The Marina at an average of £496,666, Michelgrove Road at an average of £403,750 and Marina Close at an average of £370,833.
What streets have the most affordable properties for sale in Boscombe West?
The streets with the most affordable properties for sale in Boscombe West are Adeline Road at an average of £125,000, Gordon Road at an average of £127,500 and Cecil Road at an average of £128,777.
Which train stations are available in or near Boscombe West?
Some of the train stations available in or near Boscombe West are Pokesdown, Bournemouth and Christchurch.
Property Price Paid in Boscombe West by Year
The average sold property price by year was:
| Year | Average Sold Price | Price Change |
Sold Properties
|
|---|---|---|---|
| 2026 | £207,833 | 5% |
3 Properties |
| 2025 | £197,065 | 4% |
138 Properties |
| 2024 | £188,997 | -15% |
181 Properties |
| 2023 | £217,599 | 2% |
189 Properties |
| 2022 | £213,778 | -1% |
295 Properties |
| 2021 | £216,962 | 11% |
284 Properties |
| 2020 | £193,685 | 9% |
195 Properties |
| 2019 | £176,113 | -10% |
235 Properties |
| 2018 | £194,250 | -5% |
321 Properties |
| 2017 | £204,667 | 18% |
286 Properties |
| 2016 | £168,807 | -6% |
364 Properties |
| 2015 | £178,891 | 9% |
332 Properties |
| 2014 | £162,259 | 13% |
315 Properties |
| 2013 | £141,853 | -14% |
180 Properties |
| 2012 | £162,120 | -3% |
193 Properties |
| 2011 | £167,743 | -19% |
184 Properties |
| 2010 | £199,963 | 6% |
165 Properties |
| 2009 | £187,646 | -21% |
184 Properties |
| 2008 | £227,391 | 19% |
252 Properties |
| 2007 | £184,313 | 13% |
479 Properties |
| 2006 | £160,999 | -2% |
471 Properties |
| 2005 | £164,886 | 6% |
397 Properties |
| 2004 | £154,533 | 12% |
501 Properties |
| 2003 | £135,847 | 13% |
476 Properties |
| 2002 | £118,023 | 34% |
525 Properties |
| 2001 | £78,101 | 3% |
420 Properties |
| 2000 | £75,718 | 22% |
391 Properties |
| 1999 | £58,839 | 4% |
358 Properties |
| 1998 | £56,238 | 15% |
346 Properties |
| 1997 | £47,924 | 11% |
296 Properties |
| 1996 | £42,755 | 7% |
239 Properties |
| 1995 | £39,836 | - |
236 Properties |
Property Price per Property Type in Boscombe West
Here you can find historic sold price data in order to help with your property search.
The average Property Paid Price for specific property types in the last three years are:
| Property Type | Average Sold Price | Sold Properties |
|---|---|---|
| Flat | £184,240.00 | 455 Flats |
| Semi Detached House | £362,958.00 | 17 Semi Detached Houses |
| Detached House | £454,769.00 | 13 Detached Houses |
| Terraced House | £278,519.00 | 26 Terraced Houses |