
Houses for sale & to rent in East Cliff & Springbourne, Bournemouth
House Prices in East Cliff & Springbourne
Properties in East Cliff & Springbourne have an average house price of £198k and had 20 Property Transactions within the last 3 years¹.
East Cliff & Springbourne is an area in Bournemouth, Bournemouth with 375 households², where the most expensive property was sold for £305k.
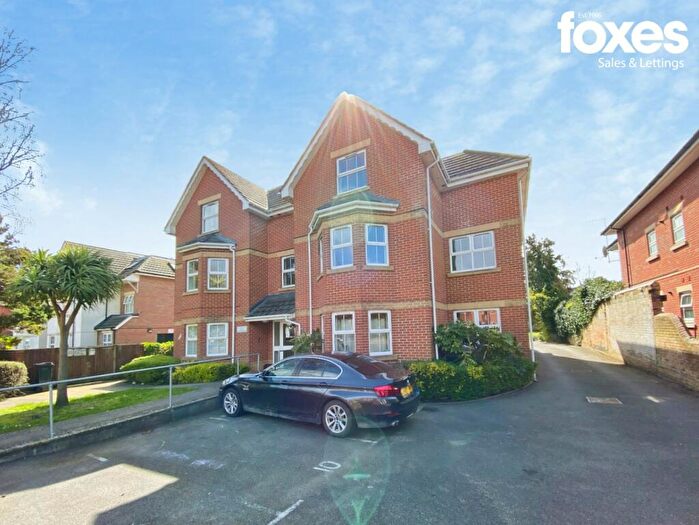
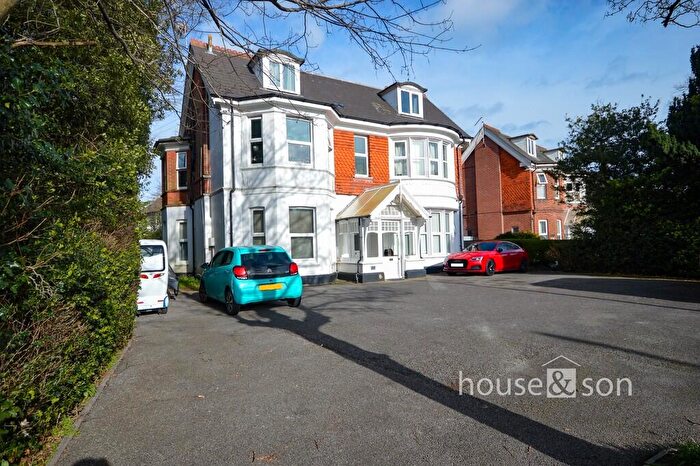
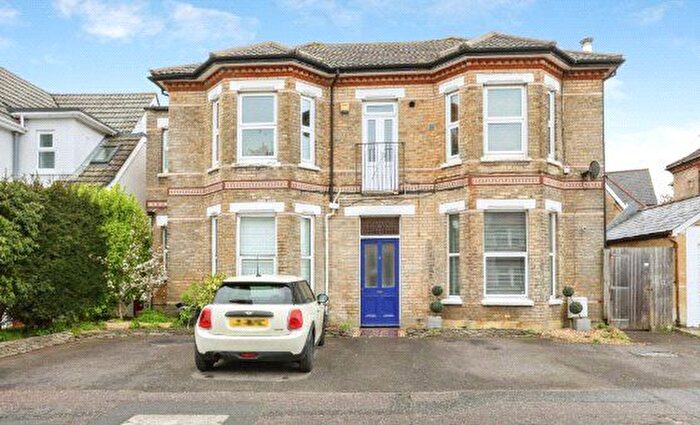
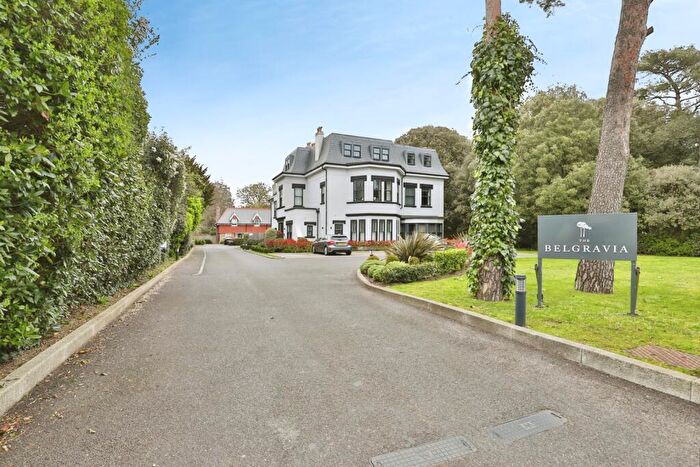
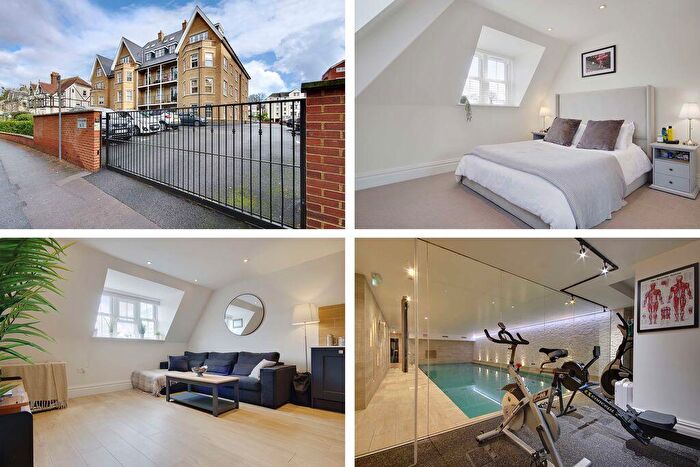
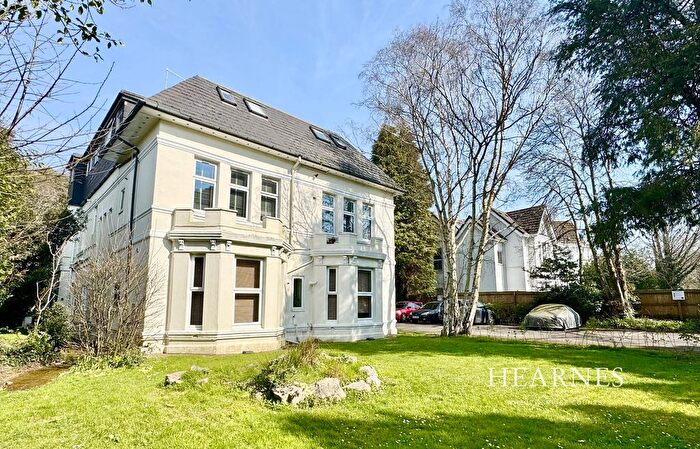
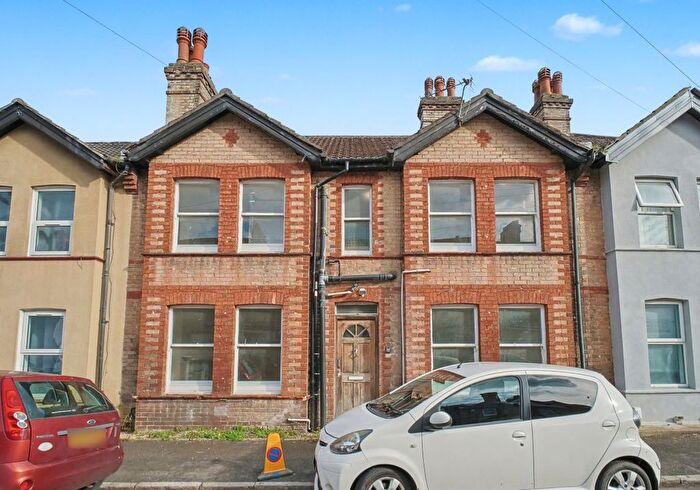
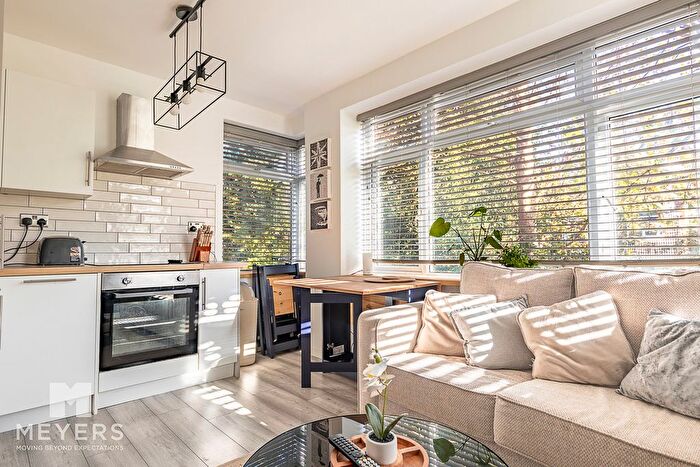
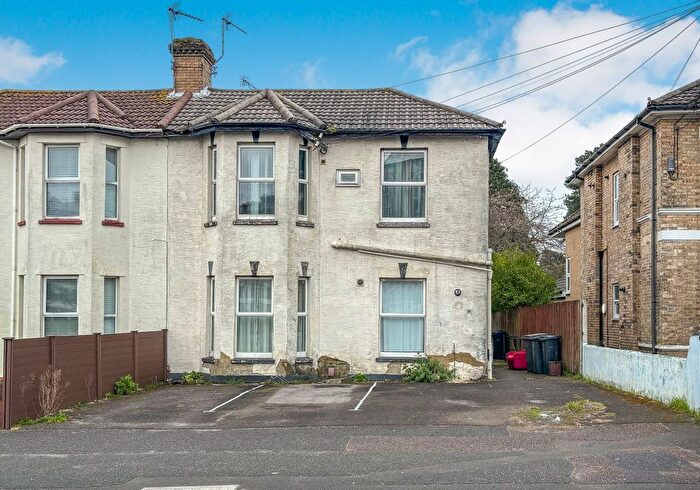
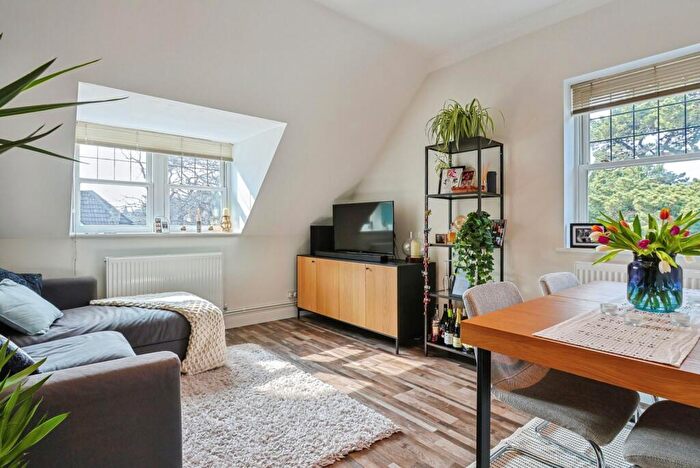
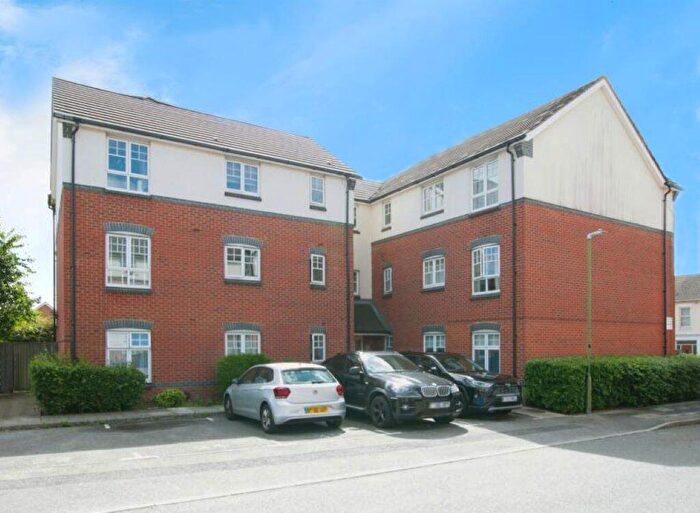
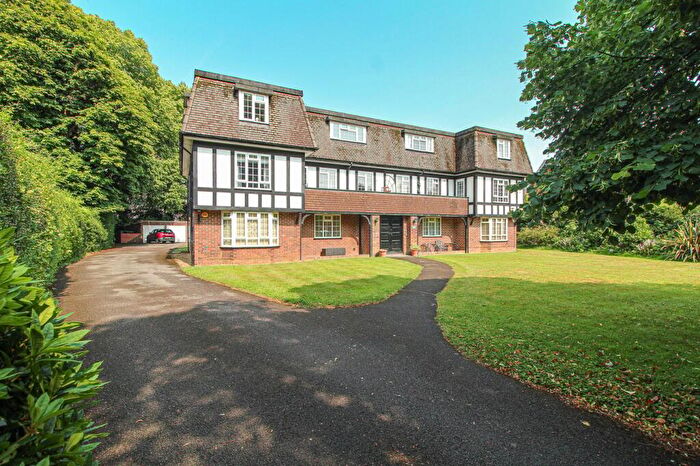
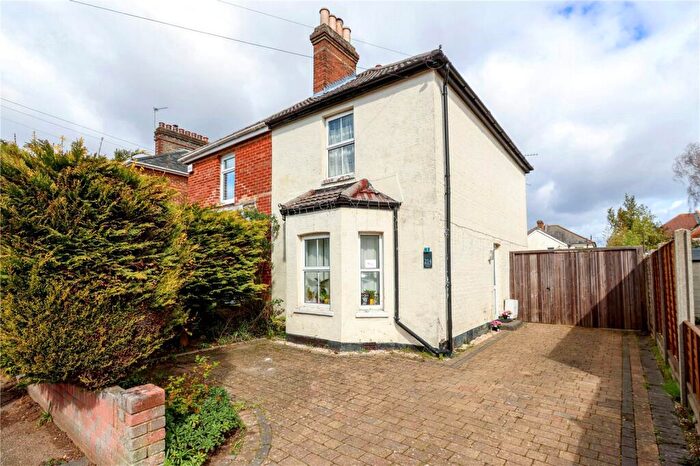
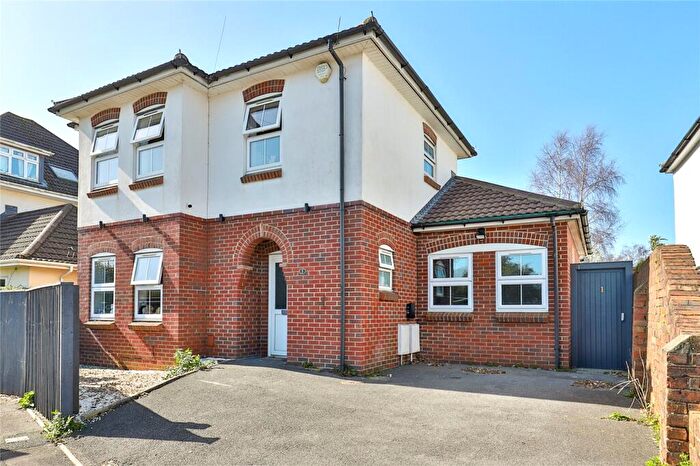
Properties for sale in East Cliff & Springbourne

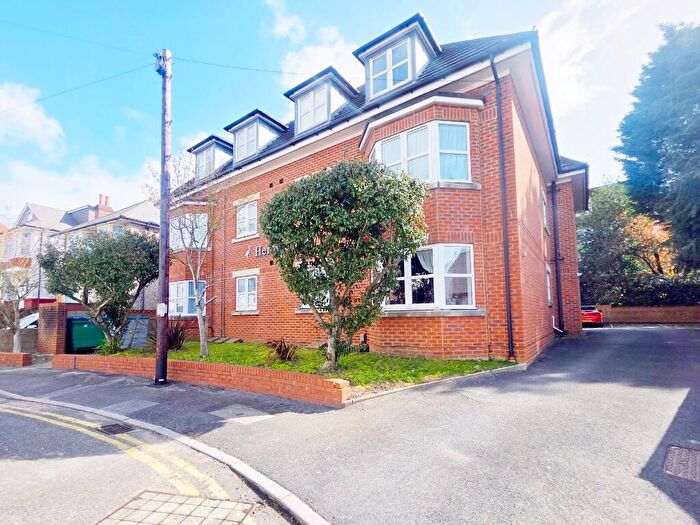
![]()
If you are looking to sell your house, let it out, or receive a property valuation, an expert can help you.
Click the button below to get started.

Roads and Postcodes in East Cliff & Springbourne
Navigate through our locations to find the location of your next house in East Cliff & Springbourne, Bournemouth for sale or to rent.
Transport near East Cliff & Springbourne

- FAQ
- Price Paid By Year
- Property Type Price
Frequently asked questions about East Cliff & Springbourne
What is the average price for a property for sale in East Cliff & Springbourne?
The average price for a property for sale in East Cliff & Springbourne is £197,762. This amount is 42% lower than the average price in Bournemouth. There are 3,572 property listings for sale in East Cliff & Springbourne.
What streets have the most expensive properties for sale in East Cliff & Springbourne?
The streets with the most expensive properties for sale in East Cliff & Springbourne are Knyveton Road at an average of £232,865, Avon Close at an average of £190,000 and Manor Road at an average of £150,000.
What streets have the most affordable properties for sale in East Cliff & Springbourne?
The streets with the most affordable properties for sale in East Cliff & Springbourne are Southcote Road at an average of £110,666, Holdenhurst Road at an average of £121,000 and Wellington Road at an average of £135,000.
Which train stations are available in or near East Cliff & Springbourne?
Some of the train stations available in or near East Cliff & Springbourne are Bournemouth, Pokesdown and Branksome.
Property Price Paid in East Cliff & Springbourne by Year
The average sold property price by year was:
| Year | Average Sold Price | Price Change |
Sold Properties
|
|---|---|---|---|
| 2025 | £158,500 | -42% |
9 Properties |
| 2024 | £225,035 | -6% |
7 Properties |
| 2023 | £238,375 | -9% |
4 Properties |
| 2022 | £261,000 | 16% |
9 Properties |
| 2021 | £220,312 | 39% |
8 Properties |
| 2020 | £134,666 | 15% |
9 Properties |
| 2019 | £114,579 | -70% |
12 Properties |
| 2018 | £194,454 | -7% |
11 Properties |
| 2017 | £208,569 | 35% |
72 Properties |
| 2016 | £135,217 | -43% |
23 Properties |
| 2015 | £194,000 | 29% |
12 Properties |
| 2014 | £136,914 | -302% |
7 Properties |
| 2003 | £550,000 | - |
1 Property |
Property Price per Property Type in East Cliff & Springbourne
Here you can find historic sold price data in order to help with your property search.
The average Property Paid Price for specific property types in the last three years are:
| Property Type | Average Sold Price | Sold Properties |
|---|---|---|
| Flat | £197,762.00 | 20 Flats |