
Houses for sale & to rent in Central, Bournemouth
House Prices in Central
Properties in Central have an average house price of £234,407.00 and had 804 Property Transactions within the last 3 years¹.
Central is an area in Bournemouth, Bournemouth with 4,809 households², where the most expensive property was sold for £1,495,000.00.
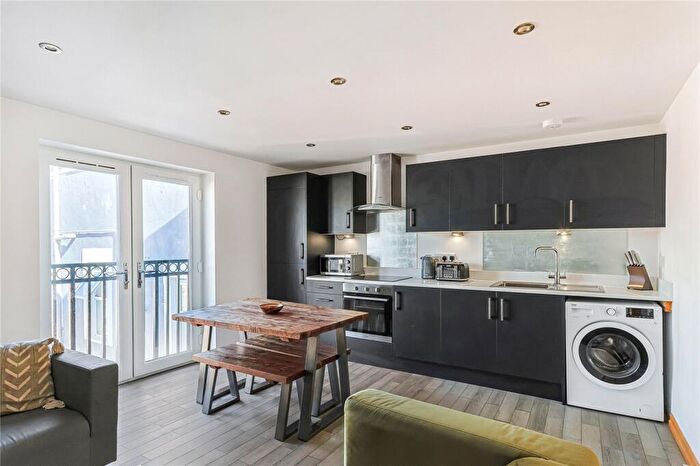
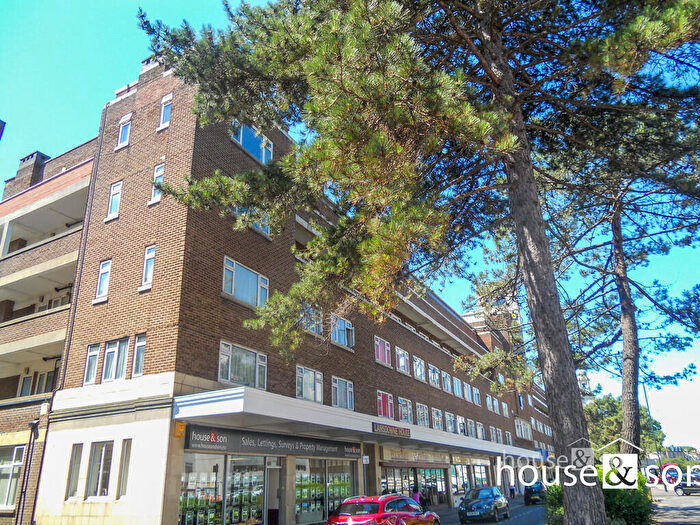
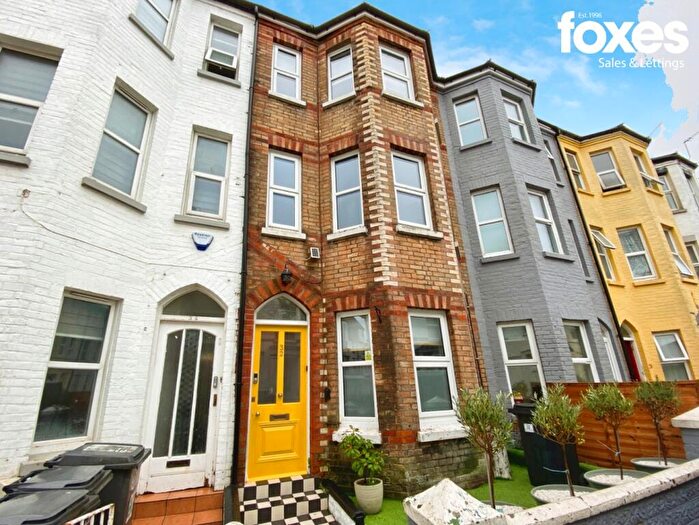
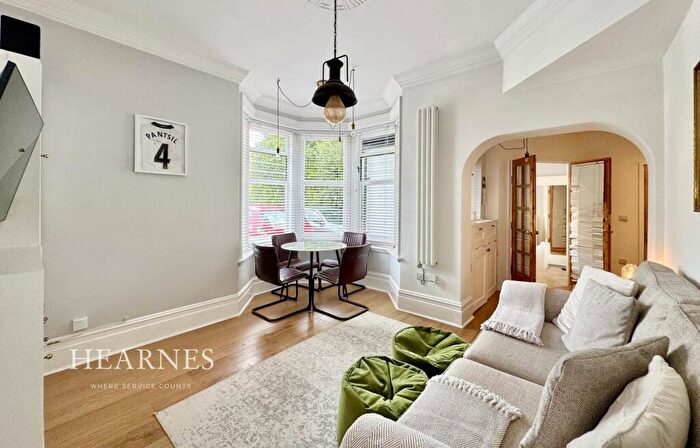
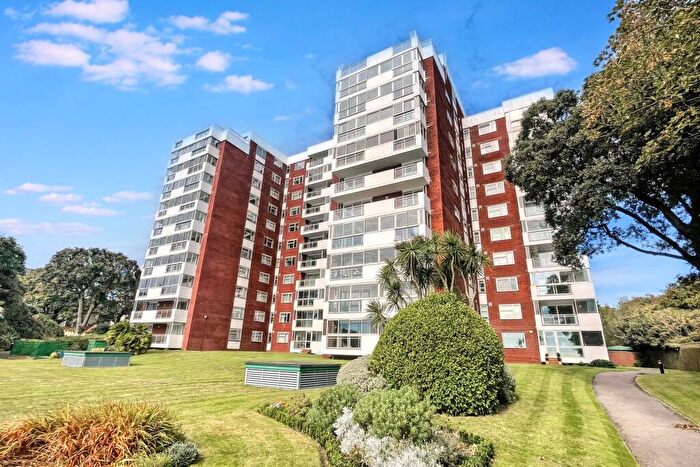
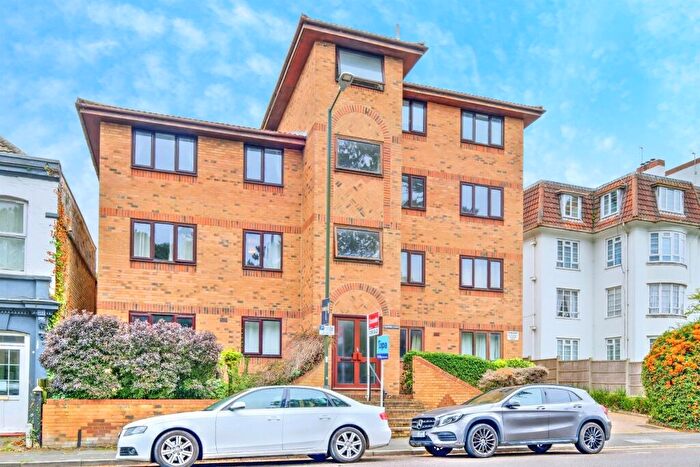
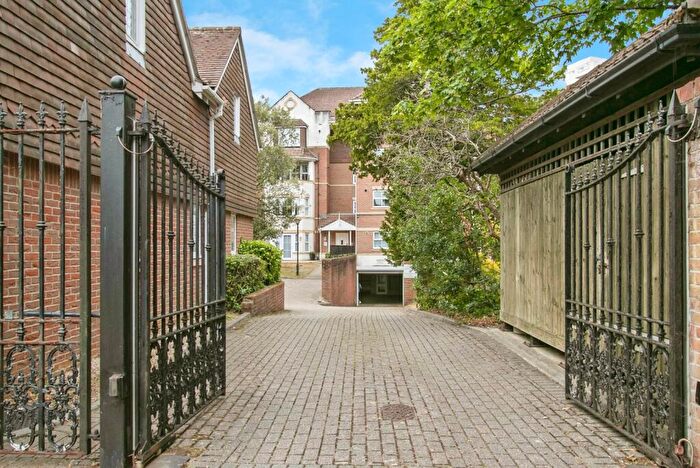
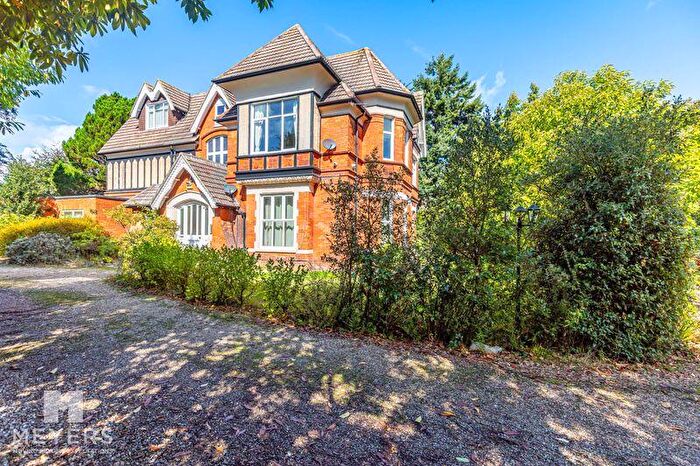
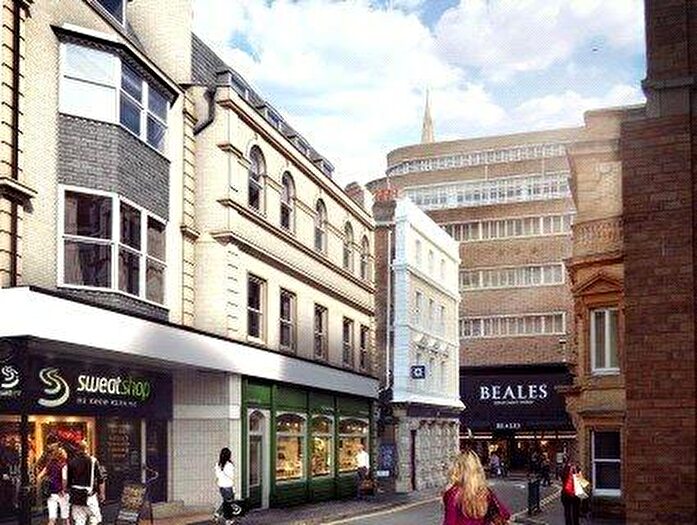
Properties for sale in Central

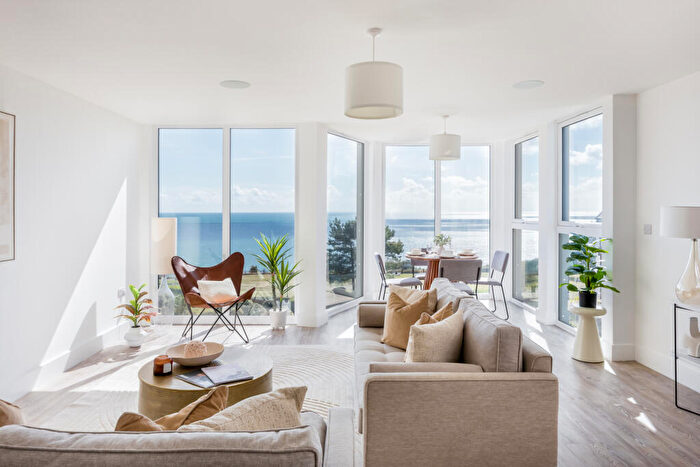
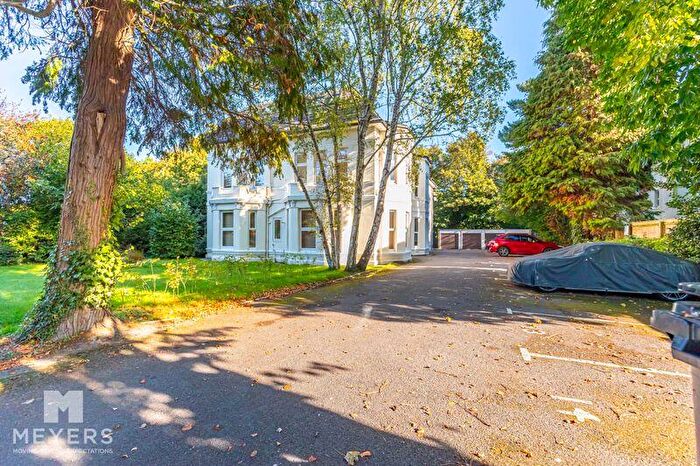
![]()
If you are looking to sell your house, let it out, or receive a property valuation, an expert can help you.
Click the button below to get started.


Roads and Postcodes in Central
Navigate through our locations to find the location of your next house in Central, Bournemouth for sale or to rent.
Transport near Central

- FAQ
- Price Paid By Year
- Property Type Price
Frequently asked questions about Central
What is the average price for a property for sale in Central?
The average price for a property for sale in Central is £234,407. This amount is 31% lower than the average price in Bournemouth. There are 3,057 property listings for sale in Central.
What streets have the most expensive properties for sale in Central?
The streets with the most expensive properties for sale in Central are St Pauls Road at an average of £1,100,000, East Overcliff Drive at an average of £1,092,142 and Fir Vale Road at an average of £1,000,000.
What streets have the most affordable properties for sale in Central?
The streets with the most affordable properties for sale in Central are Commercial Road at an average of £83,666, Lansdowne Gardens at an average of £98,250 and Granville Place at an average of £104,000.
Which train stations are available in or near Central?
Some of the train stations available in or near Central are Bournemouth, Branksome and Pokesdown.
Property Price Paid in Central by Year
The average sold property price by year was:
| Year | Average Sold Price | Price Change |
Sold Properties
|
|---|---|---|---|
| 2025 | £215,920 | -14% |
86 Properties |
| 2024 | £245,678 | -2% |
152 Properties |
| 2023 | £250,191 | 11% |
241 Properties |
| 2022 | £222,322 | -7% |
325 Properties |
| 2021 | £238,792 | 12% |
318 Properties |
| 2020 | £210,902 | -4% |
198 Properties |
| 2019 | £219,966 | 0,4% |
232 Properties |
| 2018 | £219,182 | 13% |
251 Properties |
| 2017 | £189,866 | -6% |
338 Properties |
| 2016 | £201,119 | 5% |
337 Properties |
| 2015 | £190,930 | 4% |
329 Properties |
| 2014 | £182,645 | 8% |
295 Properties |
| 2013 | £167,637 | -12% |
254 Properties |
| 2012 | £187,125 | 4% |
165 Properties |
| 2011 | £180,167 | -12% |
214 Properties |
| 2010 | £201,685 | 17% |
158 Properties |
| 2009 | £167,151 | -10% |
186 Properties |
| 2008 | £183,173 | -3% |
235 Properties |
| 2007 | £188,591 | 9% |
494 Properties |
| 2006 | £172,380 | 2% |
387 Properties |
| 2005 | £169,135 | -9% |
371 Properties |
| 2004 | £185,173 | 11% |
522 Properties |
| 2003 | £165,639 | 16% |
518 Properties |
| 2002 | £138,917 | 20% |
566 Properties |
| 2001 | £111,367 | 8% |
471 Properties |
| 2000 | £102,210 | 27% |
486 Properties |
| 1999 | £74,687 | 1% |
462 Properties |
| 1998 | £73,997 | 14% |
422 Properties |
| 1997 | £63,442 | 16% |
385 Properties |
| 1996 | £53,137 | -4% |
327 Properties |
| 1995 | £55,226 | - |
246 Properties |
Property Price per Property Type in Central
Here you can find historic sold price data in order to help with your property search.
The average Property Paid Price for specific property types in the last three years are:
| Property Type | Average Sold Price | Sold Properties |
|---|---|---|
| Flat | £220,994.00 | 773 Flats |
| Detached House | £795,076.00 | 13 Detached Houses |
| Terraced House | £408,285.00 | 14 Terraced Houses |
| Semi Detached House | £395,625.00 | 4 Semi Detached Houses |