
Houses for sale & to rent in Queens Park, Bournemouth
House Prices in Queens Park
Properties in Queens Park have an average house price of £298k and had 556 Property Transactions within the last 3 years¹.
Queens Park is an area in Bournemouth, Bournemouth with 4,914 households², where the most expensive property was sold for £1.18M.
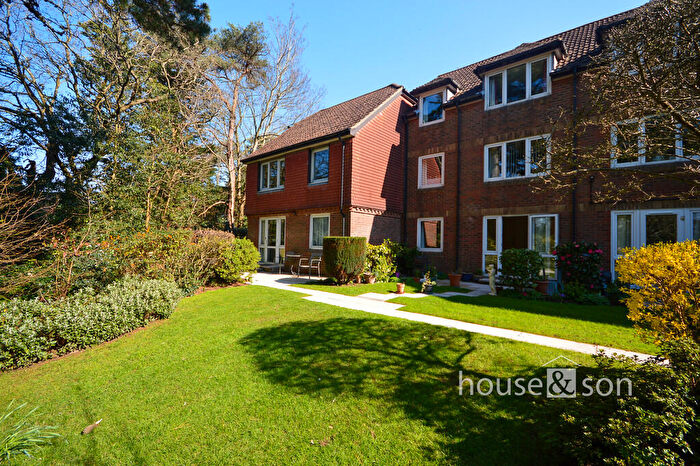
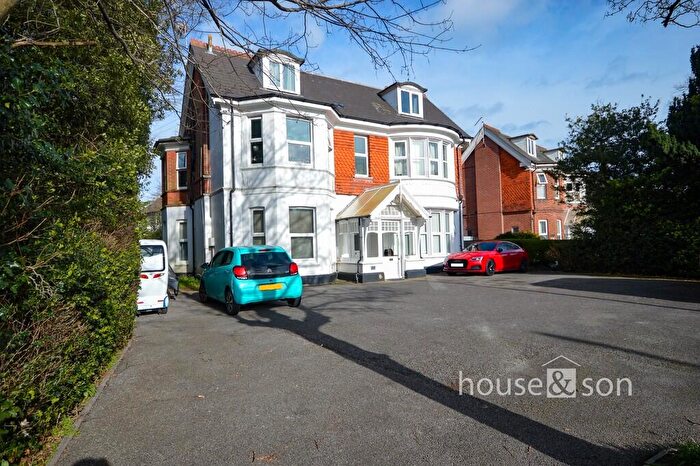
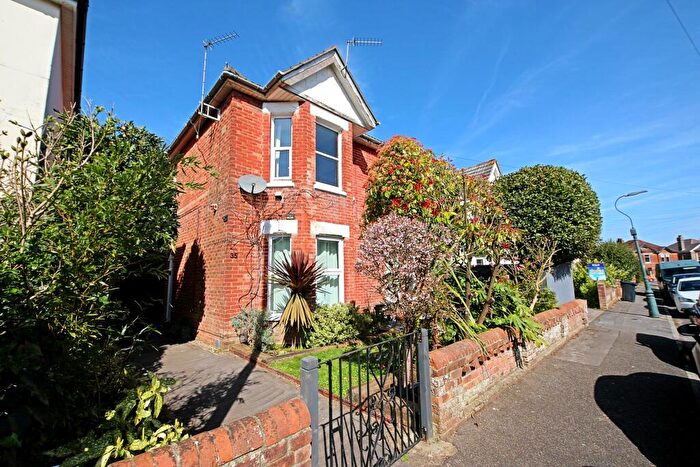
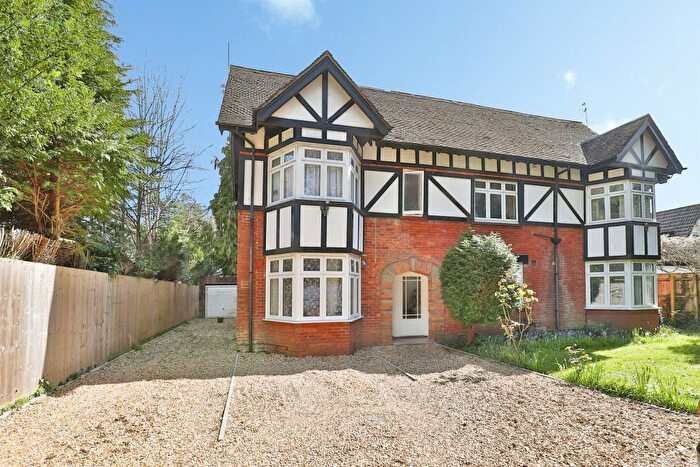
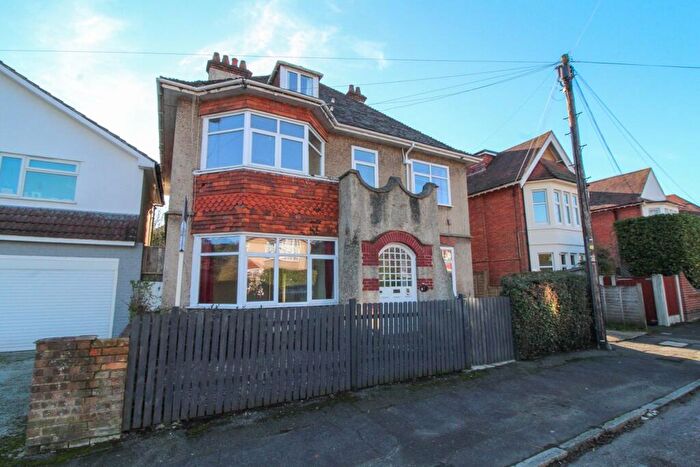
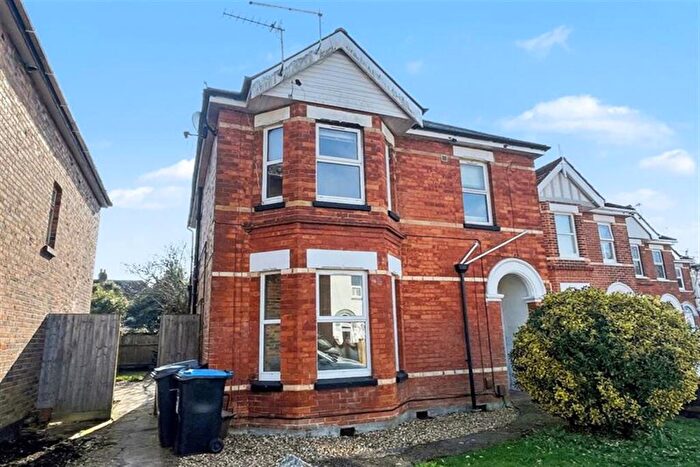
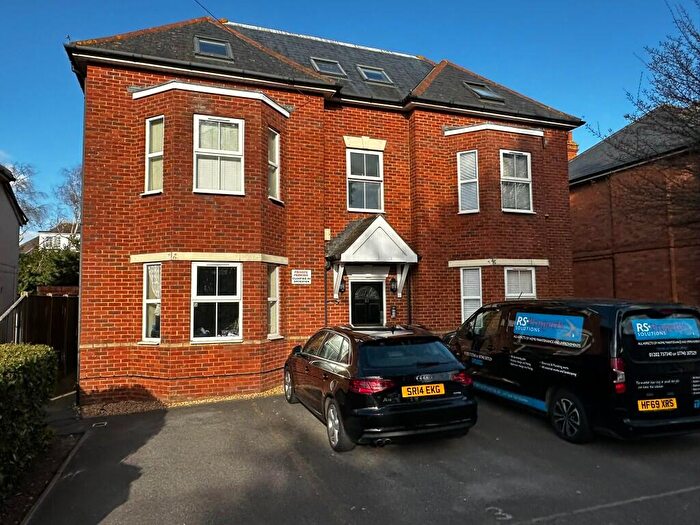
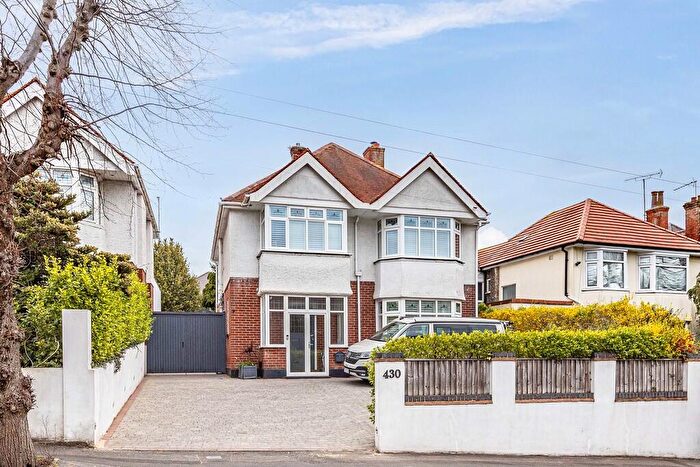
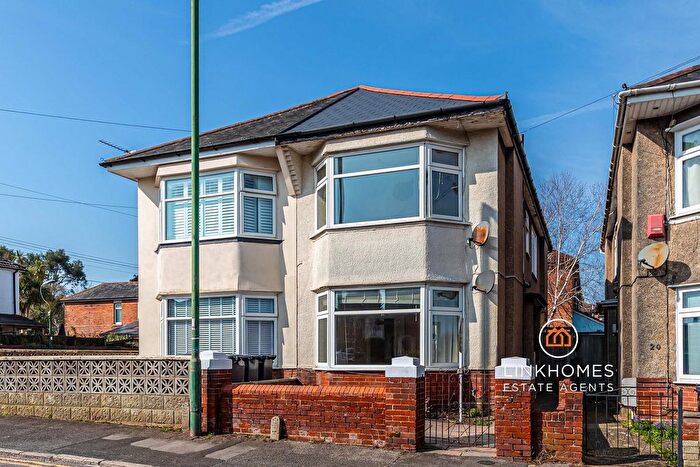
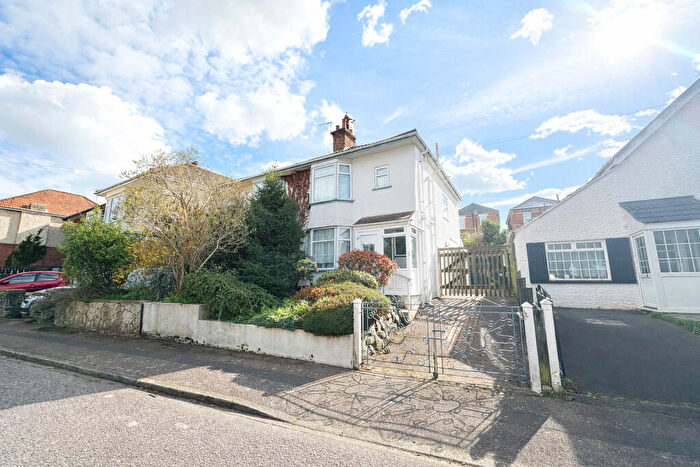
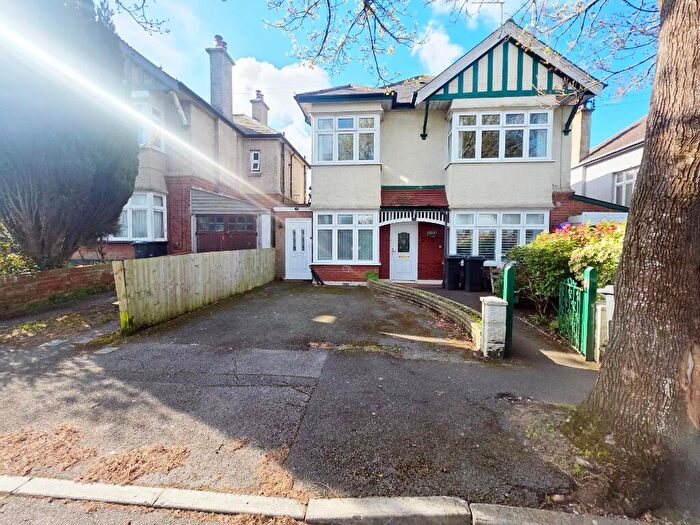
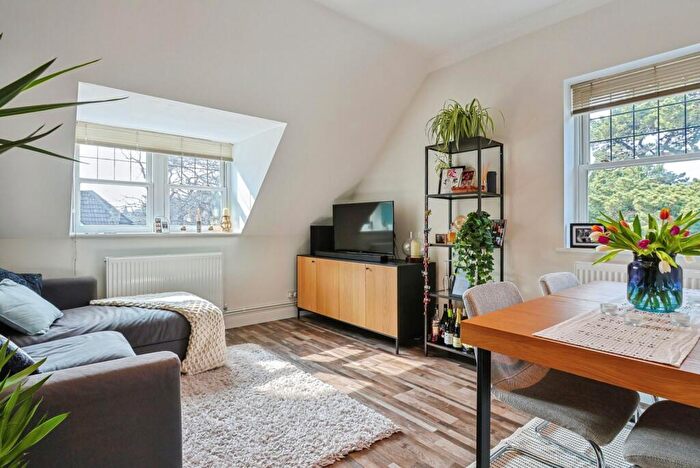
Properties for sale in Queens Park
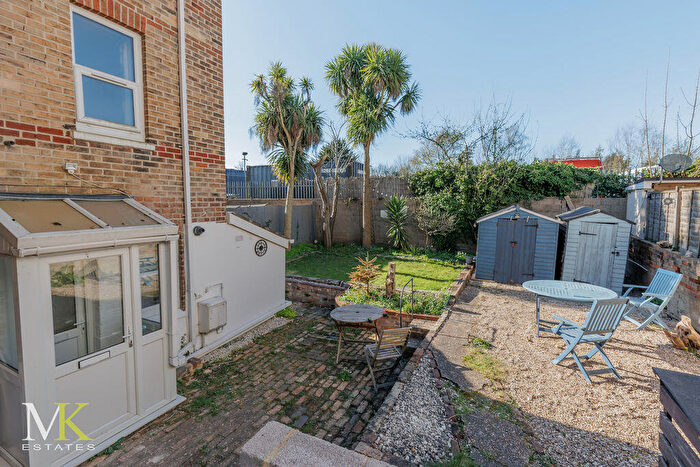
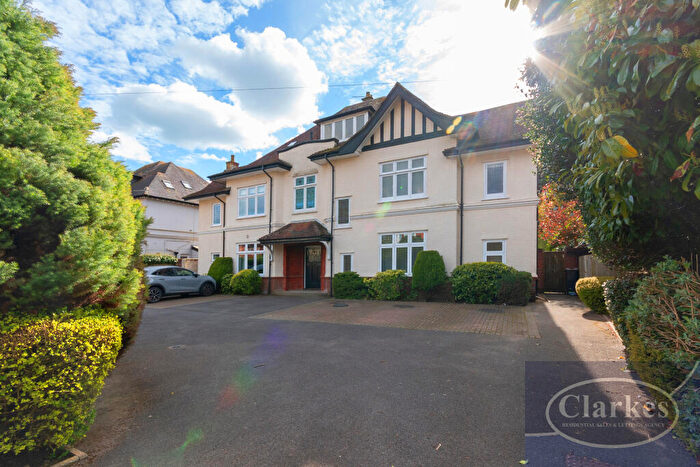
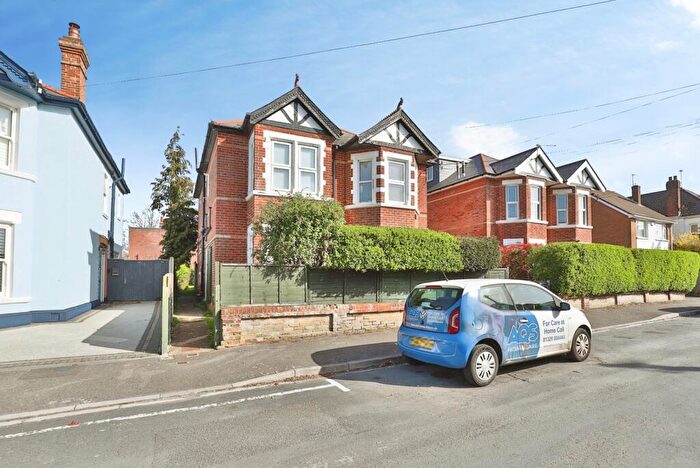
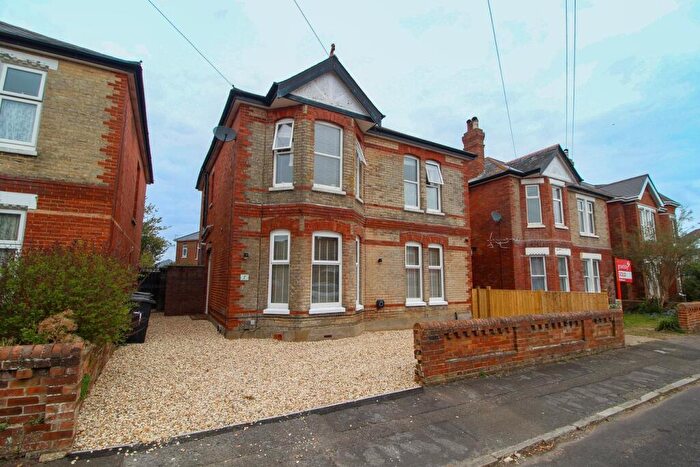
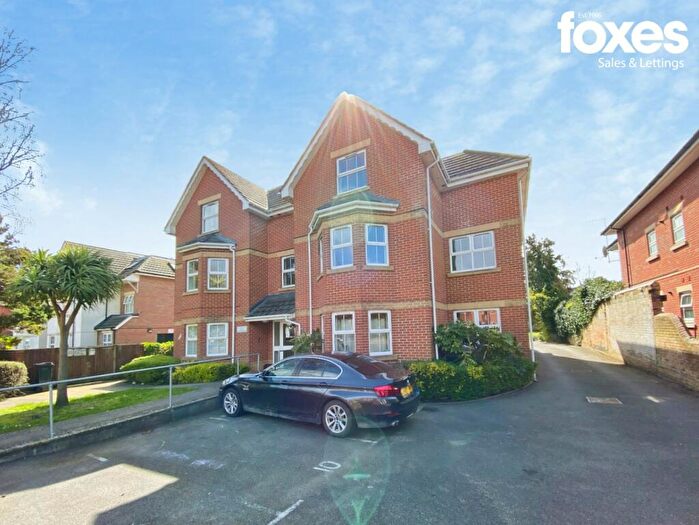
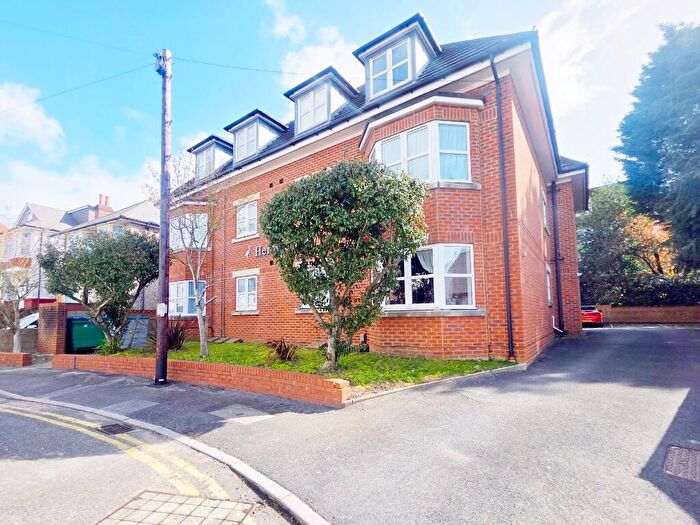
![]()
If you are looking to sell your house, let it out, or receive a property valuation, an expert can help you.
Click the button below to get started.
Roads and Postcodes in Queens Park
Navigate through our locations to find the location of your next house in Queens Park, Bournemouth for sale or to rent.
Transport near Queens Park

- FAQ
- Price Paid By Year
- Property Type Price
Frequently asked questions about Queens Park
What is the average price for a property for sale in Queens Park?
The average price for a property for sale in Queens Park is £298,370. This amount is 13% lower than the average price in Bournemouth. There are 2,834 property listings for sale in Queens Park.
What streets have the most expensive properties for sale in Queens Park?
The streets with the most expensive properties for sale in Queens Park are St Albans Avenue at an average of £833,750, St Ledgers Road at an average of £770,000 and St Georges Close at an average of £712,500.
What streets have the most affordable properties for sale in Queens Park?
The streets with the most affordable properties for sale in Queens Park are Wellington Road at an average of £188,528, Richmond Park Road at an average of £202,105 and Arcadia Avenue at an average of £205,000.
Which train stations are available in or near Queens Park?
Some of the train stations available in or near Queens Park are Bournemouth, Pokesdown and Branksome.
Property Price Paid in Queens Park by Year
The average sold property price by year was:
| Year | Average Sold Price | Price Change |
Sold Properties
|
|---|---|---|---|
| 2026 | £310,350 | 4% |
10 Properties |
| 2025 | £296,929 | 0,2% |
159 Properties |
| 2024 | £296,247 | -2% |
204 Properties |
| 2023 | £301,331 | 11% |
183 Properties |
| 2022 | £269,321 | -6% |
209 Properties |
| 2021 | £286,435 | -3% |
304 Properties |
| 2020 | £295,320 | 13% |
201 Properties |
| 2019 | £257,793 | 1% |
251 Properties |
| 2018 | £255,887 | 1% |
237 Properties |
| 2017 | £252,628.92 | 6% |
274 Properties |
| 2016 | £237,103 | 2% |
304 Properties |
| 2015 | £232,013 | 6% |
260 Properties |
| 2014 | £218,506.95 | 5% |
291 Properties |
| 2013 | £207,388 | 1% |
207 Properties |
| 2012 | £206,129 | -1% |
154 Properties |
| 2011 | £208,032 | 1% |
150 Properties |
| 2010 | £206,654 | 11% |
136 Properties |
| 2009 | £183,330 | -1% |
225 Properties |
| 2008 | £184,500 | -20% |
234 Properties |
| 2007 | £221,229 | 9% |
438 Properties |
| 2006 | £201,762 | 4% |
448 Properties |
| 2005 | £193,748 | 2% |
357 Properties |
| 2004 | £189,596.45 | 12% |
423 Properties |
| 2003 | £167,740 | 15% |
442 Properties |
| 2002 | £142,952 | 20% |
434 Properties |
| 2001 | £114,697 | 12% |
428 Properties |
| 2000 | £100,360 | 17% |
378 Properties |
| 1999 | £83,374 | 13% |
395 Properties |
| 1998 | £72,313 | 8% |
369 Properties |
| 1997 | £66,696 | 11% |
329 Properties |
| 1996 | £59,311 | 3% |
298 Properties |
| 1995 | £57,568 | - |
217 Properties |
Property Price per Property Type in Queens Park
Here you can find historic sold price data in order to help with your property search.
The average Property Paid Price for specific property types in the last three years are:
| Property Type | Average Sold Price | Sold Properties |
|---|---|---|
| Flat | £195,842.00 | 324 Flats |
| Semi Detached House | £329,266.00 | 92 Semi Detached Houses |
| Detached House | £545,769.00 | 122 Detached Houses |
| Terraced House | £309,111.00 | 18 Terraced Houses |