
Houses for sale & to rent in Westbourne And West Cliff, Bournemouth
House Prices in Westbourne And West Cliff
Properties in Westbourne And West Cliff have an average house price of £307k and had 708 Property Transactions within the last 3 years¹.
Westbourne And West Cliff is an area in Bournemouth, Bournemouth with 5,732 households², where the most expensive property was sold for £1.94M.
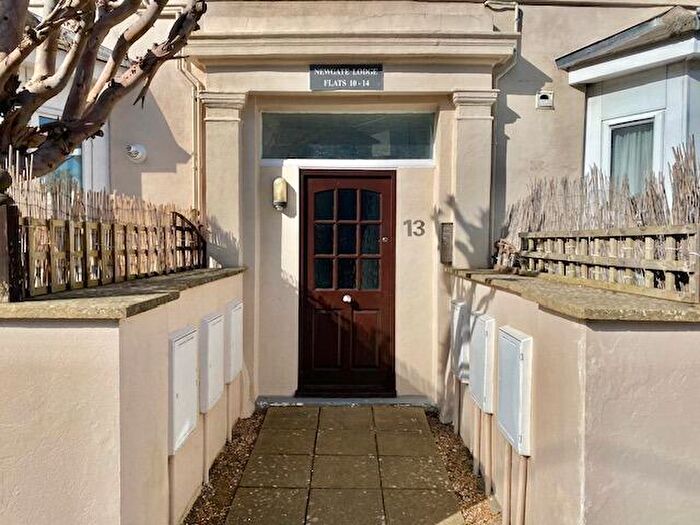
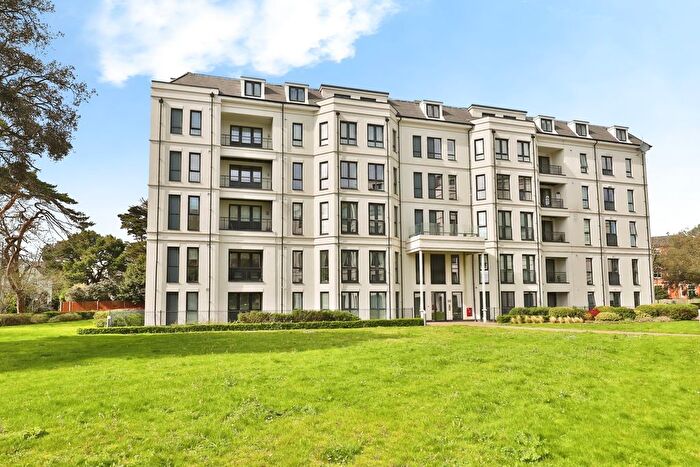
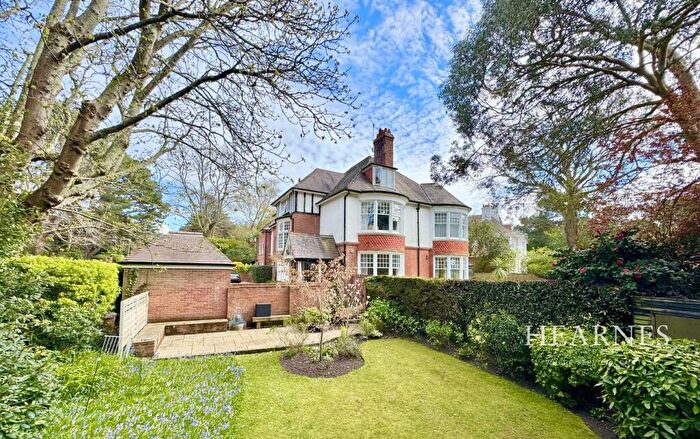
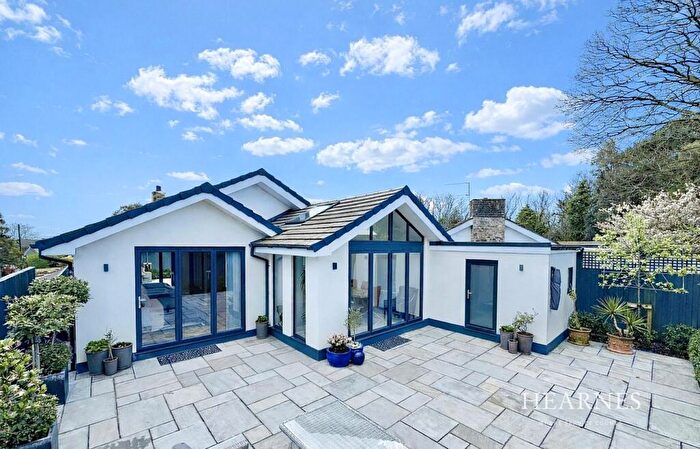
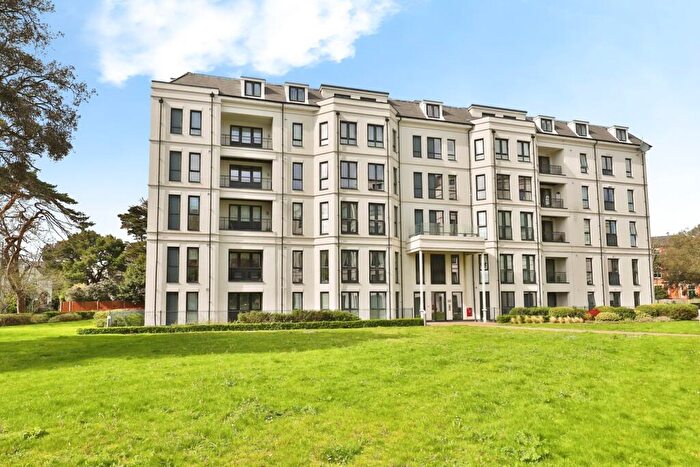
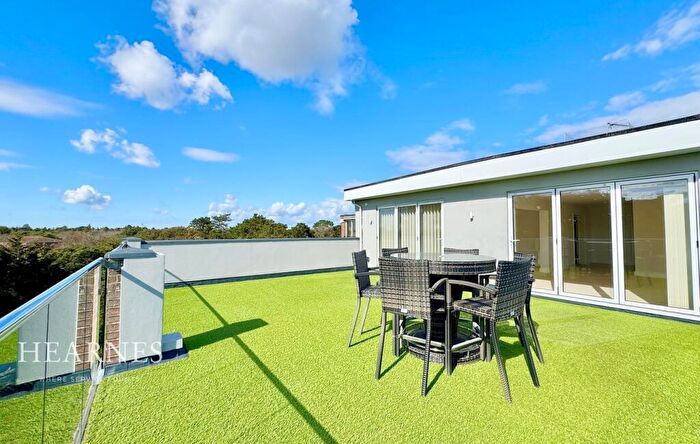
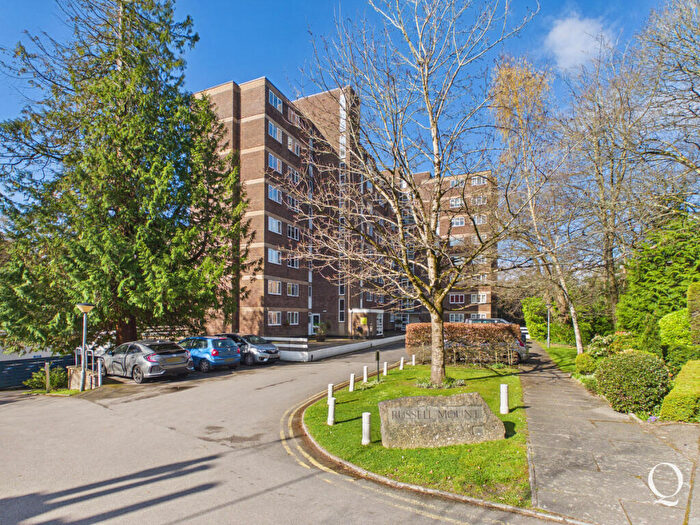
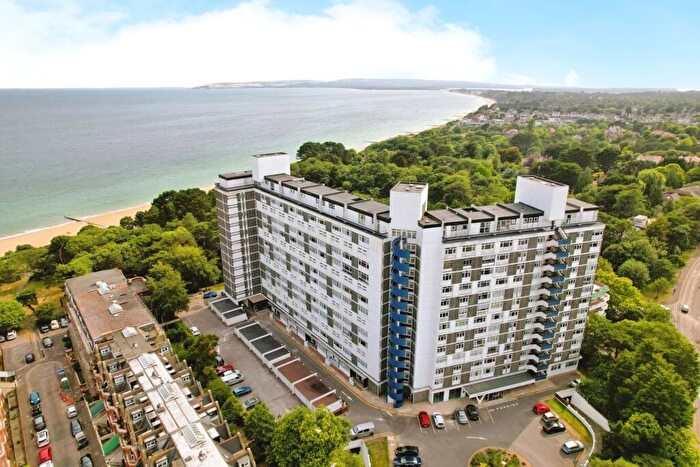
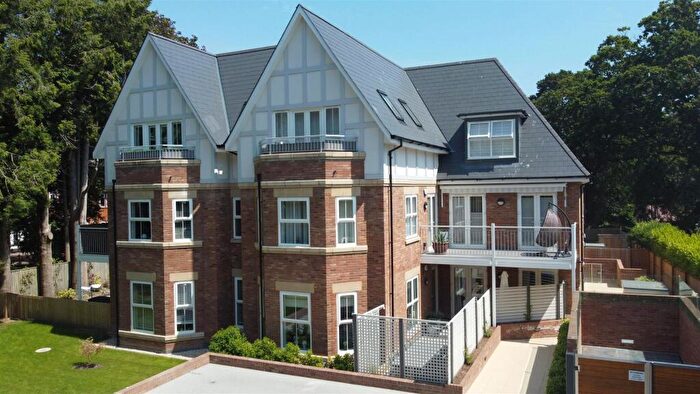
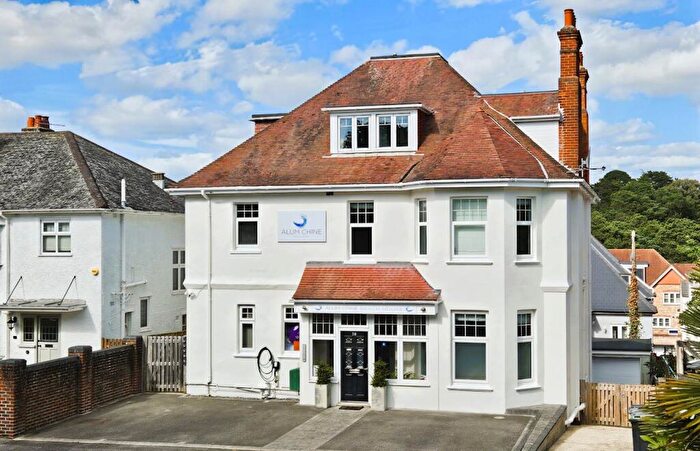
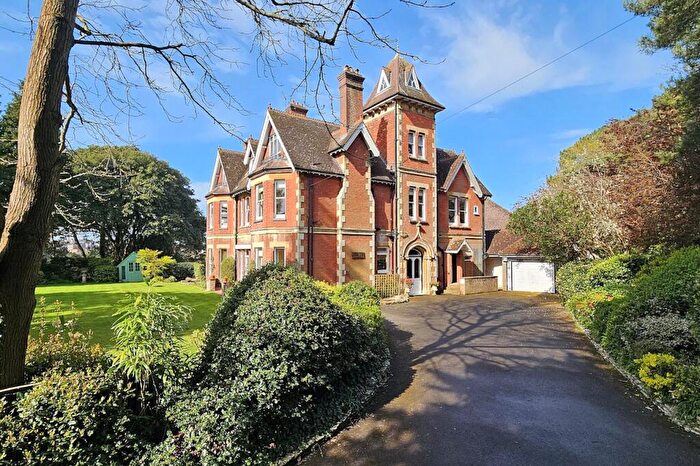
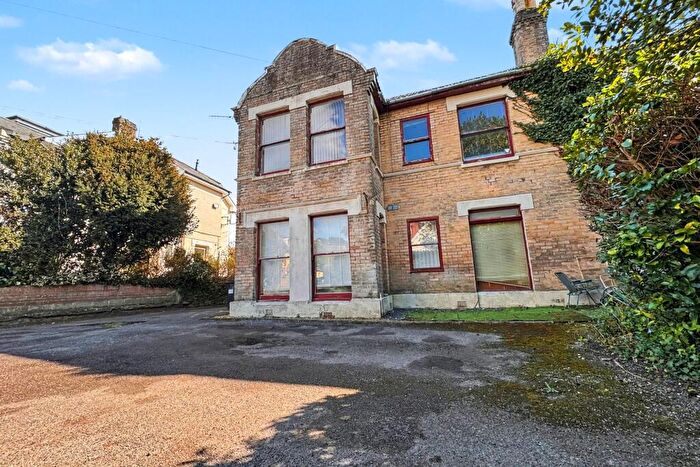
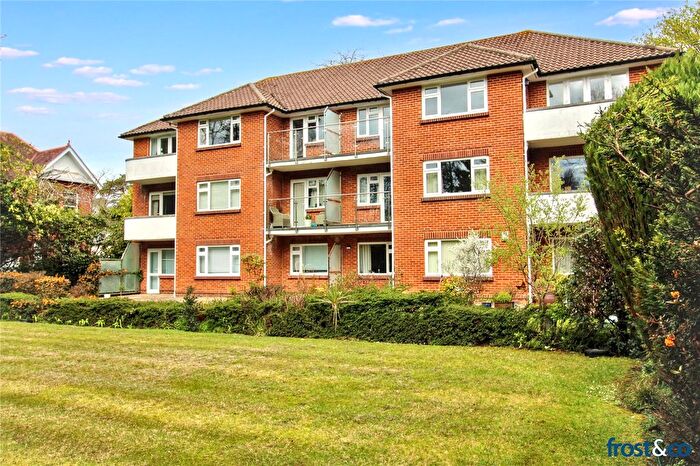
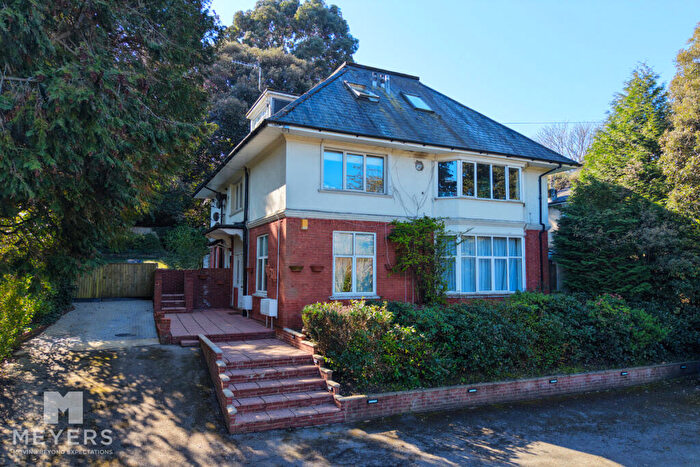
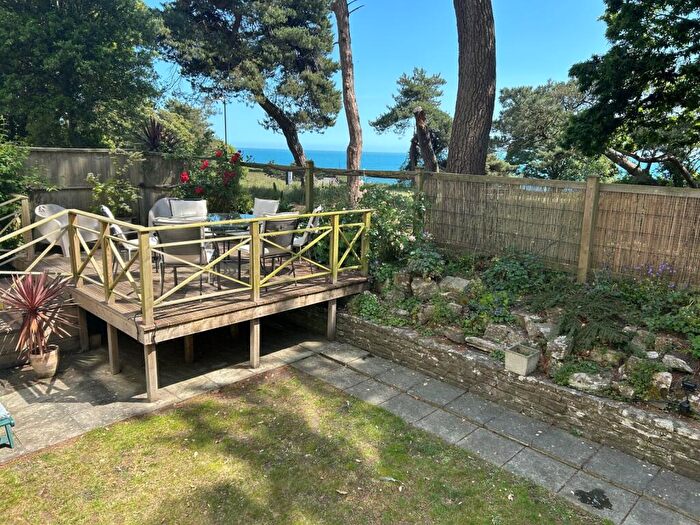
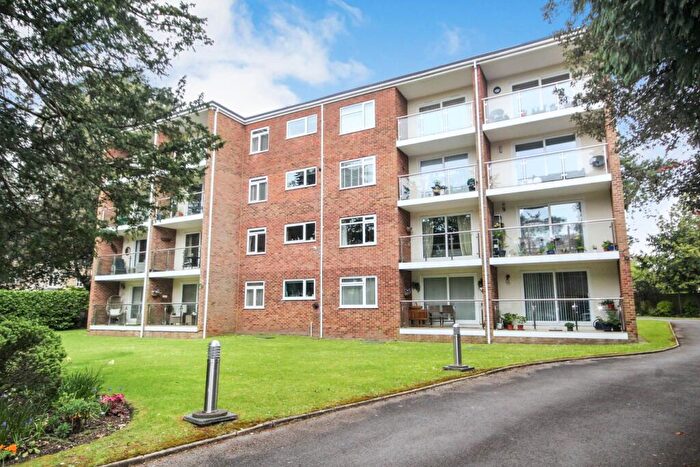
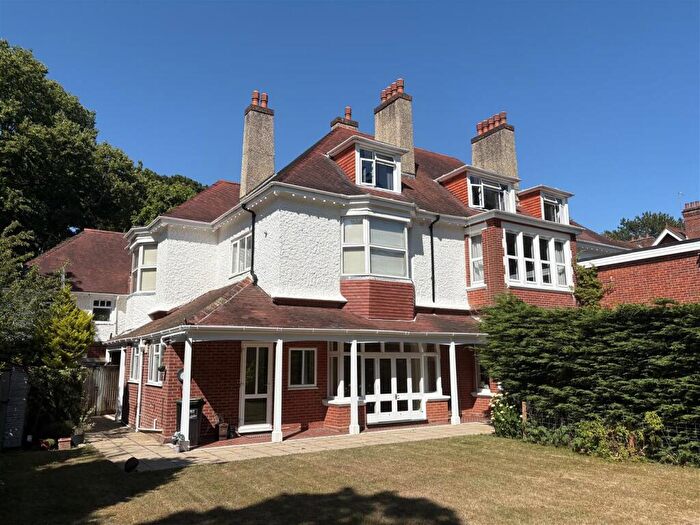
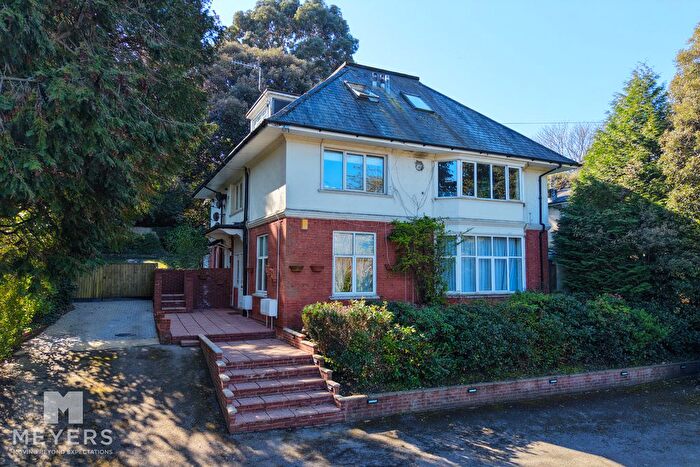
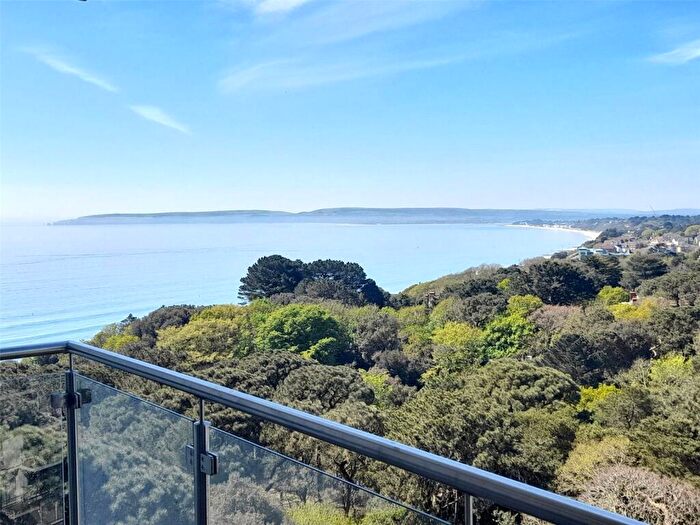
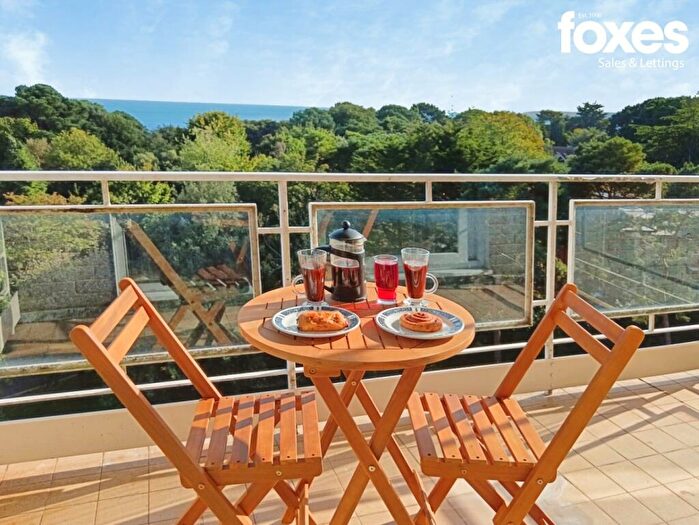
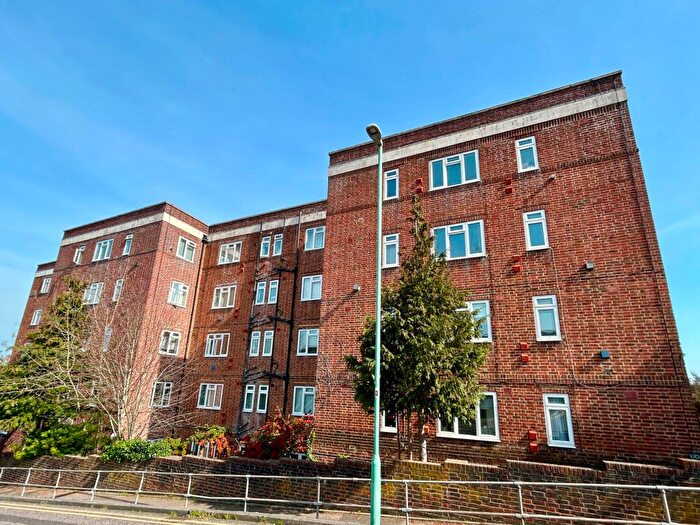
Properties for sale in Westbourne And West Cliff
![]()
If you are looking to sell your house, let it out, or receive a property valuation, an expert can help you.
Click the button below to get started.
Roads and Postcodes in Westbourne And West Cliff
Navigate through our locations to find the location of your next house in Westbourne And West Cliff, Bournemouth for sale or to rent.
Transport near Westbourne And West Cliff

- FAQ
- Price Paid By Year
- Property Type Price
Frequently asked questions about Westbourne And West Cliff
What is the average price for a property for sale in Westbourne And West Cliff?
The average price for a property for sale in Westbourne And West Cliff is £307,061. This amount is 10% lower than the average price in Bournemouth. There are 3,005 property listings for sale in Westbourne And West Cliff.
What streets have the most expensive properties for sale in Westbourne And West Cliff?
The streets with the most expensive properties for sale in Westbourne And West Cliff are Cassel Avenue at an average of £1,305,000, Branksome Dene Road at an average of £1,190,000 and Rosemount Road at an average of £908,500.
What streets have the most affordable properties for sale in Westbourne And West Cliff?
The streets with the most affordable properties for sale in Westbourne And West Cliff are West Hill Place at an average of £81,500, Mannington Place at an average of £83,875 and Poole Hill at an average of £118,500.
Which train stations are available in or near Westbourne And West Cliff?
Some of the train stations available in or near Westbourne And West Cliff are Branksome, Bournemouth and Parkstone.
Property Price Paid in Westbourne And West Cliff by Year
The average sold property price by year was:
| Year | Average Sold Price | Price Change |
Sold Properties
|
|---|---|---|---|
| 2026 | £180,600 | -54% |
5 Properties |
| 2025 | £277,829 | -11% |
183 Properties |
| 2024 | £309,708 | -6% |
256 Properties |
| 2023 | £327,152 | 14% |
264 Properties |
| 2022 | £280,742 | - |
360 Properties |
| 2021 | £280,771 | 0,4% |
463 Properties |
| 2020 | £279,510 | 7% |
296 Properties |
| 2019 | £258,879 | 9% |
302 Properties |
| 2018 | £236,023 | -4% |
362 Properties |
| 2017 | £244,730 | 4% |
295 Properties |
| 2016 | £234,656 | 4% |
377 Properties |
| 2015 | £224,651 | 3% |
377 Properties |
| 2014 | £217,585 | 6% |
372 Properties |
| 2013 | £204,064 | -2% |
332 Properties |
| 2012 | £207,242 | -6% |
259 Properties |
| 2011 | £219,486 | -4% |
279 Properties |
| 2010 | £229,326 | 12% |
282 Properties |
| 2009 | £202,500 | - |
281 Properties |
| 2008 | £202,567 | -11% |
283 Properties |
| 2007 | £224,183 | 6% |
537 Properties |
| 2006 | £210,363 | 6% |
557 Properties |
| 2005 | £197,510 | -2% |
468 Properties |
| 2004 | £200,915 | 14% |
607 Properties |
| 2003 | £172,494 | 10% |
577 Properties |
| 2002 | £155,583 | 22% |
696 Properties |
| 2001 | £120,739 | 14% |
541 Properties |
| 2000 | £104,434 | 6% |
508 Properties |
| 1999 | £97,725 | 19% |
569 Properties |
| 1998 | £79,267 | 5% |
476 Properties |
| 1997 | £75,649 | 12% |
536 Properties |
| 1996 | £66,945 | 10% |
391 Properties |
| 1995 | £60,121 | - |
304 Properties |
Property Price per Property Type in Westbourne And West Cliff
Here you can find historic sold price data in order to help with your property search.
The average Property Paid Price for specific property types in the last three years are:
| Property Type | Average Sold Price | Sold Properties |
|---|---|---|
| Flat | £245,748.00 | 628 Flats |
| Semi Detached House | £576,333.00 | 9 Semi Detached Houses |
| Detached House | £946,856.00 | 46 Detached Houses |
| Terraced House | £573,084.00 | 25 Terraced Houses |