
Houses for sale & to rent in Sandhurst, Bracknell Forest
House Prices in Sandhurst
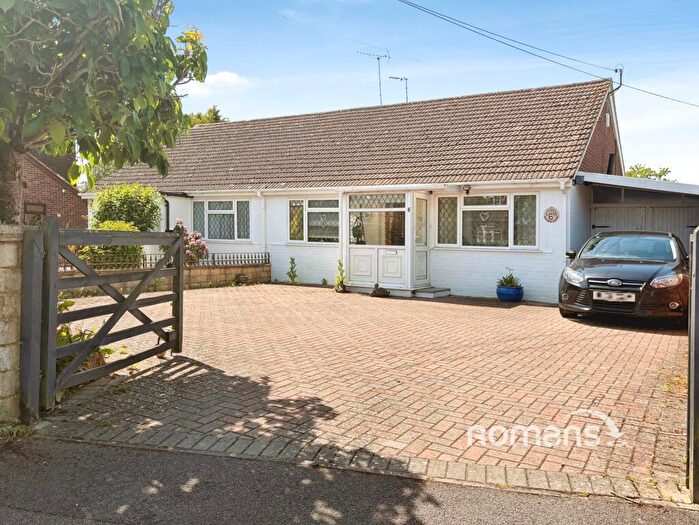
Properties in Sandhurst have an average house price of £439k and had 760 Property Transactions within the last 3 years.¹
Sandhurst is an area in Bracknell Forest with 7,744 households², where the most expensive property was sold for £1.58M.
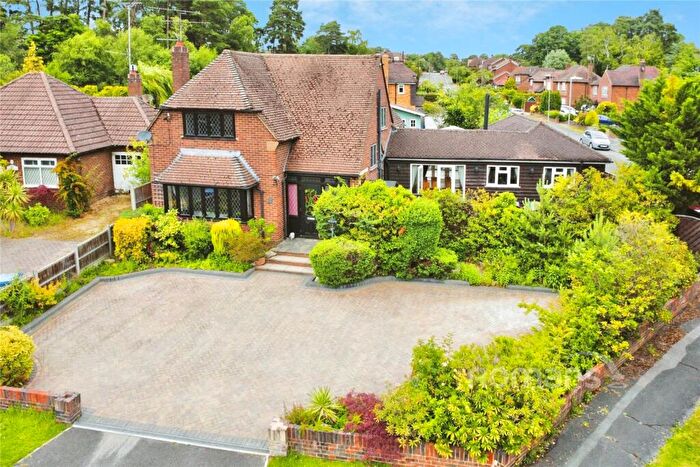
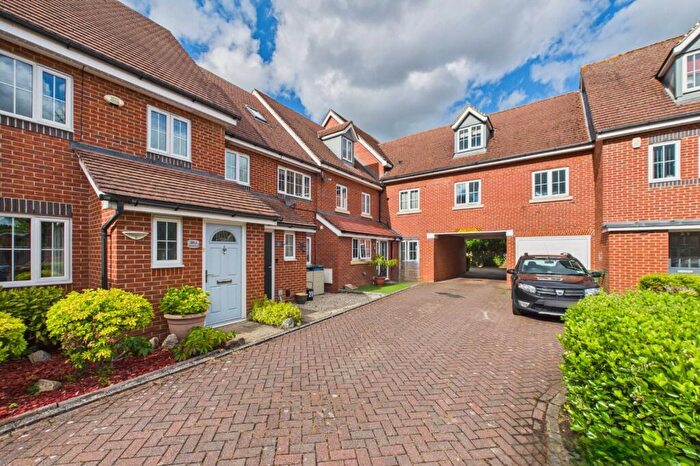
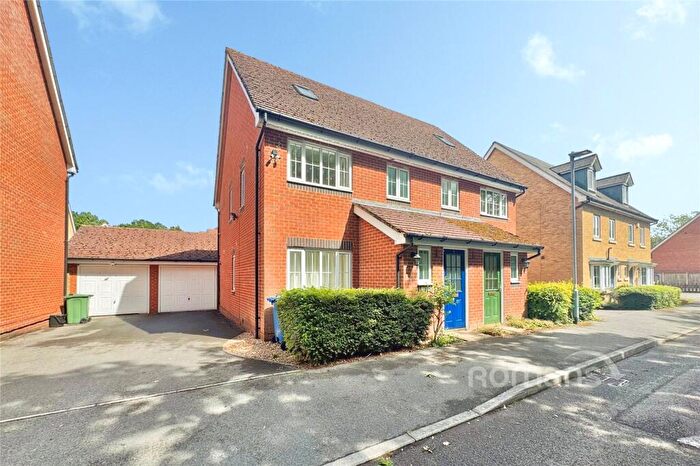
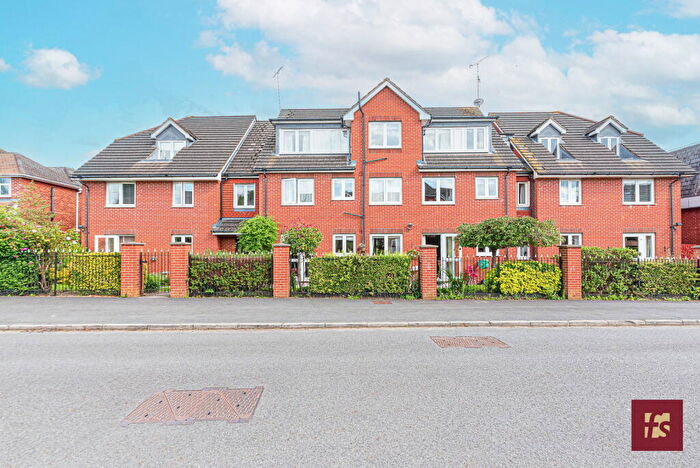
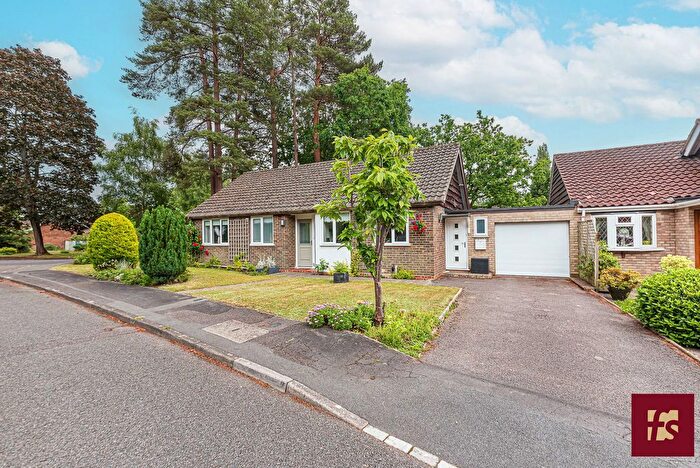
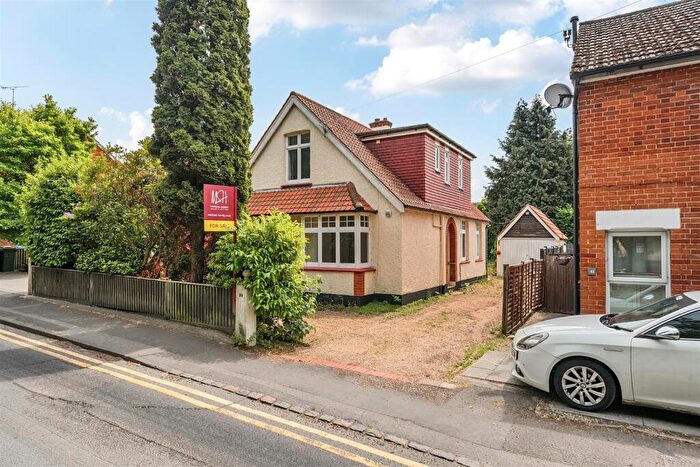
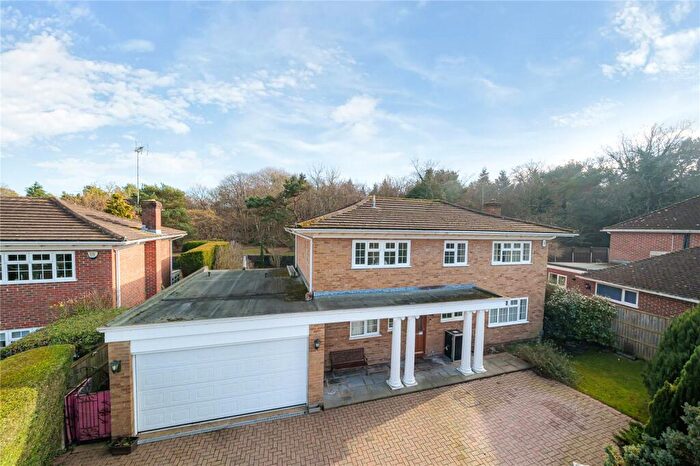
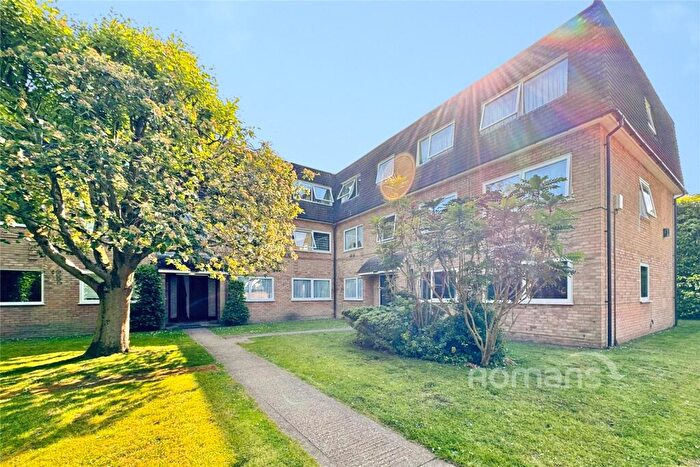
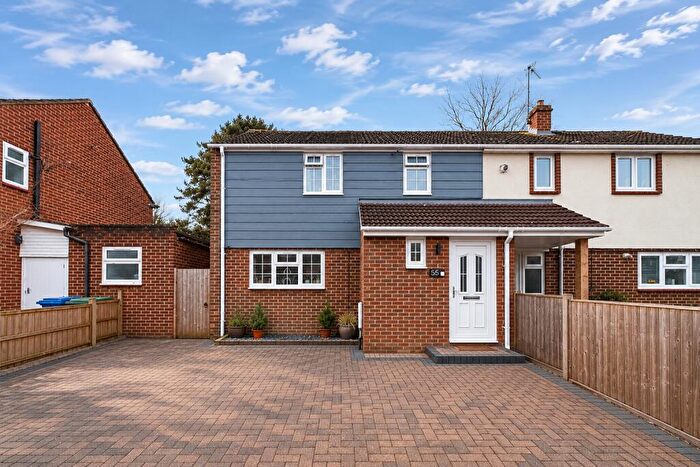
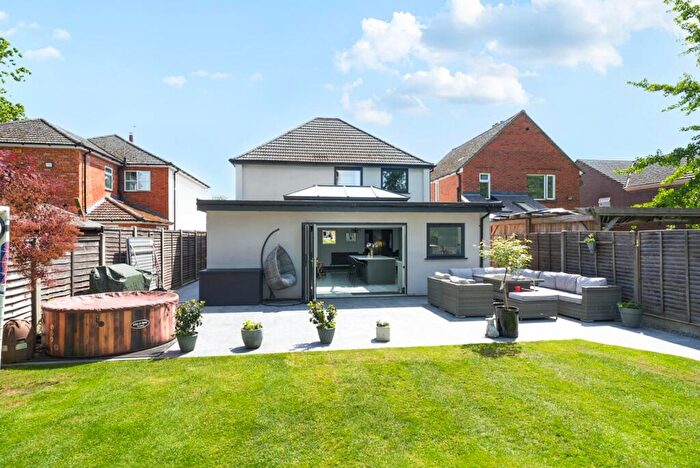
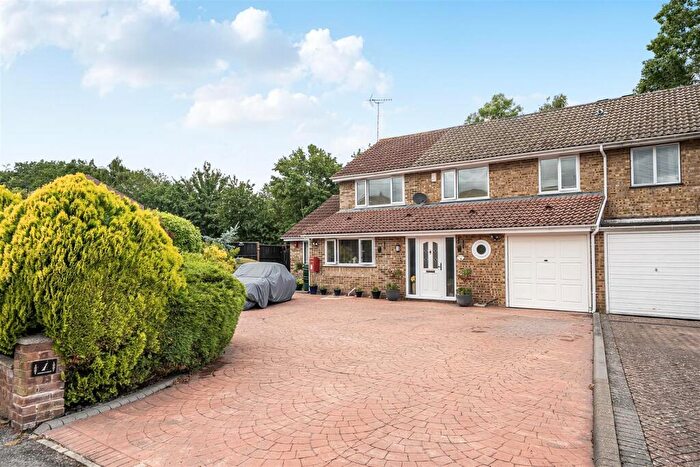
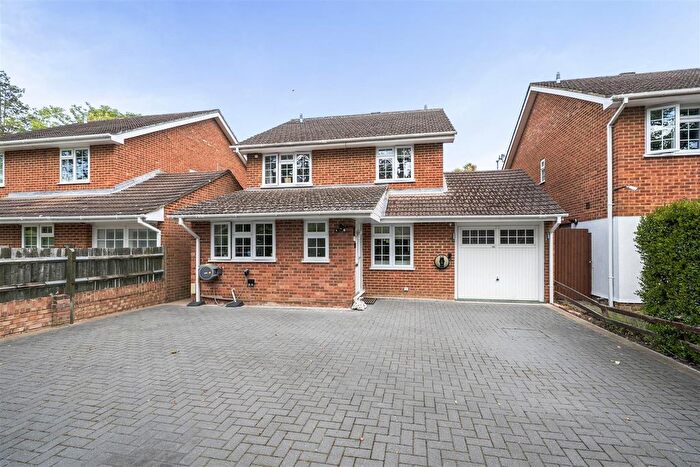
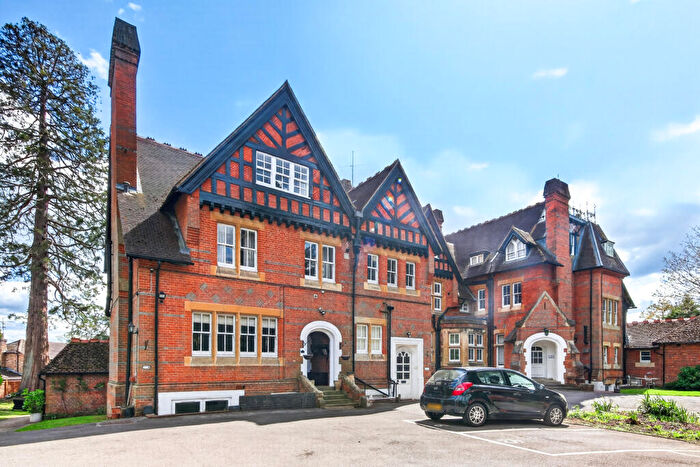
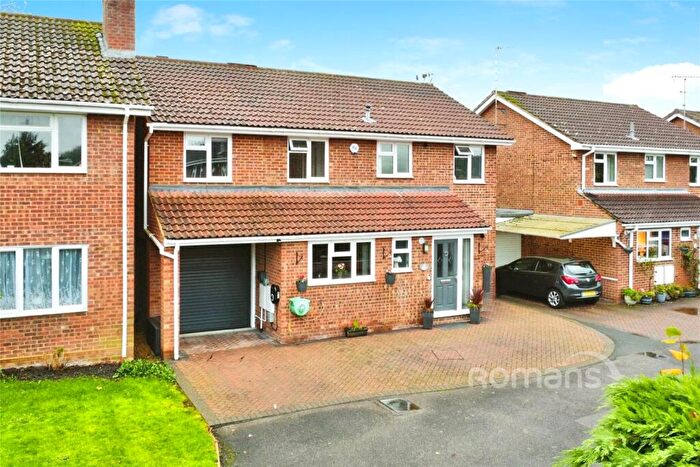
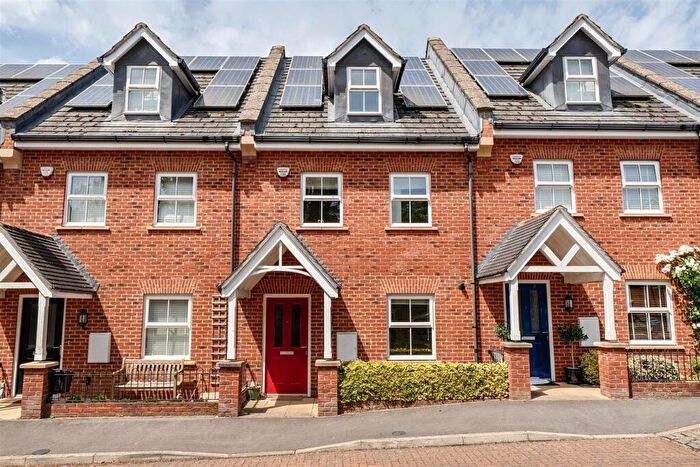
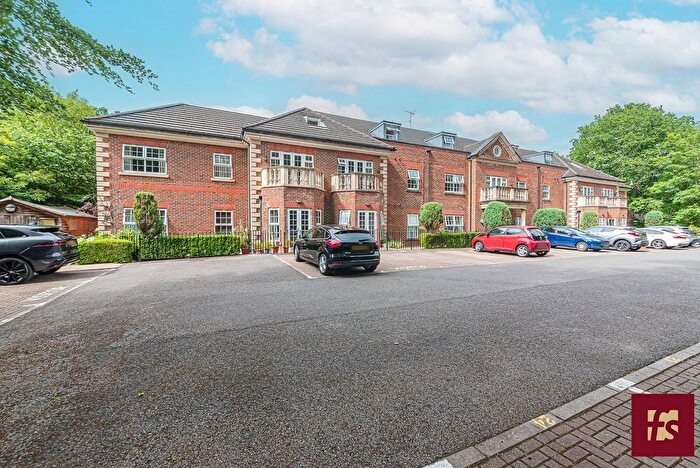
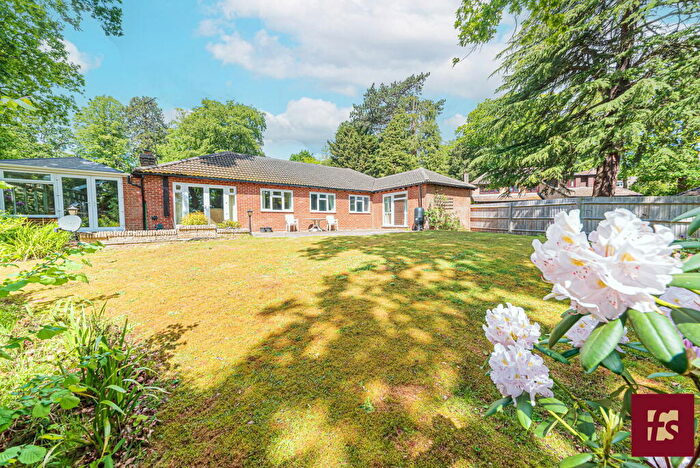
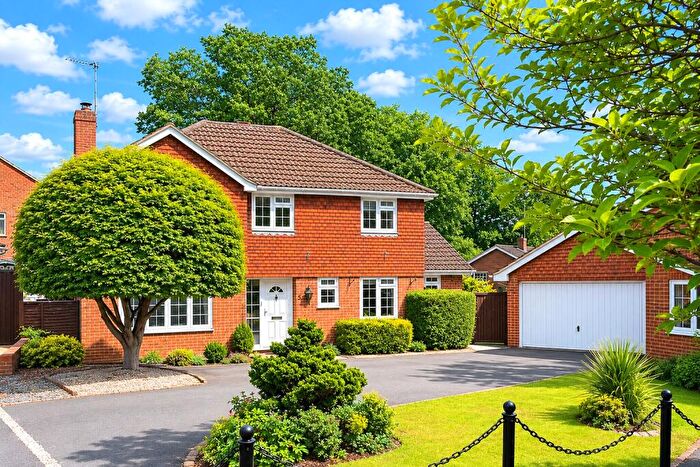
Properties for sale in Sandhurst
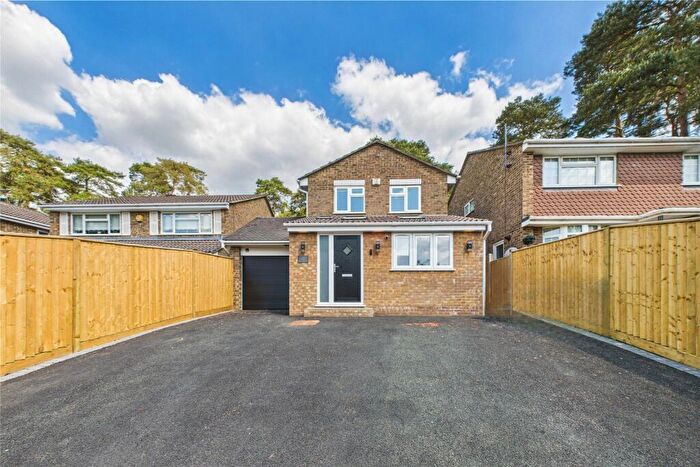

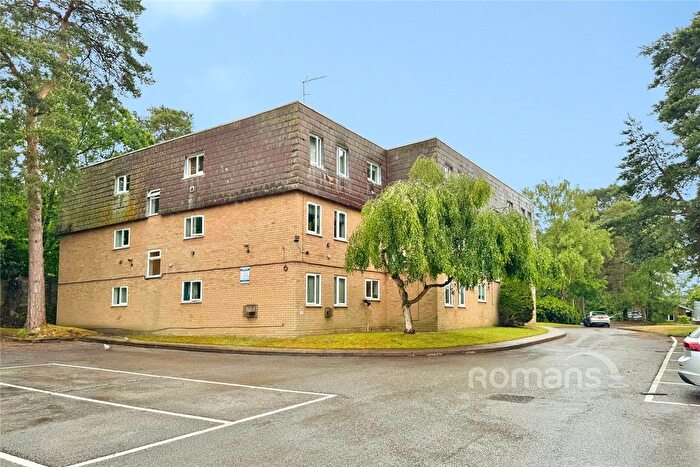
![]()
If you are looking to sell your house, let it out, or receive a property valuation, an expert can help you.
Click the button below to get started.


Neighbourhoods in Sandhurst
Navigate through our locations to find the location of your next house in Sandhurst, Bracknell Forest for sale or to rent.
Transport in Sandhurst
Please see below transportation links in this area:

- FAQ
- Price Paid By Year
- Property Type Price
Frequently asked questions about Sandhurst
What is the average price for a property for sale in Sandhurst?
The average price for a property for sale in Sandhurst is £438,535. This amount is 0.2% higher than the average price in Bracknell Forest. There are 4,609 property listings for sale in Sandhurst.
What locations have the most expensive properties for sale in Sandhurst?
The locations with the most expensive properties for sale in Sandhurst are Little Sandhurst And Wellington at an average of £491,188 and Central Sandhurst at an average of £438,278.
What locations have the most affordable properties for sale in Sandhurst?
The locations with the most affordable properties for sale in Sandhurst are College Town at an average of £410,441 and Owlsmoor at an average of £421,775.
Which train stations are available in or near Sandhurst?
Some of the train stations available in or near Sandhurst are Sandhurst, Blackwater and Crowthorne.
Property Price Paid in Sandhurst by Year
The average sold property price by year was:
| Year | Average Sold Price | Price Change |
Sold Properties
|
|---|---|---|---|
| 2026 | £443,530 | -5% |
30 Properties |
| 2025 | £466,329 | 6% |
235 Properties |
| 2024 | £437,959 | 6% |
243 Properties |
| 2023 | £412,575 | -5% |
252 Properties |
| 2022 | £435,256 | 0,3% |
302 Properties |
| 2021 | £433,982 | 7% |
411 Properties |
| 2020 | £402,692 | 5% |
288 Properties |
| 2019 | £380,750 | -2% |
340 Properties |
| 2018 | £386,553 | 2% |
293 Properties |
| 2017 | £379,016 | 3% |
332 Properties |
| 2016 | £369,030 | 11% |
344 Properties |
| 2015 | £328,146 | 8% |
384 Properties |
| 2014 | £302,977 | 8% |
393 Properties |
| 2013 | £277,918 | 4% |
344 Properties |
| 2012 | £267,075 | 3% |
327 Properties |
| 2011 | £260,175 | -1% |
251 Properties |
| 2010 | £263,490 | 12% |
289 Properties |
| 2009 | £232,642 | -12% |
224 Properties |
| 2008 | £260,261 | 0,1% |
255 Properties |
| 2007 | £259,904 | 7% |
554 Properties |
| 2006 | £241,902 | 10% |
515 Properties |
| 2005 | £218,374 | 0,3% |
487 Properties |
| 2004 | £217,632 | 6% |
585 Properties |
| 2003 | £203,975 | 10% |
525 Properties |
| 2002 | £183,985 | 11% |
608 Properties |
| 2001 | £164,592 | 12% |
623 Properties |
| 2000 | £144,213 | 15% |
583 Properties |
| 1999 | £123,014 | 10% |
685 Properties |
| 1998 | £111,158 | 12% |
427 Properties |
| 1997 | £98,021 | 11% |
634 Properties |
| 1996 | £87,651 | 4% |
525 Properties |
| 1995 | £84,413 | - |
395 Properties |
Property Price per Property Type in Sandhurst
Here you can find historic sold price data in order to help with your property search.
The average Property Paid Price for specific property types in the last three years are:
| Property Type | Average Sold Price | Sold Properties |
|---|---|---|
| Semi Detached House | £443,631.00 | 195 Semi Detached Houses |
| Detached House | £593,137.00 | 256 Detached Houses |
| Terraced House | £353,642.00 | 200 Terraced Houses |
| Flat | £222,081.00 | 109 Flats |