
Houses for sale in Camberley, Surrey
House Prices in Camberley
Properties in Camberley have an average house price of £489k and had 2,260 Property Transactions within the last 3 years.¹
Camberley is an area in Surrey with 23,514 households², where the most expensive property was sold for £2M.
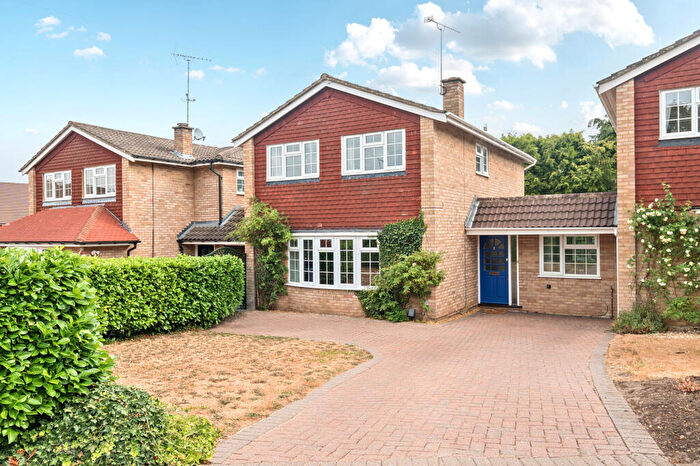
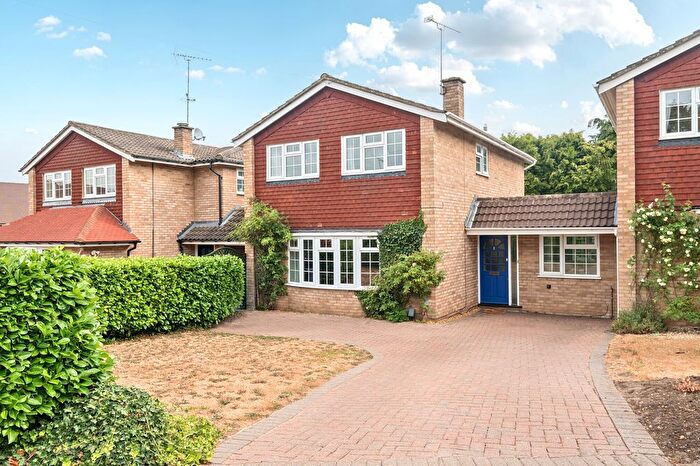
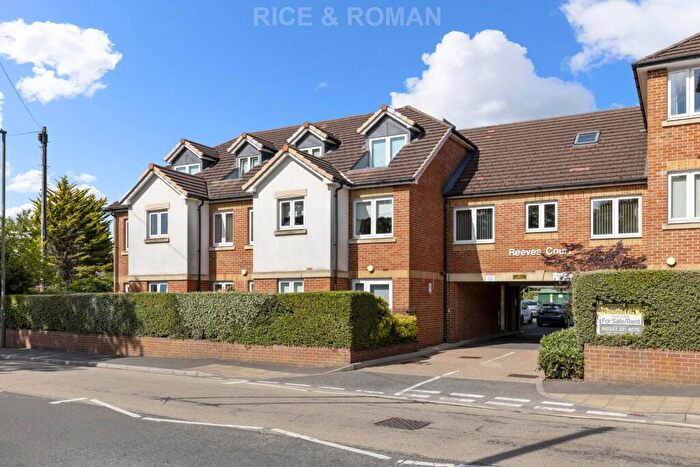
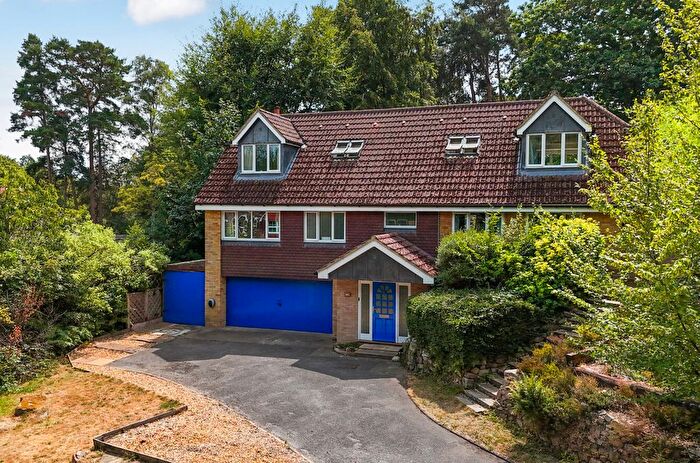
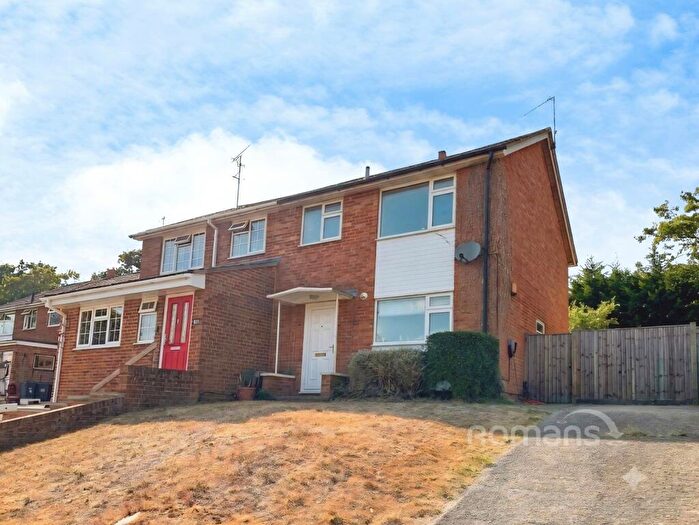
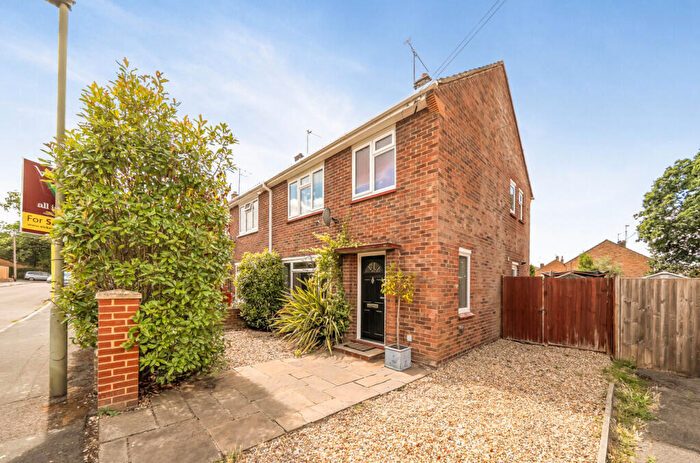
Properties for sale in Camberley
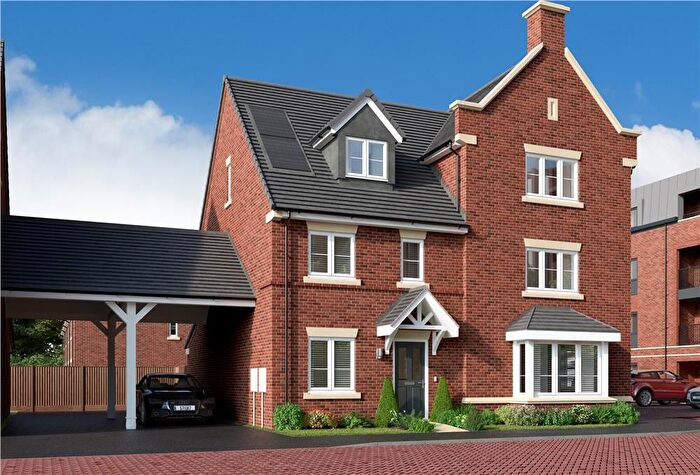
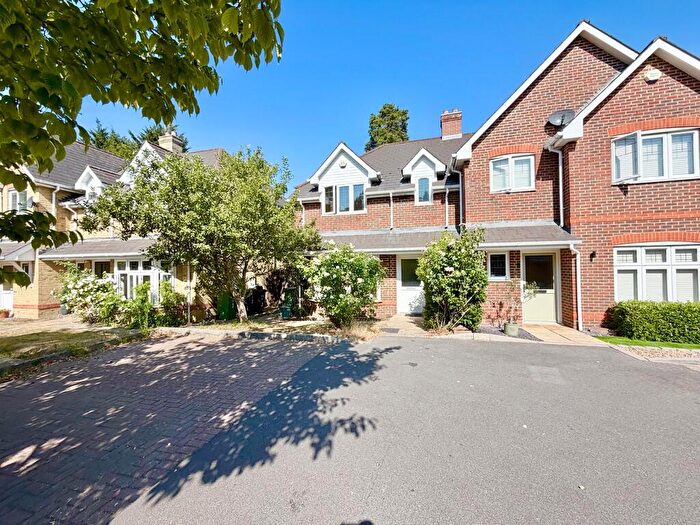

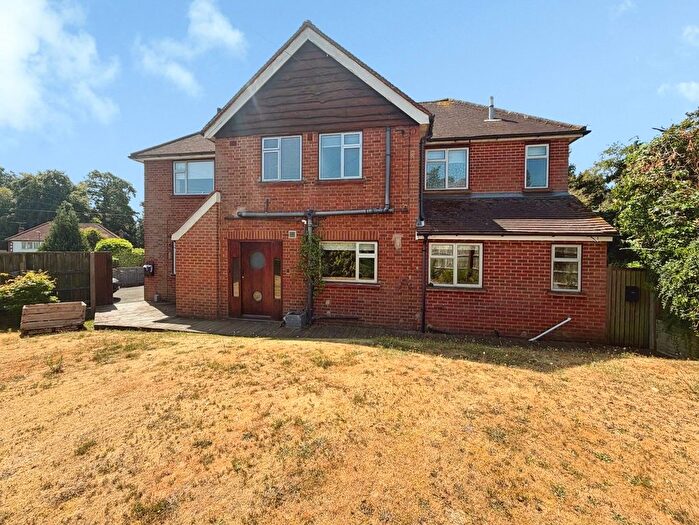
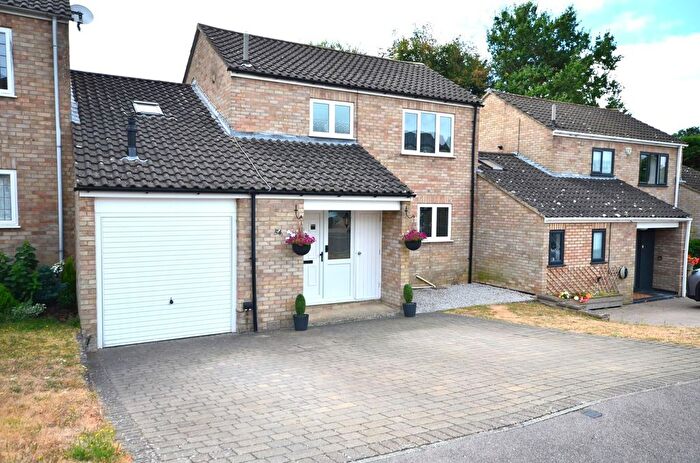
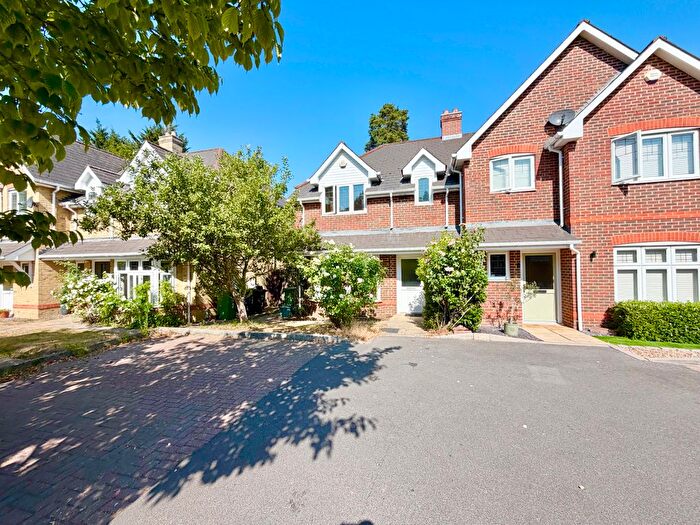
![]()
If you are looking to sell your house, let it out, or receive a property valuation, an expert can help you.
Click the button below to get started.


Neighbourhoods in Camberley
Navigate through our locations to find the location of your next house in Camberley, Surrey for sale or to rent.
Property price trends in Camberley
According to the latest Land Registry data, the average home in Camberley sold for £465,072 in 2026. That figure comes from a substantial record of 33,035 sales logged over the past 31 years.
Prices have softened over the last three years. Compared with 2023, when the typical sale came in around £485,304, that's a fall of roughly 4.2%.
Looking back five years, average prices are down about 1.4% since 2021, a drop of around £6,385 in cash terms.
Zoom out to the past decade for the fuller picture. Back in 2016, homes here averaged £399,130, so the typical sold price has climbed about 16.5% since then, roughly 1.5% a year. Stretch the view to fifteen years and that annual pace edges up closer to 2.7%.
Frequently asked questions about Camberley
What is the average price for a property for sale in Camberley?
The average price for a property for sale in Camberley is £489,154. This amount is 20% lower than the average price in Surrey. There are more than 10,000 property listings for sale in Camberley.
What locations have the most expensive properties for sale in Camberley?
The locations with the most expensive properties for sale in Camberley are St Pauls at an average of £728,899, Parkside at an average of £607,578 and Watchetts at an average of £546,881.
What locations have the most affordable properties for sale in Camberley?
The locations with the most affordable properties for sale in Camberley are St Michaels at an average of £333,712, Old Dean at an average of £374,414 and Town at an average of £411,638.
Which train stations are available in or near Camberley?
Some of the train stations available in or near Camberley are Camberley, Frimley and Farnborough North.
Property Price Paid in Camberley by Year
The average sold property price by year was:
| Year | Average Sold Price | Price Change |
Sold Properties
|
|---|---|---|---|
| 2026 | £465,072 | -6% |
52 Properties |
| 2025 | £492,062 | 0,1% |
745 Properties |
| 2024 | £491,424 | 1% |
771 Properties |
| 2023 | £485,304 | 2% |
692 Properties |
| 2022 | £474,013 | 1% |
999 Properties |
| 2021 | £471,457 | 3% |
1,200 Properties |
| 2020 | £455,289 | 6% |
724 Properties |
| 2019 | £429,507 | 5% |
887 Properties |
| 2018 | £406,457 | -6% |
903 Properties |
| 2017 | £431,063 | 7% |
1,006 Properties |
Property Price per Property Type in Camberley
Here you can find historic sold price data in order to help with your property search.
The average Property Paid Price for specific property types in the last three years are:
| Property Type | Average Sold Price | Sold Properties |
|---|---|---|
| Semi Detached House | £457,174.00 | 591 Semi Detached Houses |
| Terraced House | £378,225.00 | 338 Terraced Houses |
| Detached House | £733,028.00 | 794 Detached Houses |
| Flat | £233,583.00 | 537 Flats |
Transport in Camberley
Please see below transportation links in this area:
