
Houses for sale in Bradford, Bradford
House Prices in Bradford
Properties in Bradford have an average house price of £158k and had 11,931 Property Transactions within the last 3 years.¹
Bradford is an area in Bradford with 131,214 households², where the most expensive property was sold for £1.44M.
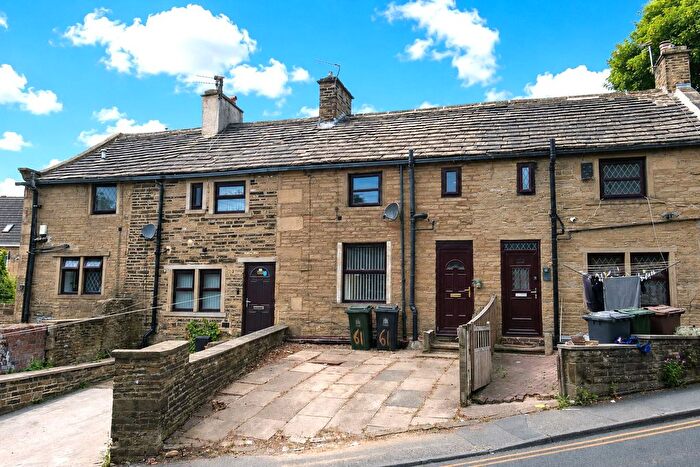
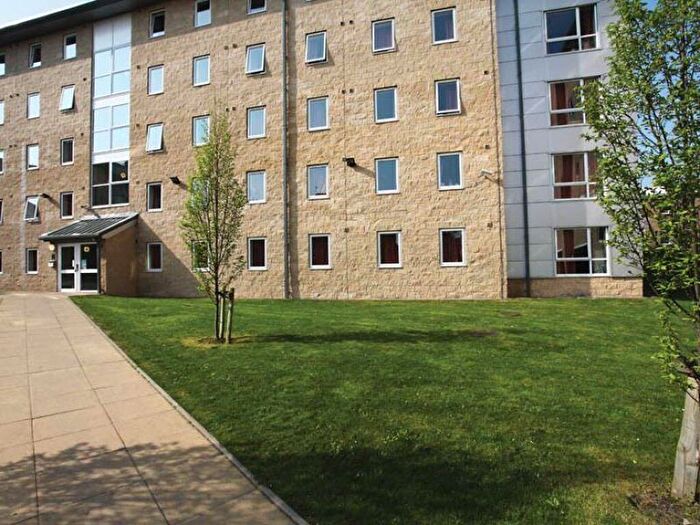
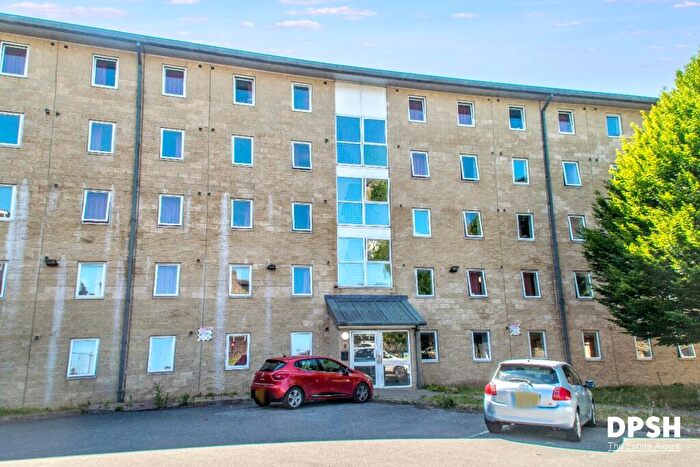
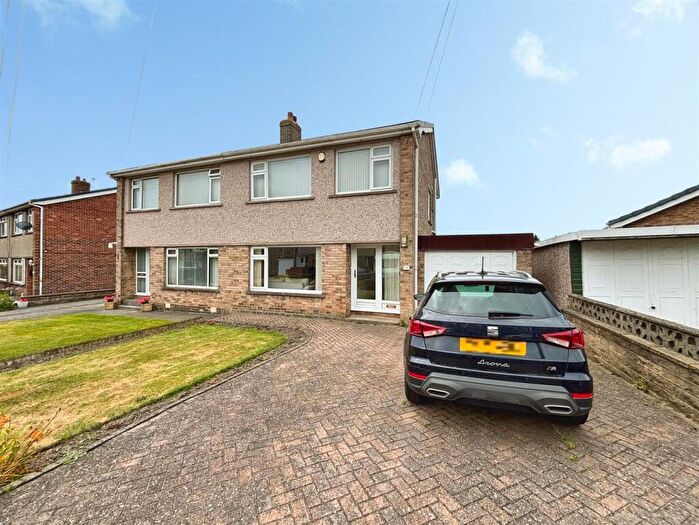
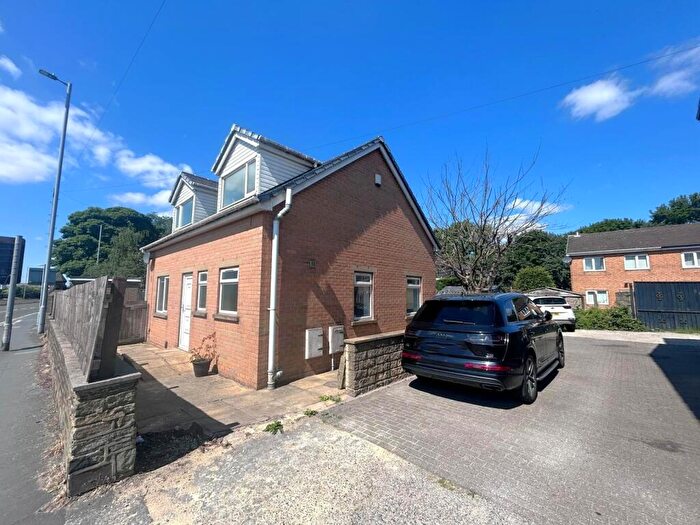
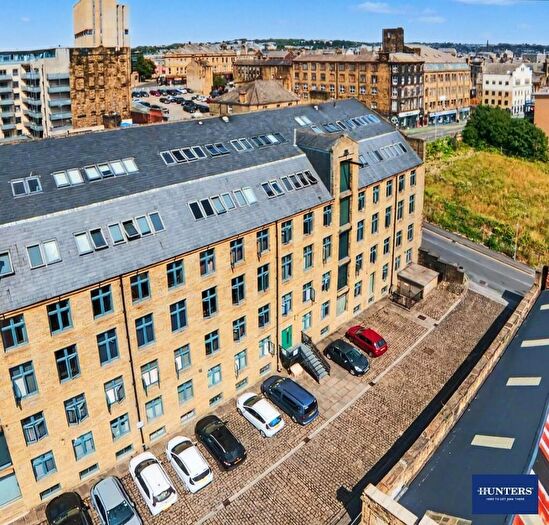
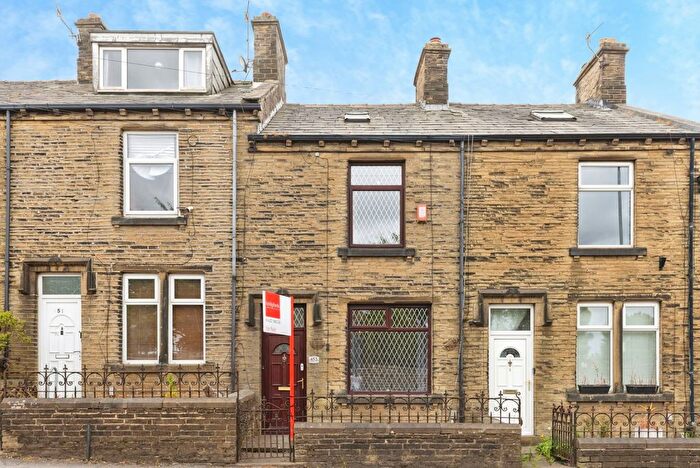
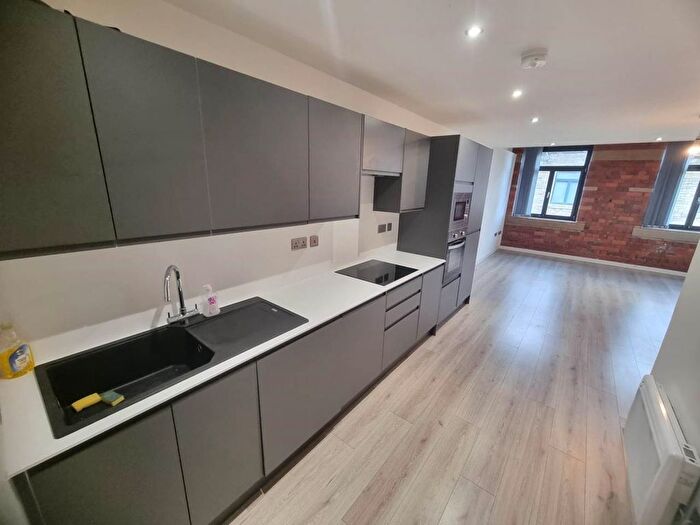
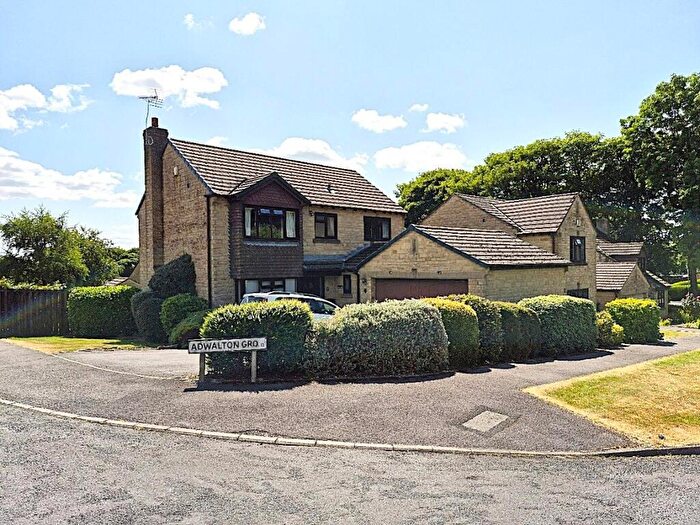
Properties for sale in Bradford

![]()
If you are looking to sell your house, let it out, or receive a property valuation, an expert can help you.
Click the button below to get started.

Neighbourhoods in Bradford
Navigate through our locations to find the location of your next house in Bradford, Bradford for sale or to rent.
Property price trends in Bradford
According to the latest Land Registry data, the average home in Bradford sold for £169,506 in 2026. That figure comes from a substantial record of 154,936 sales logged over the past 31 years.
Prices have continued to climb over the last three years. Compared with 2023, when the typical sale came in around £151,163, that's a rise of roughly 12.1%.
Looking back five years, average prices are up about 20.8% since 2021, a gain of around £29,233 in cash terms.
Zoom out to the past decade for the fuller picture. Back in 2016, homes here averaged £117,107, so the typical sold price has climbed about 44.7% since then, roughly 3.8% a year. Stretch the view to fifteen years and that annual pace eases back to about 3%.
Frequently asked questions about Bradford
What is the average price for a property for sale in Bradford?
The average price for a property for sale in Bradford is £158,466. This amount is 22% lower than the average price in Bradford. There are more than 10,000 property listings for sale in Bradford.
What locations have the most expensive properties for sale in Bradford?
The locations with the most expensive properties for sale in Bradford are Idle And Thackley at an average of £228,559, Bingley Rural at an average of £228,468 and Windhill And Wrose at an average of £197,697.
What locations have the most affordable properties for sale in Bradford?
The locations with the most affordable properties for sale in Bradford are Little Horton at an average of £103,982, Bowling And Barkerend at an average of £104,977 and Bradford Moor at an average of £109,860.
Which train stations are available in or near Bradford?
Some of the train stations available in or near Bradford are Bradford Forster Square, Bradford Interchange and Frizinghall.
Property Price Paid in Bradford by Year
The average sold property price by year was:
| Year | Average Sold Price | Price Change |
Sold Properties
|
|---|---|---|---|
| 2026 | £169,506 | 1% |
256 Properties |
| 2025 | £168,519 | 8% |
3,784 Properties |
| 2024 | £155,274 | 3% |
4,077 Properties |
| 2023 | £151,163 | 3% |
3,814 Properties |
| 2022 | £146,834 | 4% |
4,599 Properties |
| 2021 | £140,273 | 5% |
5,137 Properties |
| 2020 | £133,154 | 2% |
3,948 Properties |
| 2019 | £130,002 | 2% |
4,603 Properties |
| 2018 | £126,998 | 4% |
4,614 Properties |
| 2017 | £122,410 | 4% |
4,514 Properties |
Property Price per Property Type in Bradford
Here you can find historic sold price data in order to help with your property search.
The average Property Paid Price for specific property types in the last three years are:
| Property Type | Average Sold Price | Sold Properties |
|---|---|---|
| Semi Detached House | £173,585.00 | 4,419 Semi Detached Houses |
| Terraced House | £122,781.00 | 5,288 Terraced Houses |
| Detached House | £301,710.00 | 1,255 Detached Houses |
| Flat | £98,735.00 | 969 Flats |
Transport in Bradford
Please see below transportation links in this area:
