
Houses for sale & to rent in Harrow, Brent London Borough
House Prices in Harrow
Properties in this part of Harrow within the Brent London Borough have an average house price of £637k and had 320 Property Transactions within the last 3 years.¹ This area has 5,965 households² , where the most expensive property was sold for £1.75M.
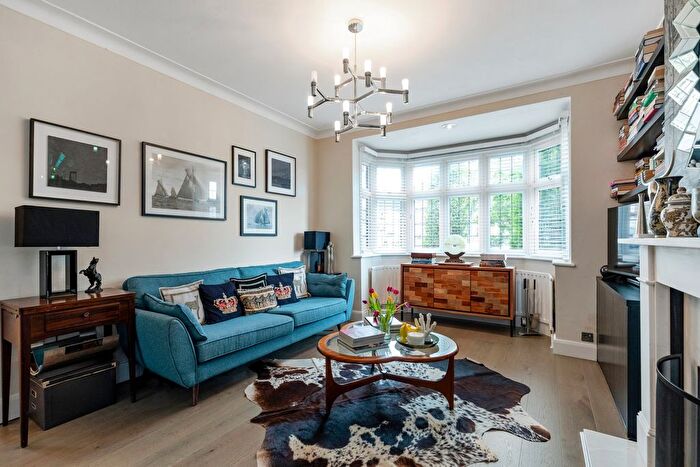
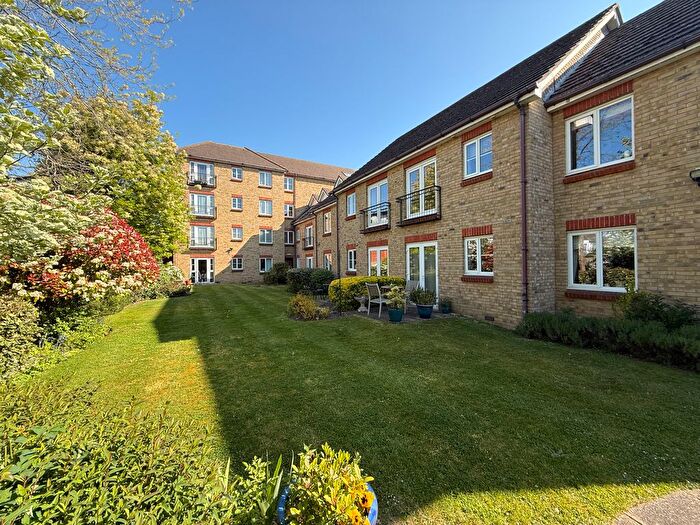
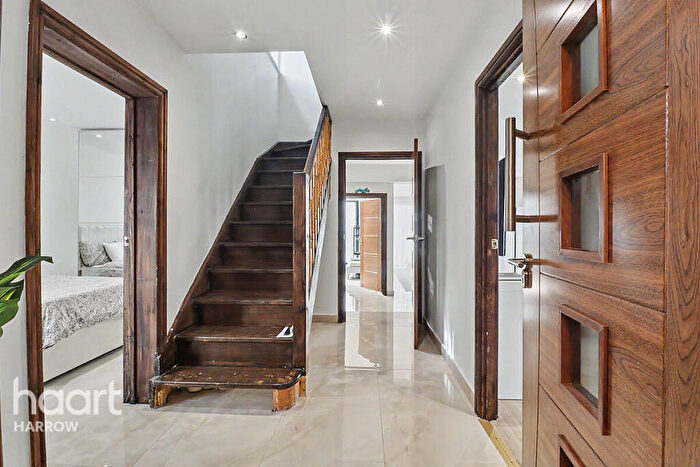
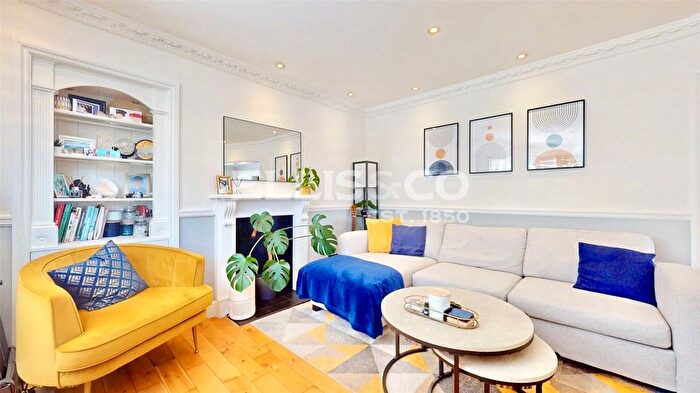
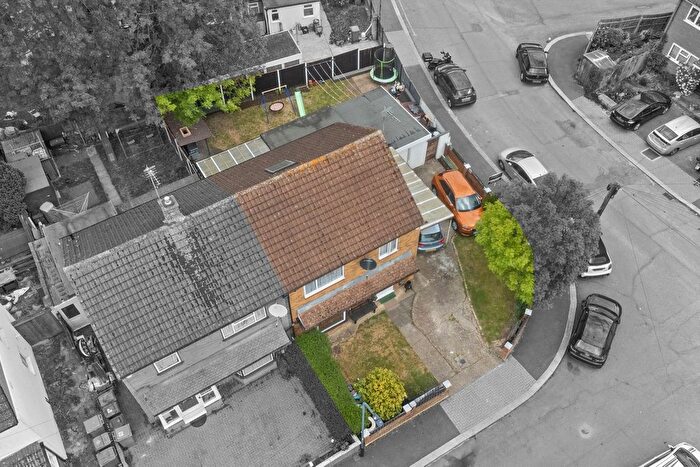
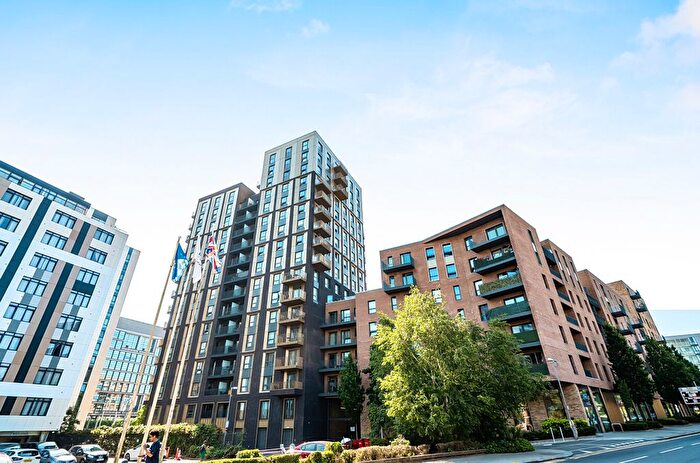
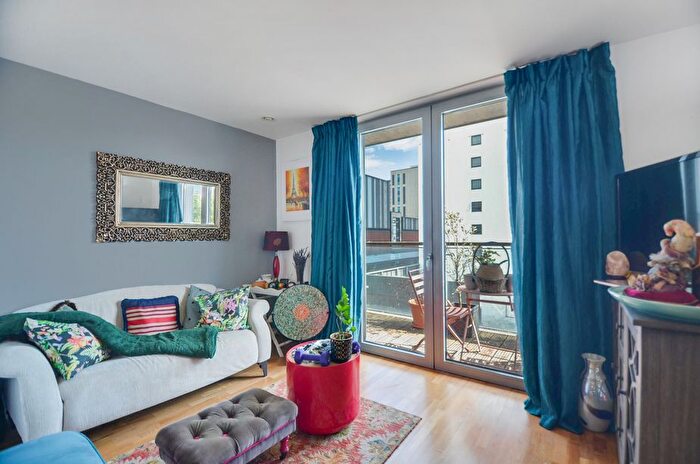
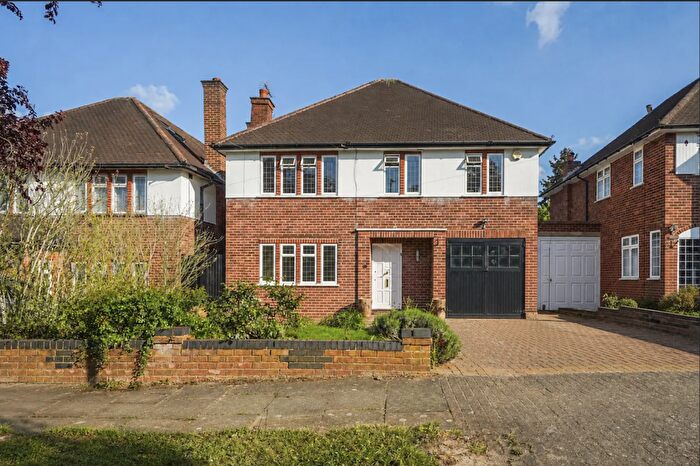
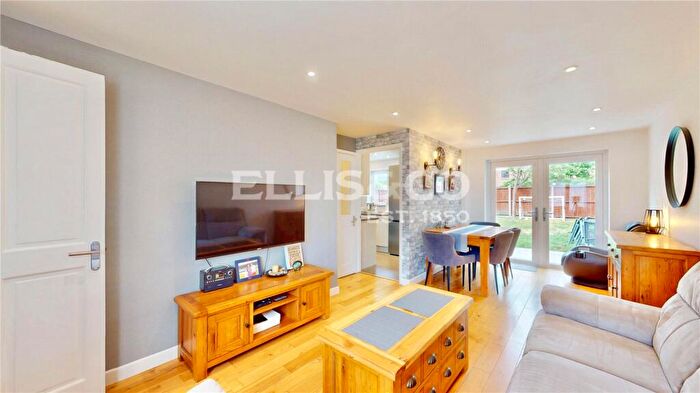
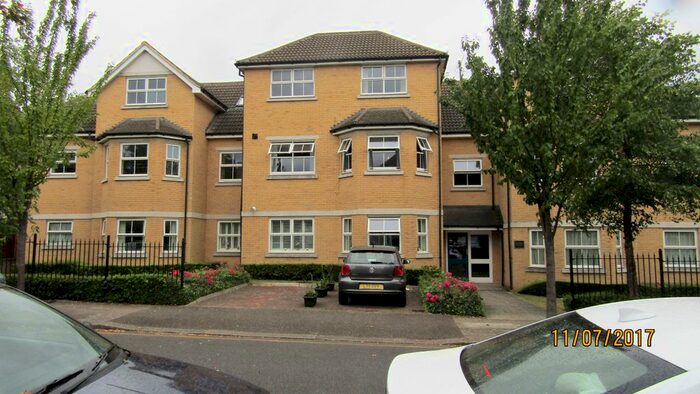
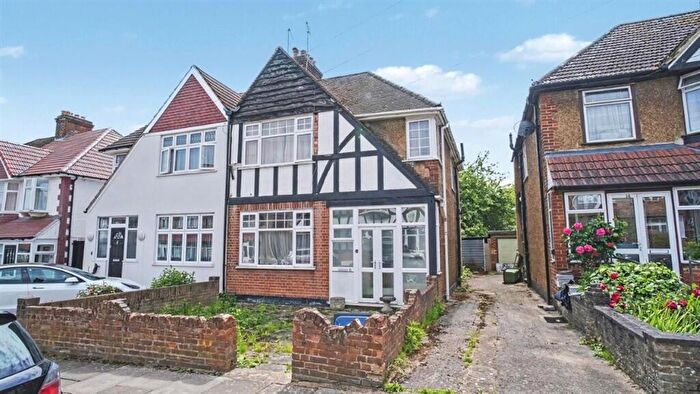
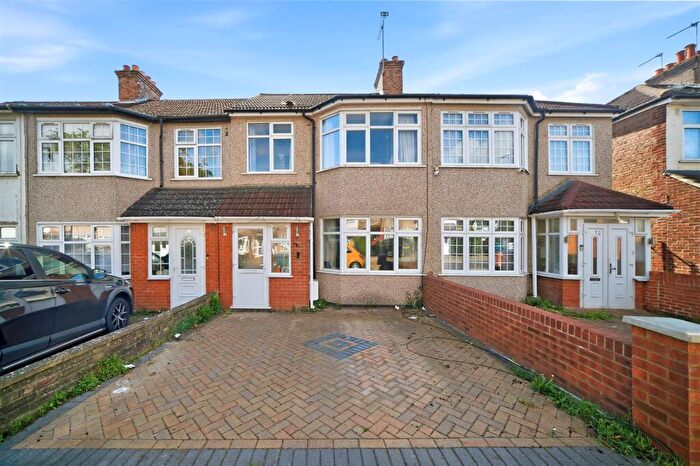
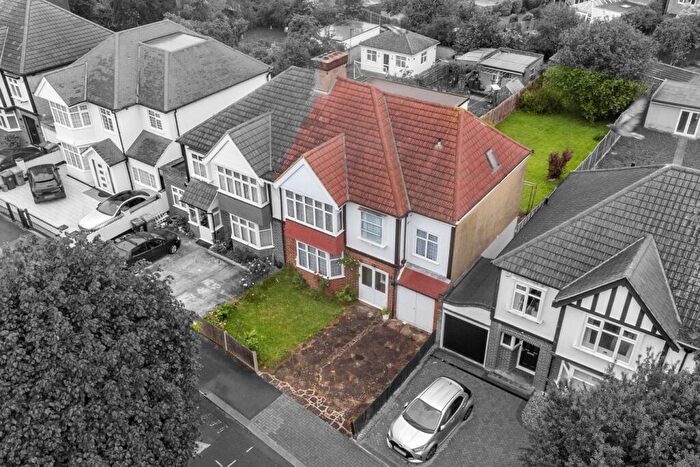
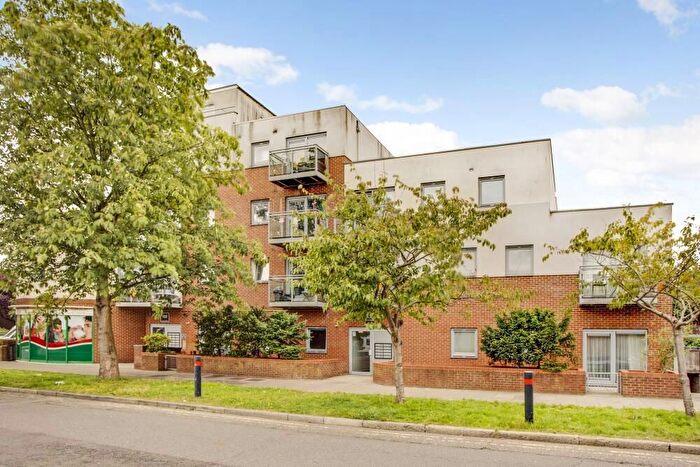
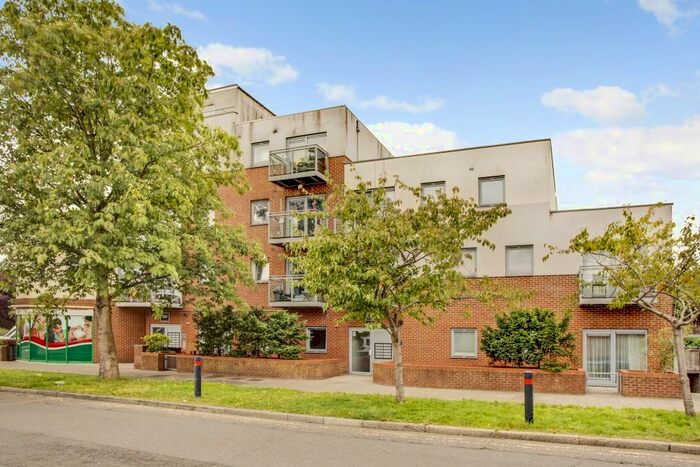
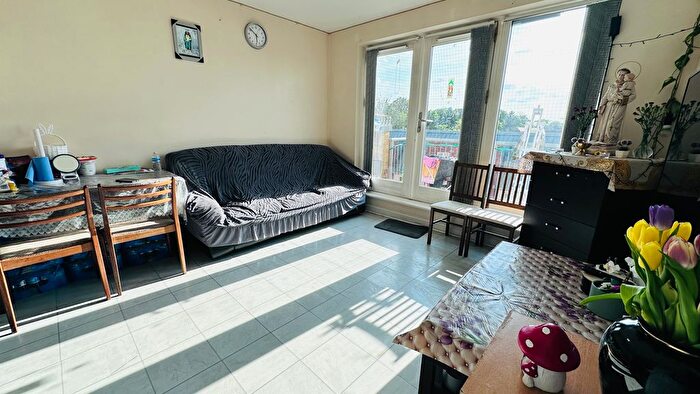
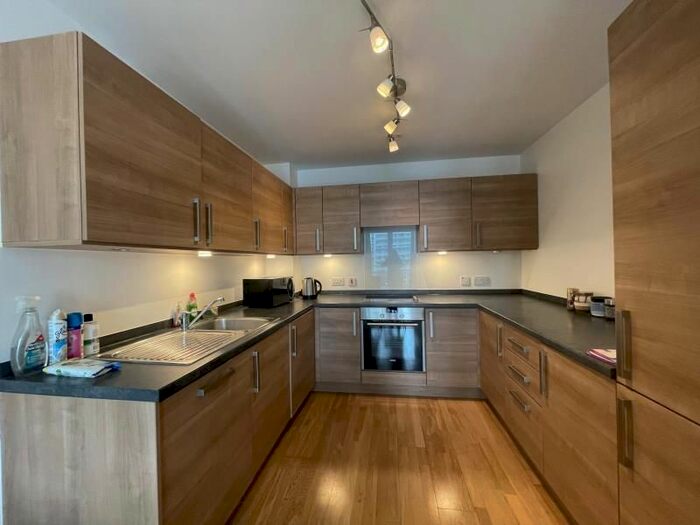
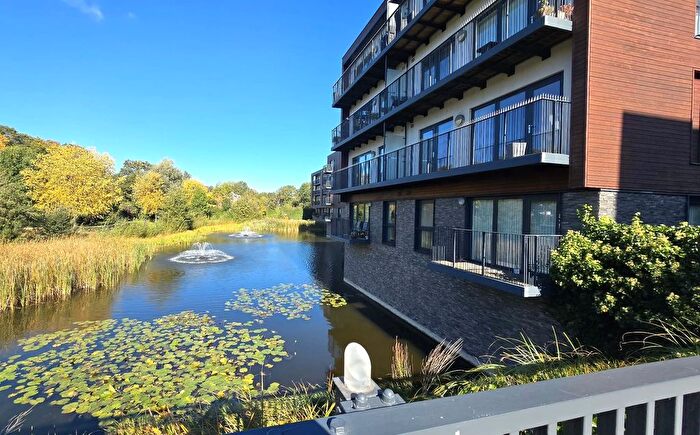
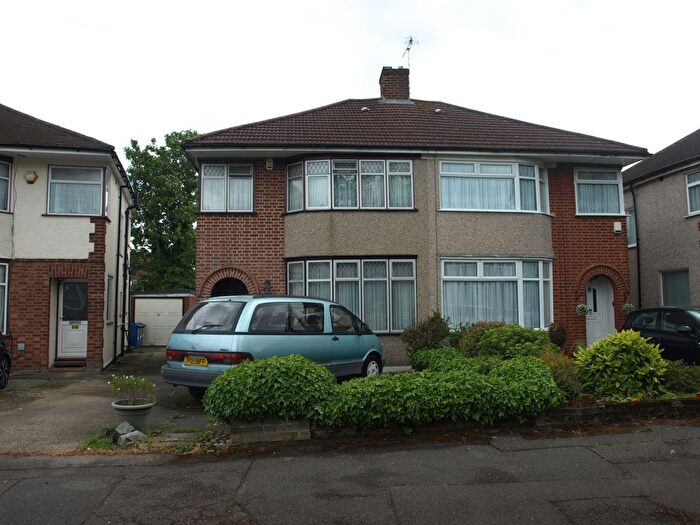
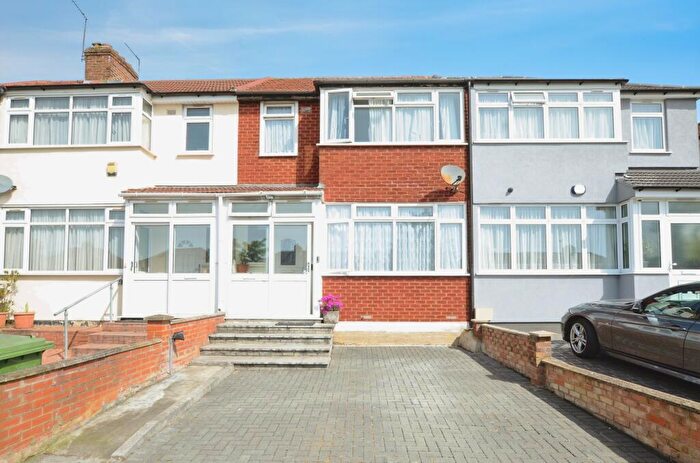
Properties for sale in Harrow
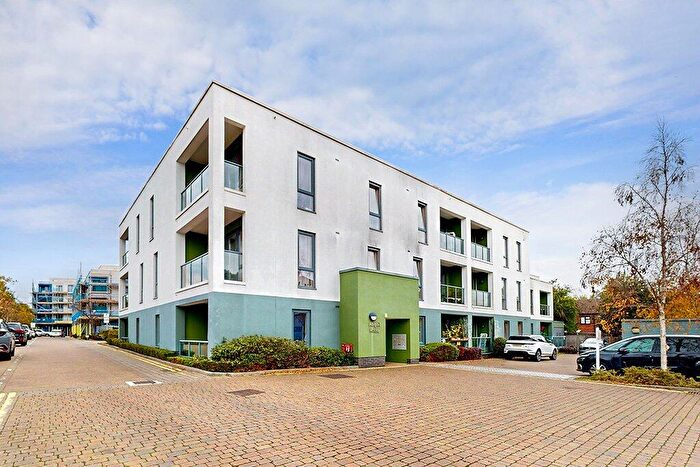
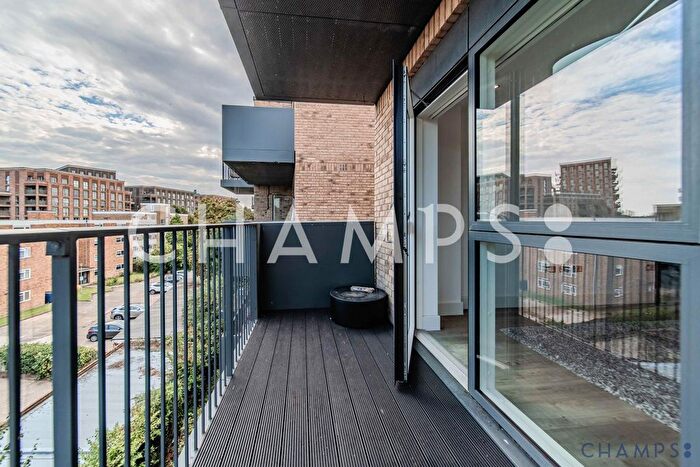
![]()
If you are looking to sell your house, let it out, or receive a property valuation, an expert can help you.
Click the button below to get started.

Neighbourhoods in Harrow
Navigate through our locations to find the location of your next house in Harrow, Brent London Borough for sale or to rent.
Transport in Harrow
Please see below transportation links in this area:
-


 Kenton Station
 -
Preston Road Station
-
South Kenton Station
-
Northwick Park Station
-
Kingsbury Station
-
North Wembley Station
-
Queensbury Station
-
Wembley Park Station
-
Harrow-on-the-Hill Station
-
Harrow and Wealdstone Station
- FAQ
- Price Paid By Year
- Property Type Price
Frequently asked questions about Harrow
What is the average price for a property for sale in Harrow?
The average price for a property for sale in Harrow is £637,358. This amount is 1% higher than the average price in Brent London Borough. There are 7,702 property listings for sale in Harrow.
What locations have the most expensive properties for sale in Harrow?
The locations with the most expensive properties for sale in Harrow are Northwick Park at an average of £875,357 and Kenton at an average of £638,164.
What locations have the most affordable properties for sale in Harrow?
The location with the most affordable properties for sale in Harrow is Barnhill at an average of £359,968.
Which train stations are available in or near Harrow?
Some of the train stations available in or near Harrow are Kenton, South Kenton and North Wembley.
Which tube stations are available in or near Harrow?
Some of the tube stations available in or near Harrow are Kenton, Preston Road and South Kenton.
Property Price Paid in Harrow by Year
The average sold property price by year was:
| Year | Average Sold Price | Price Change |
Sold Properties
|
|---|---|---|---|
| 2026 | £536,250 | -15% |
4 Properties |
| 2025 | £616,099 | -3% |
95 Properties |
| 2024 | £632,518 | -5% |
120 Properties |
| 2023 | £667,109 | 3% |
101 Properties |
| 2022 | £649,840 | 7% |
102 Properties |
| 2021 | £604,315 | 5% |
132 Properties |
| 2020 | £575,818 | 2% |
88 Properties |
| 2019 | £562,424 | -13% |
97 Properties |
| 2018 | £635,843 | 3% |
100 Properties |
| 2017 | £618,166 | 9% |
96 Properties |
| 2016 | £559,741 | 9% |
151 Properties |
| 2015 | £511,229 | 15% |
146 Properties |
| 2014 | £435,890 | 9% |
154 Properties |
| 2013 | £394,737 | 4% |
120 Properties |
| 2012 | £379,406 | 2% |
115 Properties |
| 2011 | £371,012 | -5% |
120 Properties |
| 2010 | £389,180 | 5% |
121 Properties |
| 2009 | £368,518 | -8% |
100 Properties |
| 2008 | £398,659 | 14% |
96 Properties |
| 2007 | £342,103 | 6% |
253 Properties |
| 2006 | £323,133 | 2% |
238 Properties |
| 2005 | £315,687 | -0,5% |
145 Properties |
| 2004 | £317,252 | 14% |
179 Properties |
| 2003 | £272,764 | 6% |
226 Properties |
| 2002 | £255,137 | 16% |
198 Properties |
| 2001 | £213,095 | 10% |
220 Properties |
| 2000 | £191,351 | 18% |
198 Properties |
| 1999 | £157,523 | 4% |
230 Properties |
| 1998 | £151,473 | 16% |
181 Properties |
| 1997 | £127,929 | 6% |
231 Properties |
| 1996 | £119,718 | 15% |
173 Properties |
| 1995 | £102,330 | - |
151 Properties |
Property Price per Property Type in Harrow
Here you can find historic sold price data in order to help with your property search.
The average Property Paid Price for specific property types in the last three years are:
| Property Type | Average Sold Price | Sold Properties |
|---|---|---|
| Flat | £261,470.00 | 90 Flats |
| Semi Detached House | £716,210.00 | 144 Semi Detached Houses |
| Detached House | £997,881.00 | 59 Detached Houses |
| Terraced House | £681,966.00 | 27 Terraced Houses |