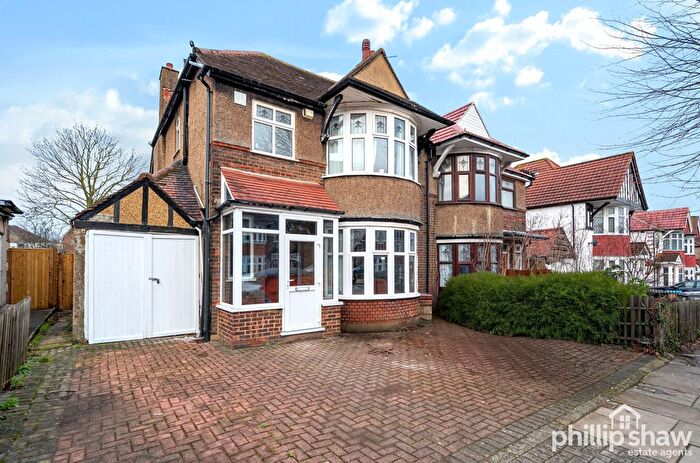
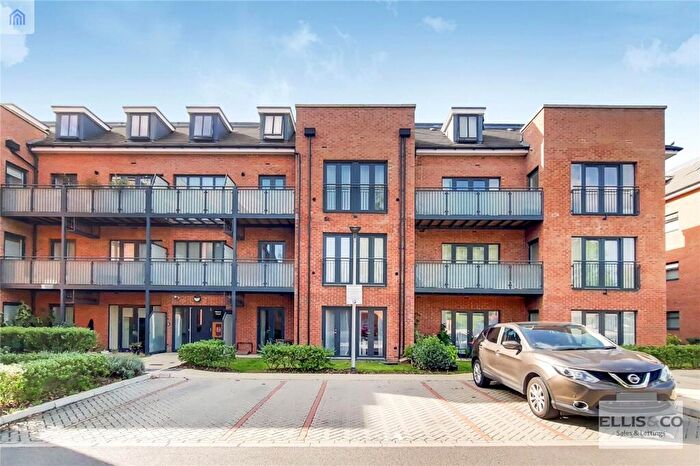
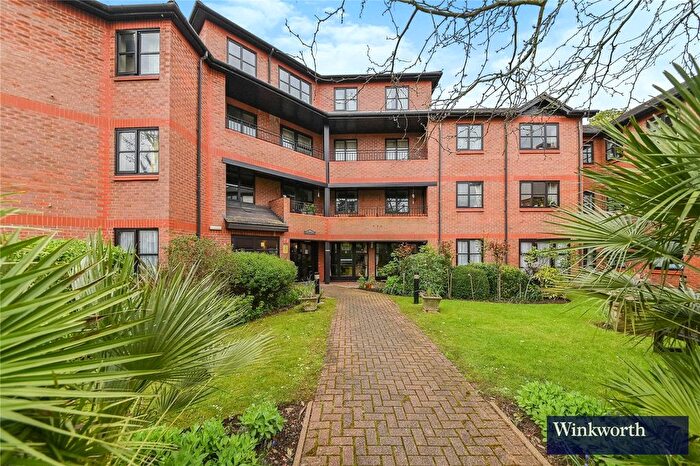
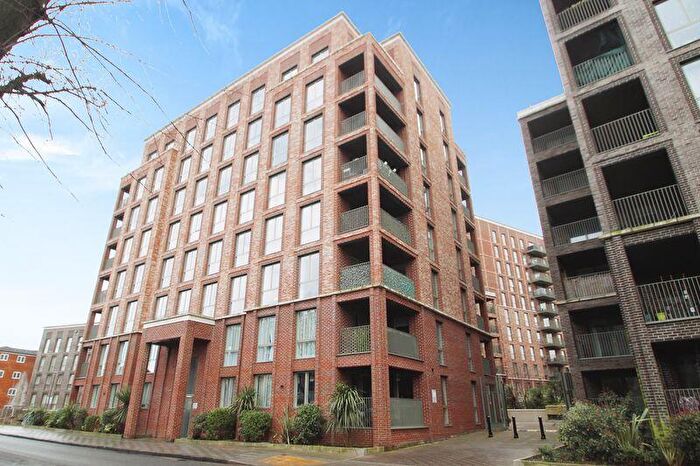
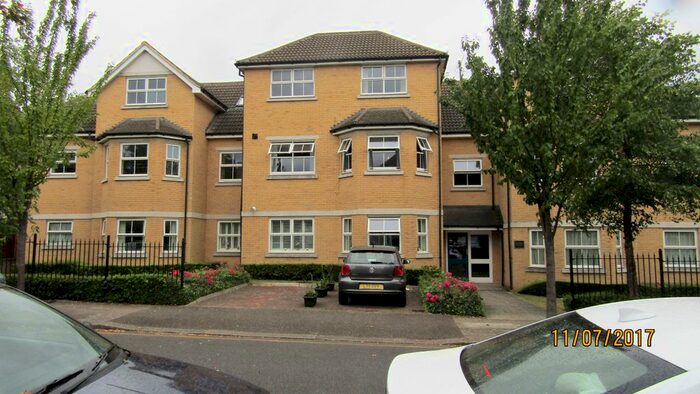
Houses for sale & to rent in Northwick Park, Harrow
House Prices in Northwick Park
Properties in this part of Northwick Park within Harrow have an average house price of £896,456.00 and had 50 Property Transactions within the last 3 years¹. This area has 1,356 households² , where the most expensive property was sold for £1,750,000.00.
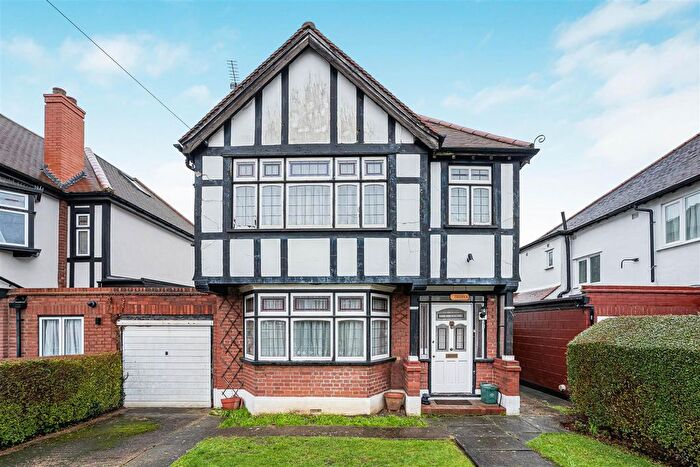
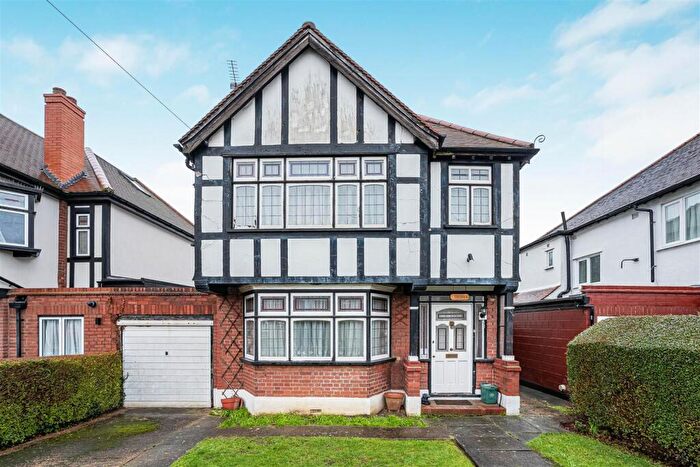
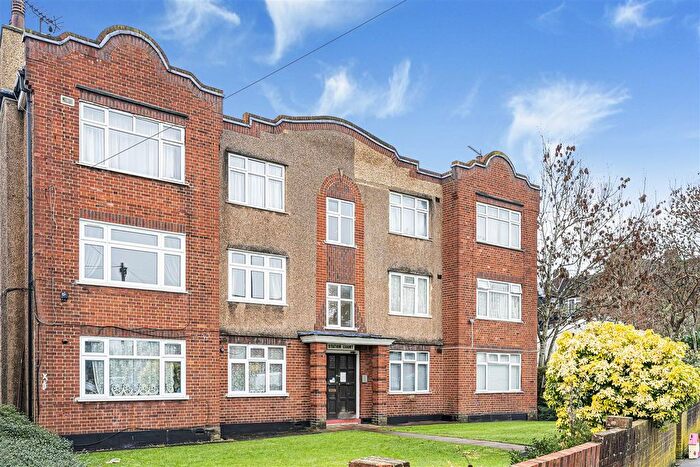
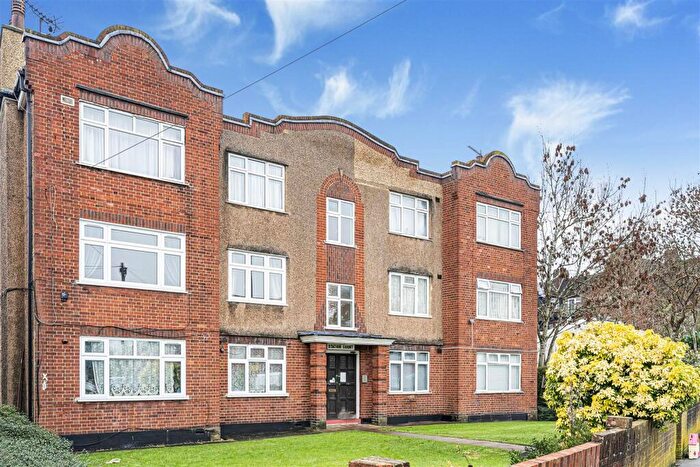
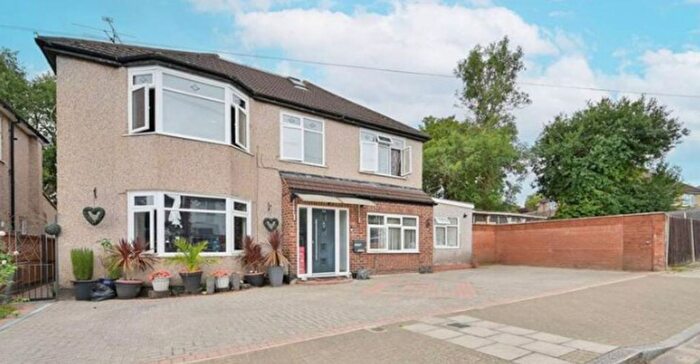
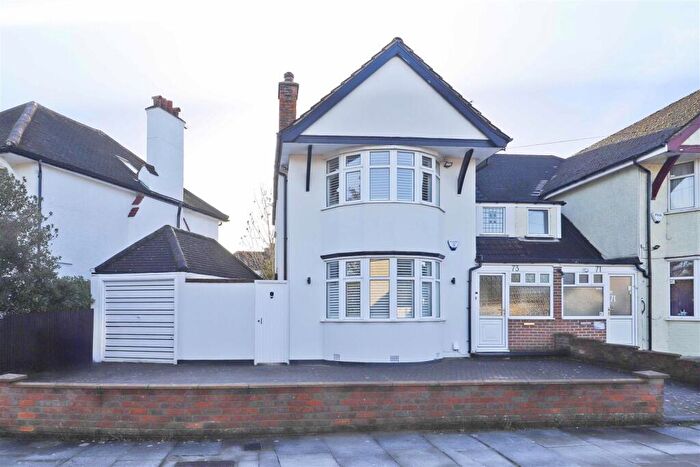
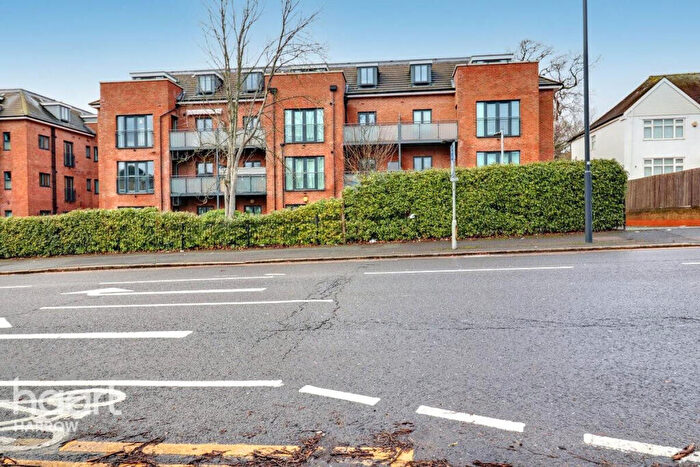
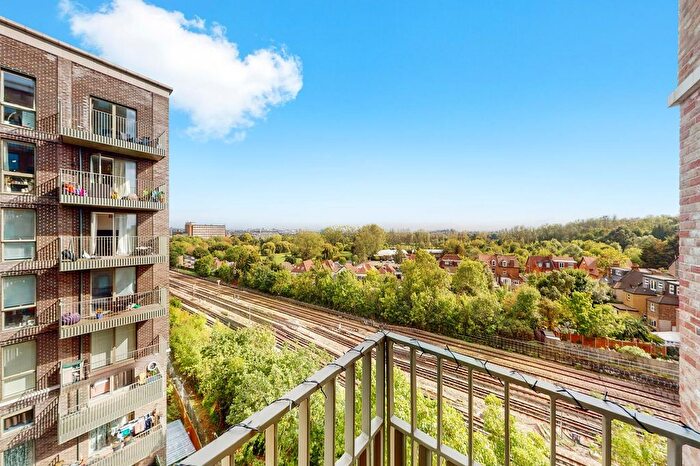
Properties for sale in Northwick Park
Roads and Postcodes in Northwick Park
Navigate through our locations to find the location of your next house in Northwick Park, Harrow for sale or to rent.
| Streets | Postcodes |
|---|---|
| Amery Road | HA1 3UH HA1 3UQ |
| Bengeworth Road | HA1 3SE HA1 3SF |
| Churchill Avenue | HA3 0AX HA3 0AY |
| Kenelm Close | HA1 3TE |
| Kenton Road | HA3 0AD HA3 0AG HA3 0AH HA3 0AN HA3 0AP HA3 0AQ HA3 0AZ |
| Littleton Crescent | HA1 3SX |
| Littleton Road | HA1 3SU HA1 3SY |
| Mulgrave Road | HA1 3UF HA1 3UG |
| Nightingale Avenue | HA1 3GH HA1 3GJ HA1 3GL HA1 3GN HA1 3GP HA1 3GX |
| Northwick Avenue | HA3 0AA HA3 0AB HA3 0AT HA3 0AU HA3 0DG |
| Northwick Close | HA1 3GQ HA1 3GY |
| Old Kenton Lane | NW9 9LY |
| Pebworth Road | HA1 3UB HA1 3UD HA1 3UE |
| Rushout Avenue | HA3 0AR HA3 0AS |
| St Marks Close | HA1 3GZ |
| Sudbury Court Drive | HA1 3SS HA1 3ST HA1 3TA HA1 3TB HA1 3TD HA1 3TF HA1 3TG |
| Sudbury Court Road | HA1 3SD HA1 3SG HA1 3SH HA1 3SJ HA1 3SQ HA1 3GS |
| Watford Road | HA1 3TS HA1 3TT HA1 3TU HA1 3TX HA1 3TY HA1 3UA HA1 3TP HA1 3TZ HA1 3UJ |
Transport near Northwick Park
-
Northwick Park Station
-
South Kenton Station
-
Kenton Station
-
Harrow-On-The-Hill Station
-
North Wembley Station
-
Sudbury Hill Harrow Station
-
Sudbury Hill Station
-
Preston Road Station
-
Sudbury and Harrow Road Station
-
South Harrow Station
- FAQ
- Price Paid By Year
- Property Type Price
Frequently asked questions about Northwick Park
What is the average price for a property for sale in Northwick Park?
The average price for a property for sale in Northwick Park is £896,456. This amount is 38% higher than the average price in Harrow. There are 1,677 property listings for sale in Northwick Park.
What streets have the most expensive properties for sale in Northwick Park?
The streets with the most expensive properties for sale in Northwick Park are Littleton Crescent at an average of £1,750,000, Pebworth Road at an average of £1,273,750 and Amery Road at an average of £1,199,000.
What streets have the most affordable properties for sale in Northwick Park?
The streets with the most affordable properties for sale in Northwick Park are Kenton Road at an average of £253,062, Sudbury Court Road at an average of £516,250 and Northwick Avenue at an average of £547,916.
Which train stations are available in or near Northwick Park?
Some of the train stations available in or near Northwick Park are South Kenton, Kenton and Harrow-On-The-Hill.
Which tube stations are available in or near Northwick Park?
Some of the tube stations available in or near Northwick Park are Northwick Park, South Kenton and Kenton.
Property Price Paid in Northwick Park by Year
The average sold property price by year was:
| Year | Average Sold Price | Price Change |
Sold Properties
|
|---|---|---|---|
| 2025 | £784,857 | -2% |
7 Properties |
| 2024 | £800,266 | -45% |
20 Properties |
| 2023 | £1,161,153 | 29% |
13 Properties |
| 2022 | £822,850 | -2% |
10 Properties |
| 2021 | £841,978 | 23% |
23 Properties |
| 2020 | £650,882 | -6% |
17 Properties |
| 2019 | £690,246 | -15% |
15 Properties |
| 2018 | £790,722 | -3% |
27 Properties |
| 2017 | £818,252 | 15% |
18 Properties |
| 2016 | £696,356 | 16% |
23 Properties |
| 2015 | £584,603 | 18% |
28 Properties |
| 2014 | £482,176 | 16% |
28 Properties |
| 2013 | £403,151 | -10% |
26 Properties |
| 2012 | £443,636 | 15% |
18 Properties |
| 2011 | £376,834 | -9% |
35 Properties |
| 2010 | £410,273 | -28% |
19 Properties |
| 2009 | £523,230 | -9% |
13 Properties |
| 2008 | £570,247 | 40% |
18 Properties |
| 2007 | £341,948 | -0,2% |
40 Properties |
| 2006 | £342,712 | -17% |
49 Properties |
| 2005 | £402,150 | 10% |
20 Properties |
| 2004 | £360,292 | 11% |
34 Properties |
| 2003 | £319,970 | -0,3% |
51 Properties |
| 2002 | £320,920 | 13% |
36 Properties |
| 2001 | £279,464 | 23% |
38 Properties |
| 2000 | £215,480 | 15% |
45 Properties |
| 1999 | £182,941 | 8% |
47 Properties |
| 1998 | £168,026 | 5% |
37 Properties |
| 1997 | £159,911 | - |
40 Properties |
| 1996 | £159,953 | 35% |
39 Properties |
| 1995 | £103,441 | - |
23 Properties |
Property Price per Property Type in Northwick Park
Here you can find historic sold price data in order to help with your property search.
The average Property Paid Price for specific property types in the last three years are:
| Property Type | Average Sold Price | Sold Properties |
|---|---|---|
| Semi Detached House | £768,563.00 | 9 Semi Detached Houses |
| Detached House | £1,132,750.00 | 28 Detached Houses |
| Terraced House | £943,750.00 | 4 Terraced Houses |
| Flat | £268,194.00 | 9 Flats |

