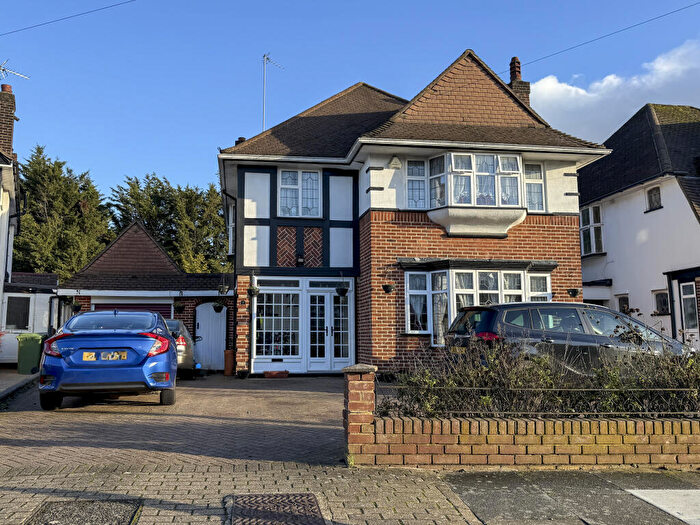
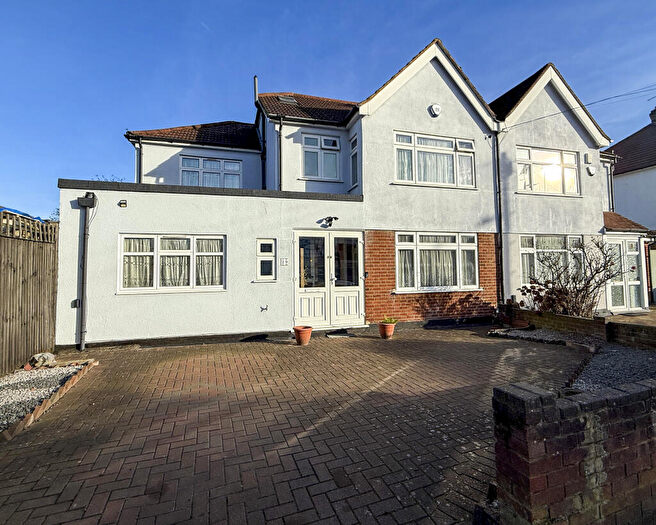
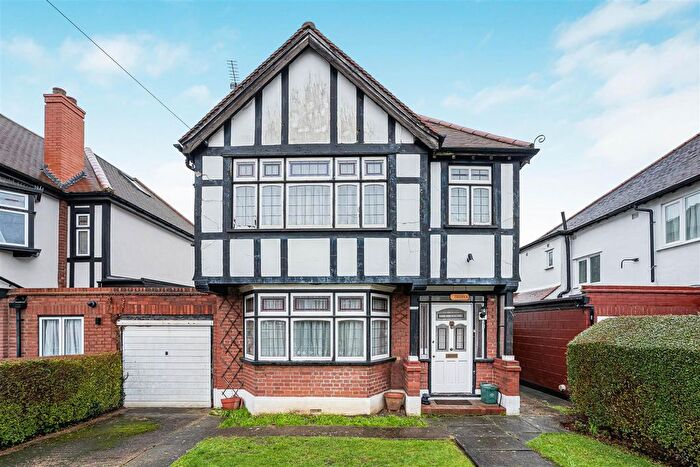
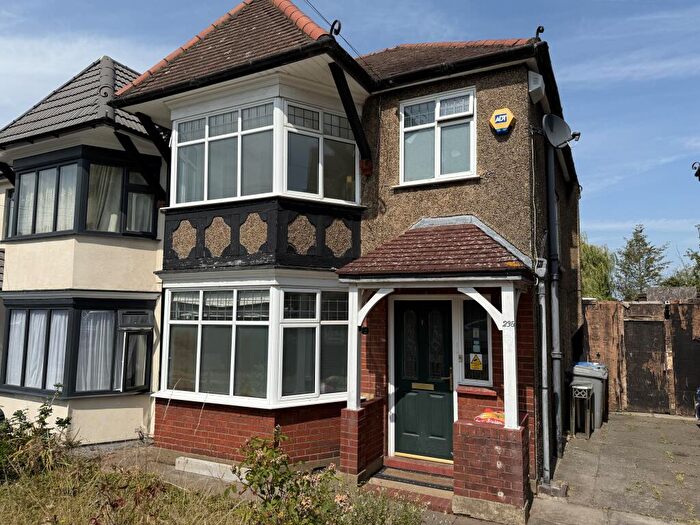
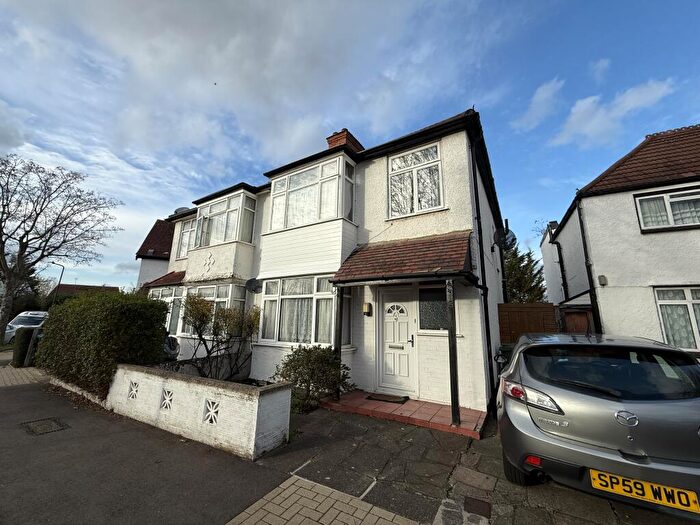
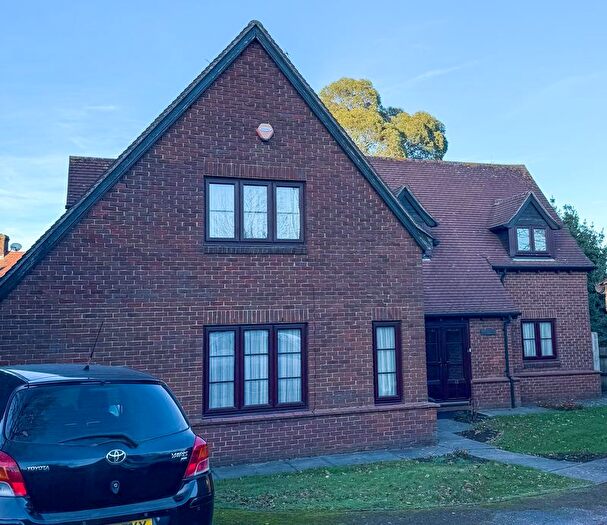
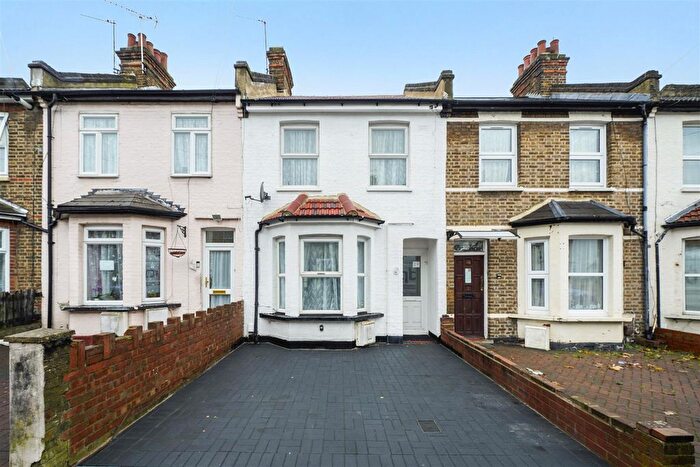
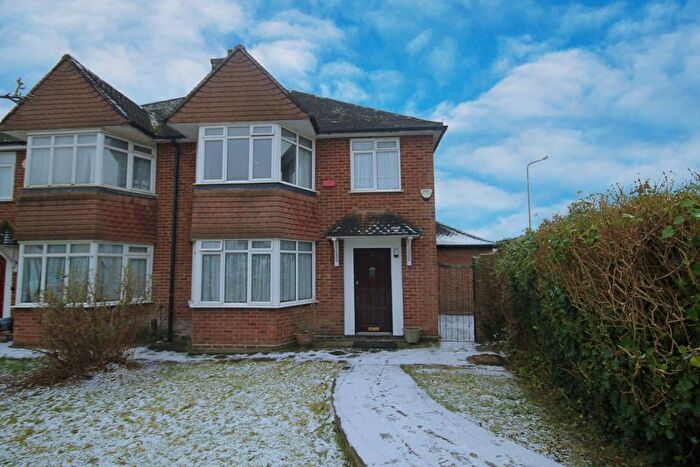
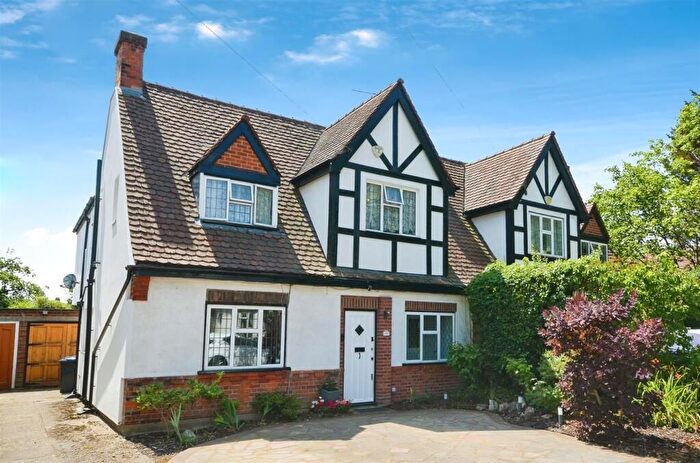
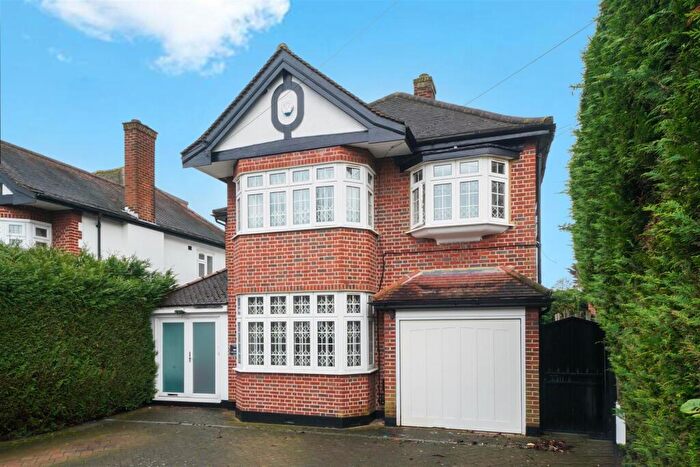
Houses for sale & to rent in Northwick Park, Wembley
House Prices in Northwick Park
Properties in this part of Northwick Park within Wembley have an average house price of £613,454.00 and had 170 Property Transactions within the last 3 years¹. This area has 2,780 households² , where the most expensive property was sold for £1,200,000.00.
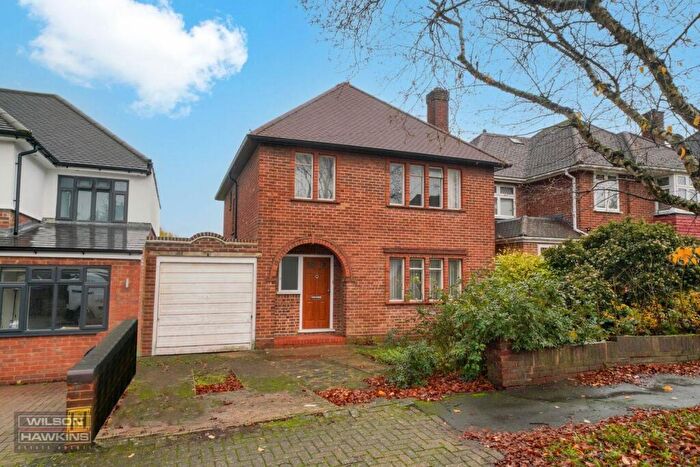
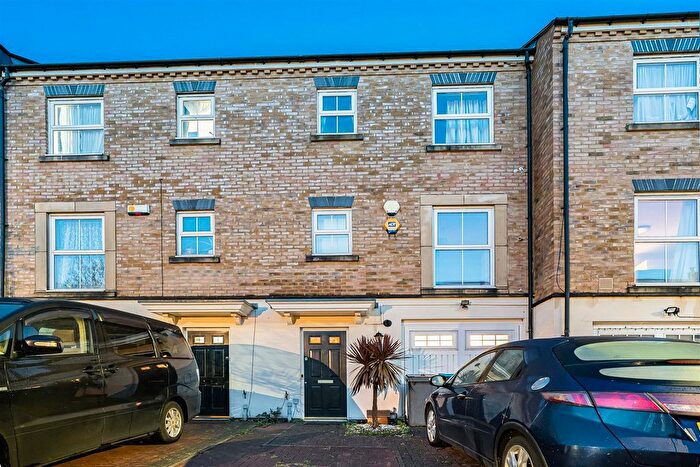
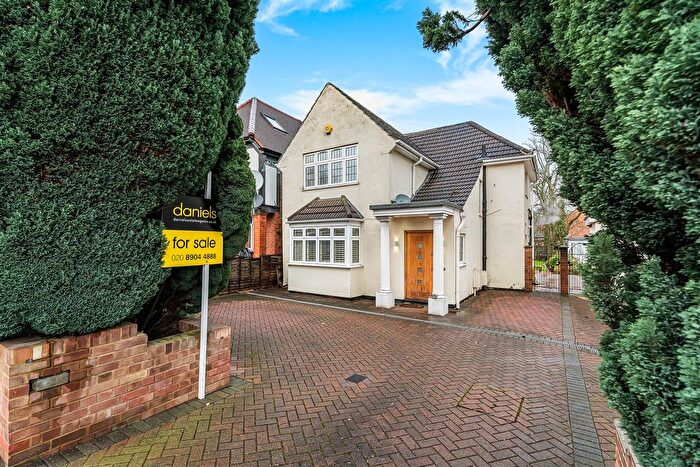
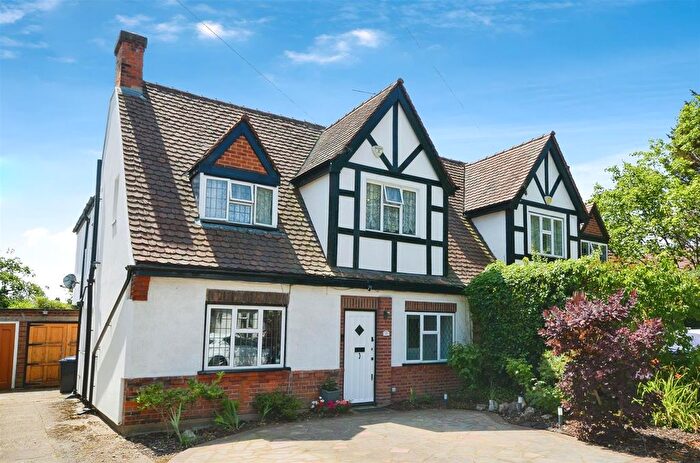
Properties for sale in Northwick Park
Roads and Postcodes in Northwick Park
Navigate through our locations to find the location of your next house in Northwick Park, Wembley for sale or to rent.
Transport near Northwick Park
-
South Kenton Station
-
North Wembley Station
-
Sudbury and Harrow Road Station
-
Sudbury Town Station
-
Sudbury Hill Harrow Station
-
Northwick Park Station
-
Sudbury Hill Station
-
Preston Road Station
-
Kenton Station
-
Wembley Central Station
- FAQ
- Price Paid By Year
- Property Type Price
Frequently asked questions about Northwick Park
What is the average price for a property for sale in Northwick Park?
The average price for a property for sale in Northwick Park is £613,454. This amount is 27% higher than the average price in Wembley. There are 1,795 property listings for sale in Northwick Park.
What streets have the most expensive properties for sale in Northwick Park?
The streets with the most expensive properties for sale in Northwick Park are Campden Crescent at an average of £878,333, Priory Crescent at an average of £862,500 and Holt Road at an average of £850,000.
What streets have the most affordable properties for sale in Northwick Park?
The streets with the most affordable properties for sale in Northwick Park are Foxlees at an average of £229,000, Sudbury Croft at an average of £297,333 and Harrow Road at an average of £311,937.
Which train stations are available in or near Northwick Park?
Some of the train stations available in or near Northwick Park are South Kenton, North Wembley and Sudbury and Harrow Road.
Which tube stations are available in or near Northwick Park?
Some of the tube stations available in or near Northwick Park are South Kenton, North Wembley and Sudbury Town.
Property Price Paid in Northwick Park by Year
The average sold property price by year was:
| Year | Average Sold Price | Price Change |
Sold Properties
|
|---|---|---|---|
| 2025 | £598,842 | -1% |
27 Properties |
| 2024 | £605,550 | -10% |
40 Properties |
| 2023 | £667,711 | 13% |
45 Properties |
| 2022 | £583,612 | -11% |
58 Properties |
| 2021 | £650,109 | 9% |
68 Properties |
| 2020 | £589,662 | 13% |
54 Properties |
| 2019 | £515,723 | -4% |
49 Properties |
| 2018 | £535,745 | 3% |
57 Properties |
| 2017 | £520,250 | 3% |
46 Properties |
| 2016 | £503,138 | 7% |
64 Properties |
| 2015 | £469,115 | 6% |
60 Properties |
| 2014 | £443,265 | 17% |
65 Properties |
| 2013 | £366,155 | 5% |
53 Properties |
| 2012 | £349,500 | -2% |
49 Properties |
| 2011 | £356,086 | 15% |
62 Properties |
| 2010 | £303,331 | 3% |
61 Properties |
| 2009 | £293,107 | -14% |
46 Properties |
| 2008 | £334,079 | 3% |
55 Properties |
| 2007 | £325,094 | 9% |
105 Properties |
| 2006 | £296,070 | 3% |
97 Properties |
| 2005 | £286,081 | 3% |
69 Properties |
| 2004 | £277,303 | 12% |
93 Properties |
| 2003 | £243,536 | 10% |
125 Properties |
| 2002 | £219,896 | 15% |
134 Properties |
| 2001 | £186,785 | 14% |
141 Properties |
| 2000 | £161,457 | 13% |
118 Properties |
| 1999 | £139,985 | 15% |
127 Properties |
| 1998 | £118,723 | 14% |
134 Properties |
| 1997 | £102,581 | 4% |
130 Properties |
| 1996 | £98,671 | 1% |
116 Properties |
| 1995 | £97,543 | - |
90 Properties |
Property Price per Property Type in Northwick Park
Here you can find historic sold price data in order to help with your property search.
The average Property Paid Price for specific property types in the last three years are:
| Property Type | Average Sold Price | Sold Properties |
|---|---|---|
| Semi Detached House | £702,462.00 | 94 Semi Detached Houses |
| Detached House | £831,722.00 | 9 Detached Houses |
| Terraced House | £629,950.00 | 30 Terraced Houses |
| Flat | £320,858.00 | 37 Flats |

