
Houses for sale in Bromley, Bromley London Borough
House Prices in Bromley
Properties in this part of Bromley within the Bromley London Borough have an average house price of £563k and had 3,288 Property Transactions within the last 3 years.¹ This area has 35,373 households² , where the most expensive property was sold for £3.39M.
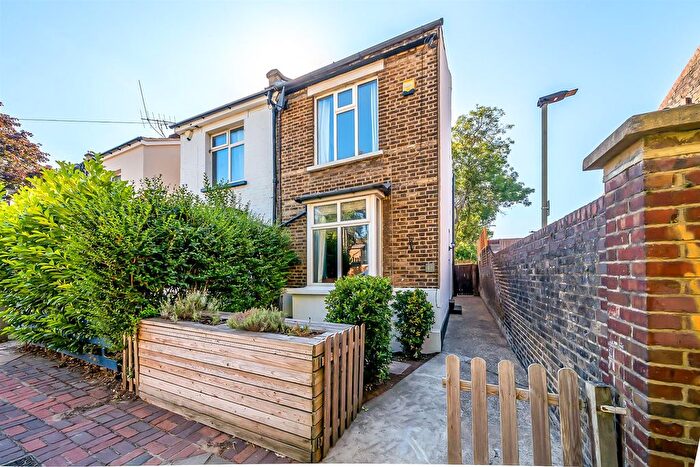
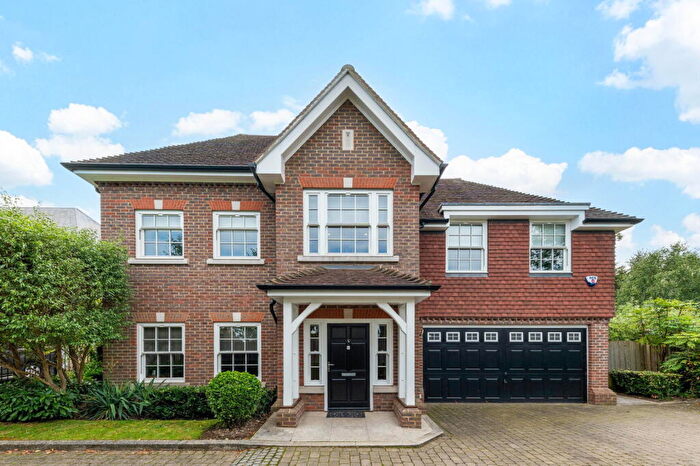
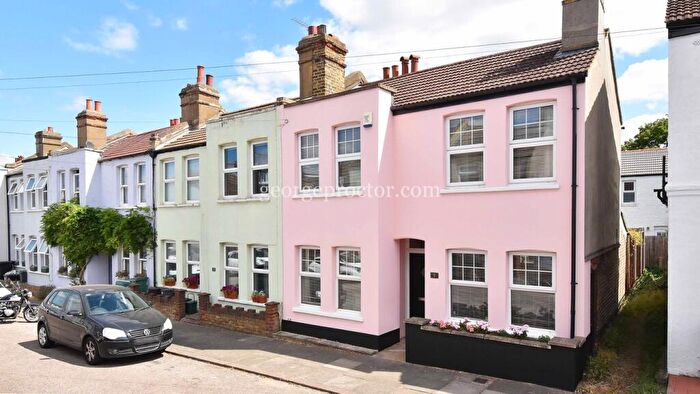
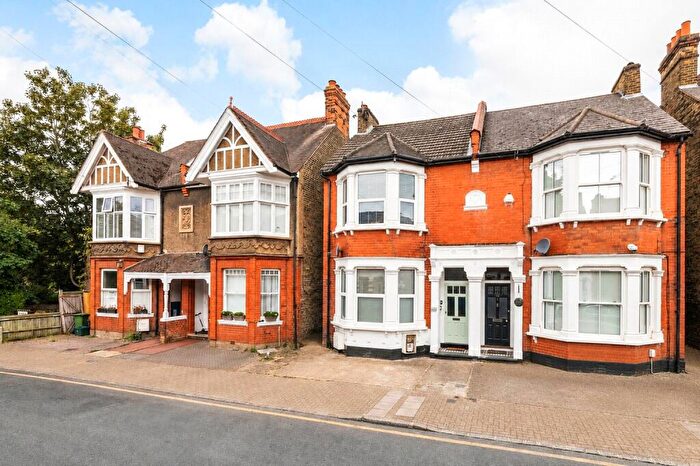
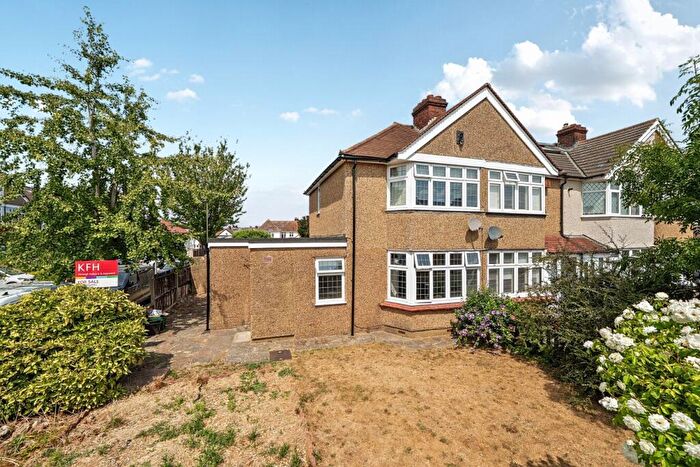
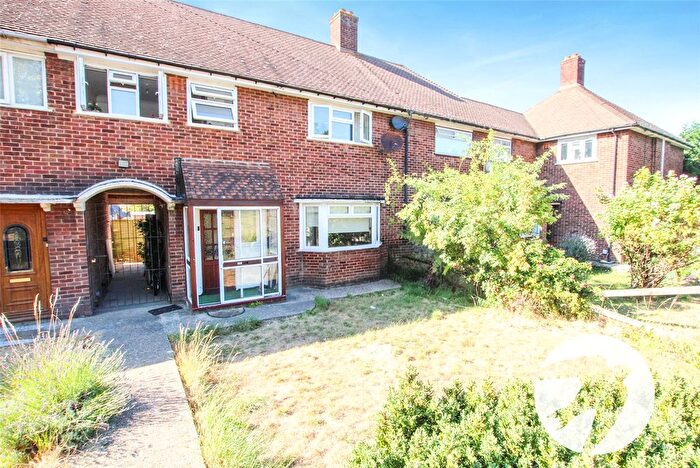
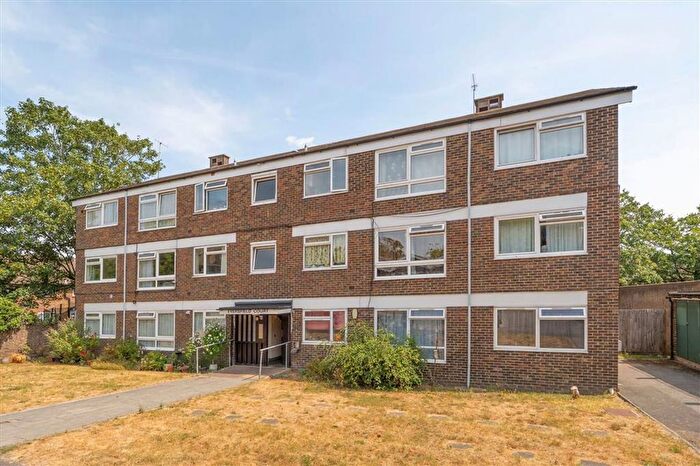
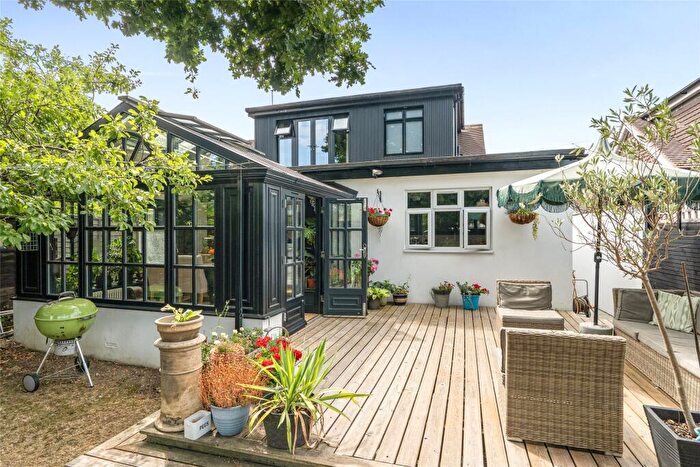
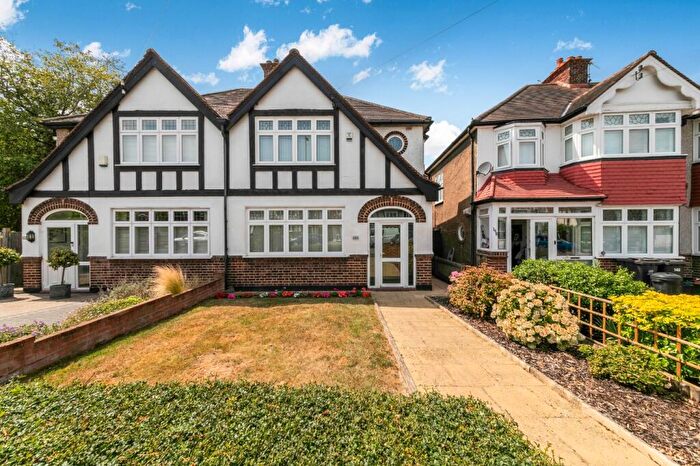
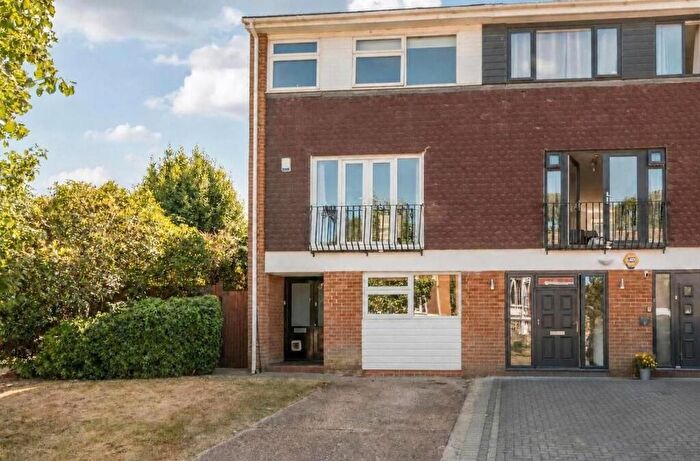
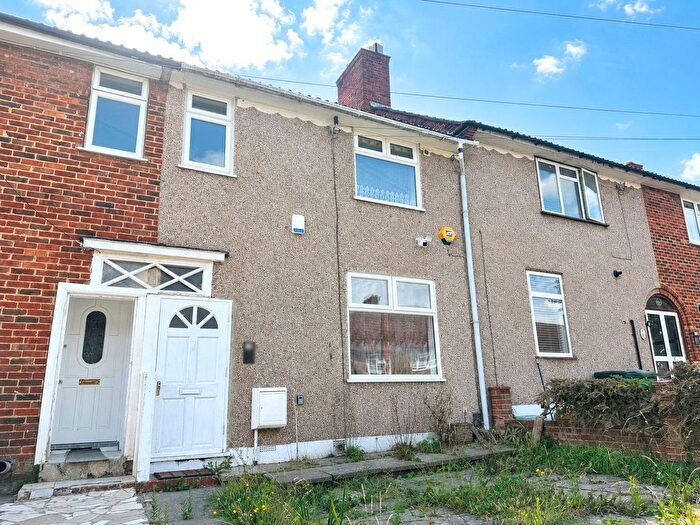
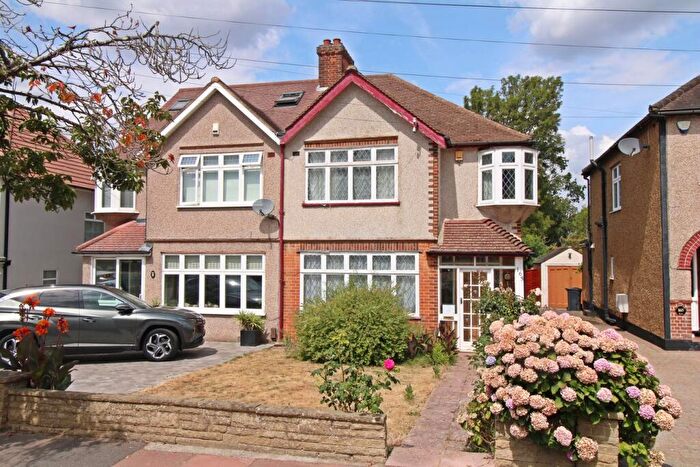
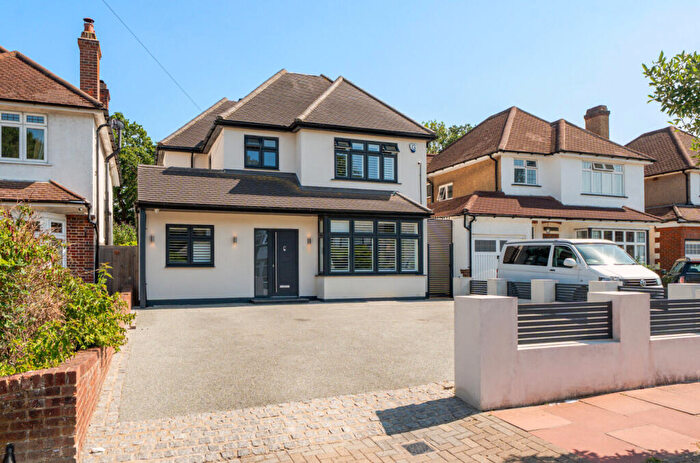
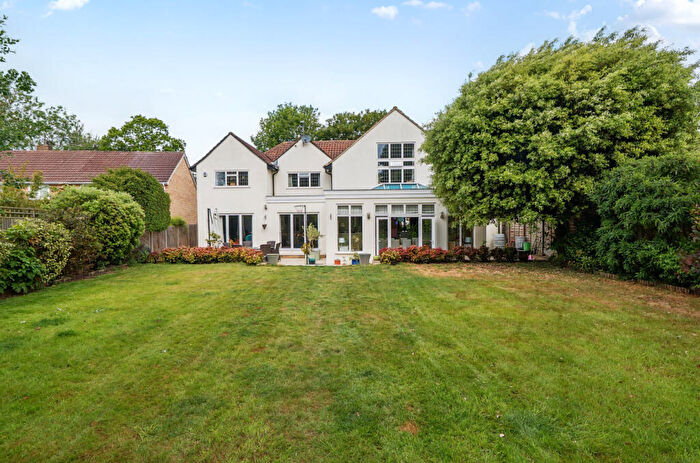
Properties for sale in Bromley

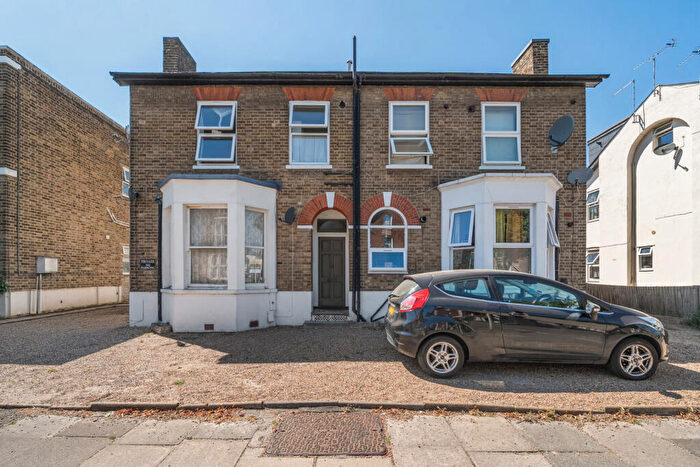
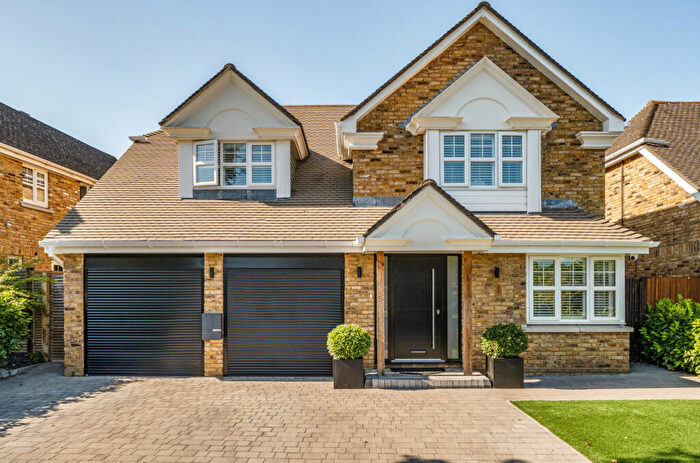
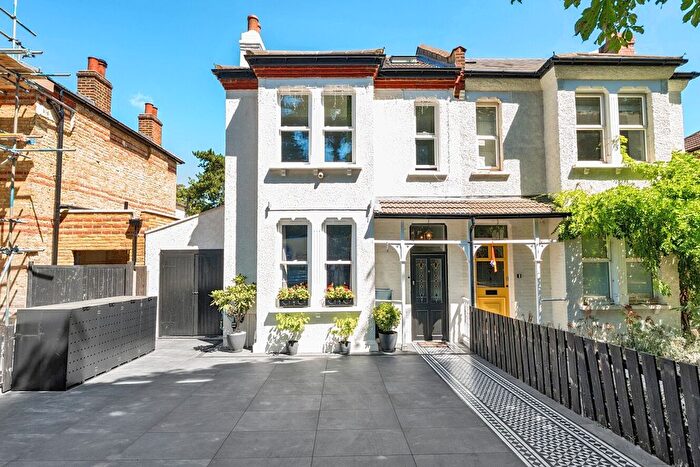


![]()
If you are looking to sell your house, let it out, or receive a property valuation, an expert can help you.
Click the button below to get started.


Neighbourhoods in Bromley
Navigate through our locations to find the location of your next house in Bromley, Bromley London Borough for sale or to rent.
Property price trends in Bromley
According to the latest Land Registry data, the average home in Bromley sold for £567,196 in 2026. That figure comes from a substantial record of 49,680 sales logged over the past 31 years.
Prices have moved up over the last three years. Compared with 2023, when the typical sale came in around £548,807, that's a rise of roughly 3.4%.
Looking back five years, average prices are up about 3.9% since 2021, a gain of around £21,125 in cash terms.
Zoom out to the past decade for the fuller picture. Back in 2016, homes here averaged £482,973, so the typical sold price has climbed about 17.4% since then, roughly 1.6% a year. Stretch the view to fifteen years and that annual pace edges up closer to 3.6%.
Frequently asked questions about Bromley
What is the average price for a property for sale in Bromley?
The average price for a property for sale in Bromley is £563,022. This amount is 2% lower than the average price in Bromley London Borough. There are more than 10,000 property listings for sale in Bromley.
What locations have the most expensive properties for sale in Bromley?
The locations with the most expensive properties for sale in Bromley are Bickley at an average of £700,979, Hayes And Coney Hall at an average of £667,514 and Shortlands at an average of £578,483.
What locations have the most affordable properties for sale in Bromley?
The locations with the most affordable properties for sale in Bromley are Bromley Town at an average of £497,609, Copers Cope at an average of £501,138 and Plaistow And Sundridge at an average of £509,329.
Which train stations are available in or near Bromley?
Some of the train stations available in or near Bromley are Bromley South, Bromley North and Bickley.
Property Price Paid in Bromley by Year
The average sold property price by year was:
| Year | Average Sold Price | Price Change |
Sold Properties
|
|---|---|---|---|
| 2026 | £567,196 | 1% |
59 Properties |
| 2025 | £563,410 | -2% |
1,090 Properties |
| 2024 | £573,548 | 4% |
1,202 Properties |
| 2023 | £548,807 | -5% |
937 Properties |
| 2022 | £574,933 | 5% |
1,413 Properties |
| 2021 | £546,071 | 3% |
1,815 Properties |
| 2020 | £529,558 | 7% |
1,236 Properties |
| 2019 | £490,169 | -3% |
1,347 Properties |
| 2018 | £504,091 | 0,2% |
1,271 Properties |
| 2017 | £502,952 | 4% |
1,359 Properties |
Property Price per Property Type in Bromley
Here you can find historic sold price data in order to help with your property search.
The average Property Paid Price for specific property types in the last three years are:
| Property Type | Average Sold Price | Sold Properties |
|---|---|---|
| Semi Detached House | £669,959.00 | 857 Semi Detached Houses |
| Terraced House | £522,952.00 | 788 Terraced Houses |
| Detached House | £1,002,721.00 | 464 Detached Houses |
| Flat | £339,028.00 | 1,179 Flats |
Transport in Bromley
Please see below transportation links in this area:
