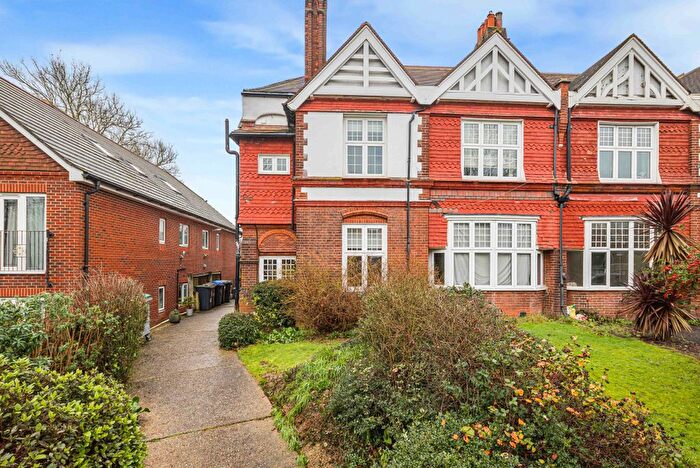
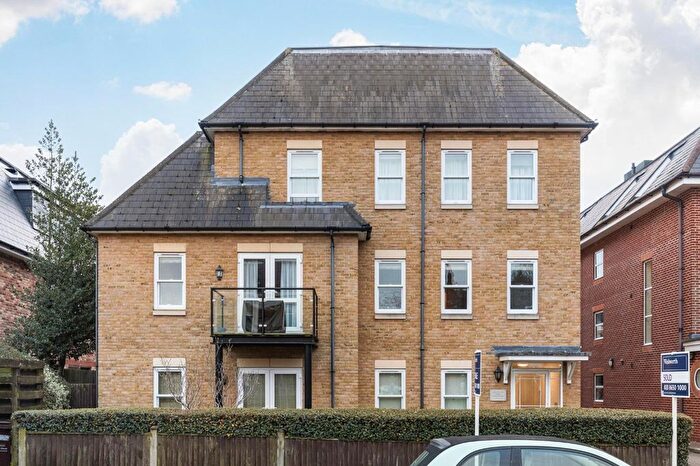
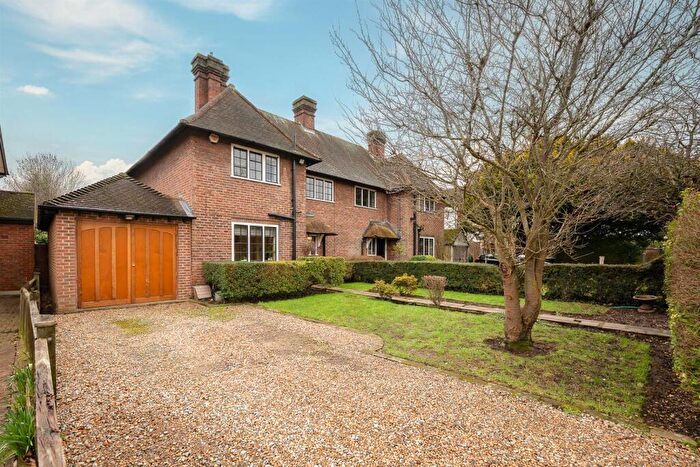
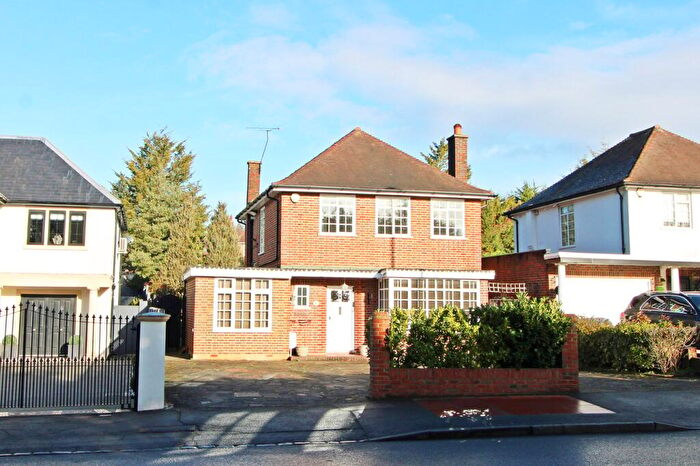
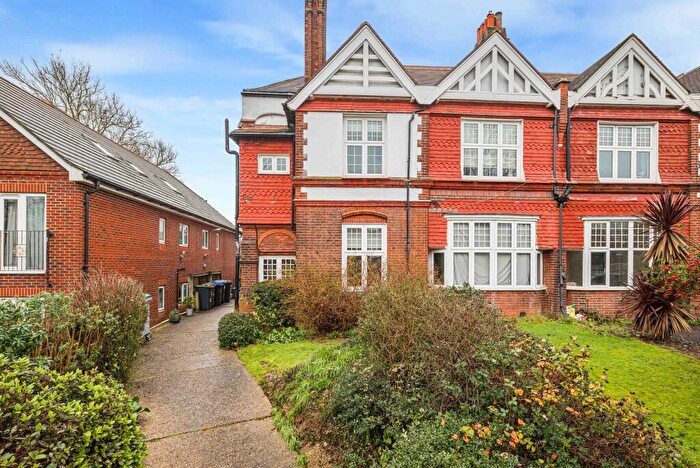
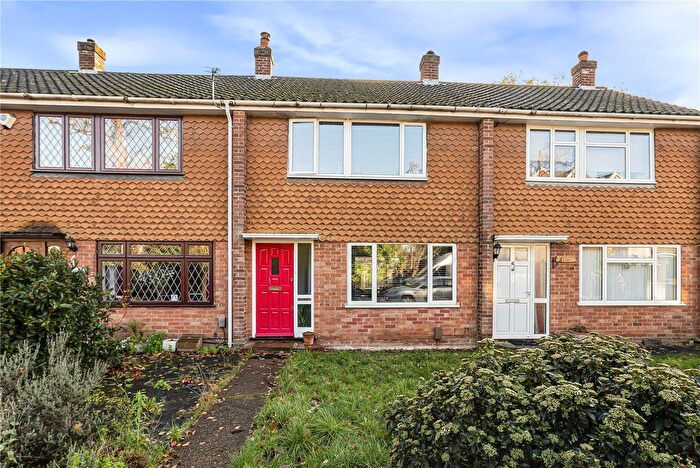
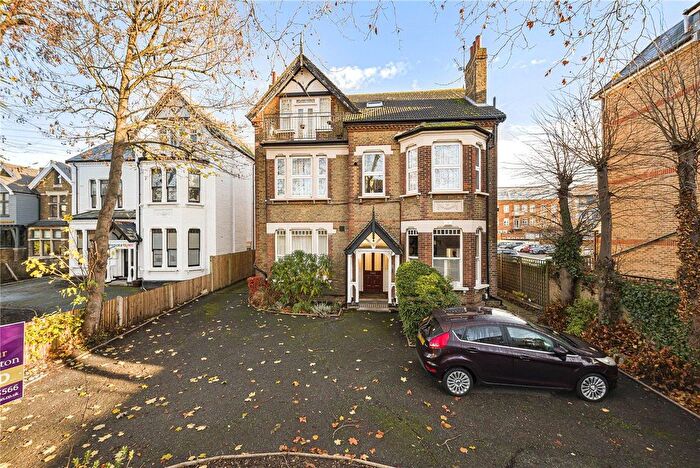
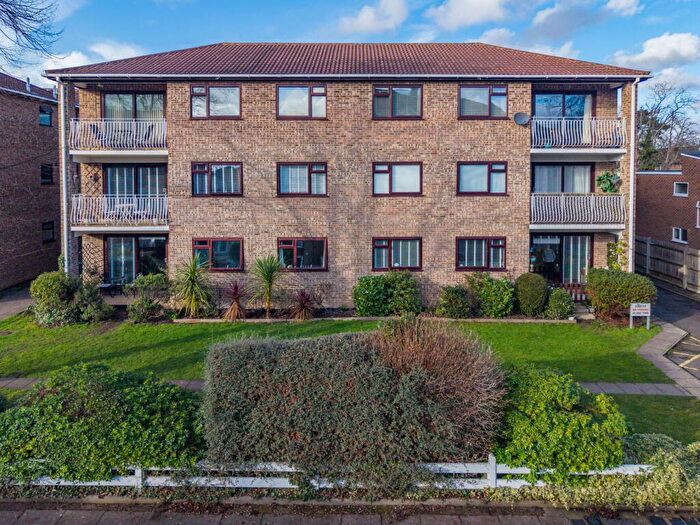
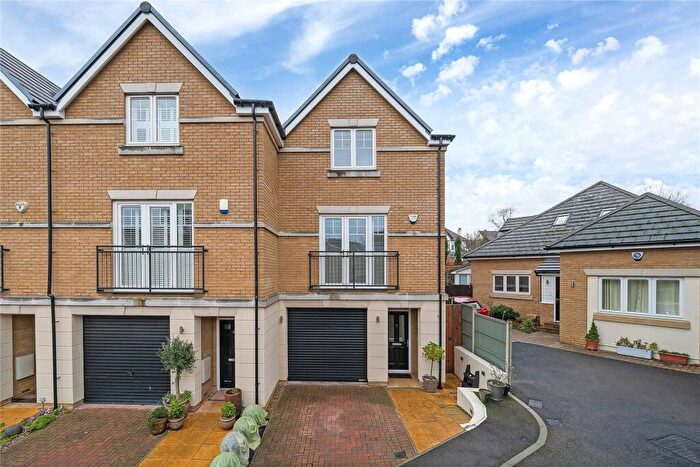
Houses for sale & to rent in Copers Cope, Bromley
House Prices in Copers Cope
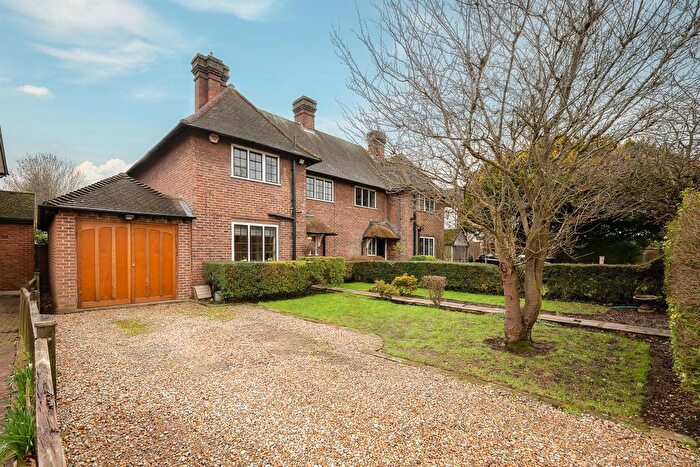
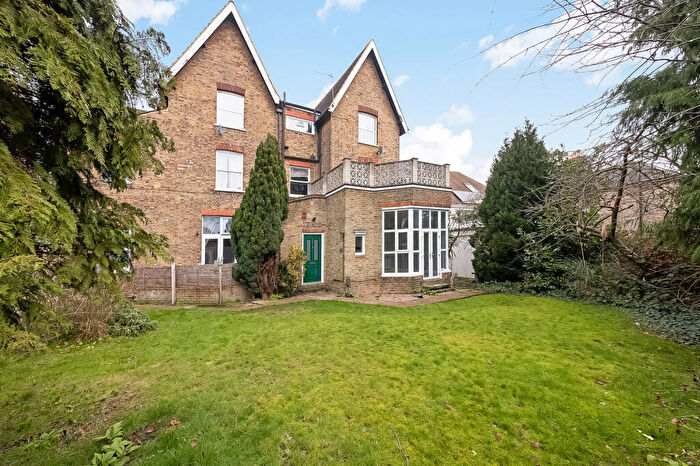
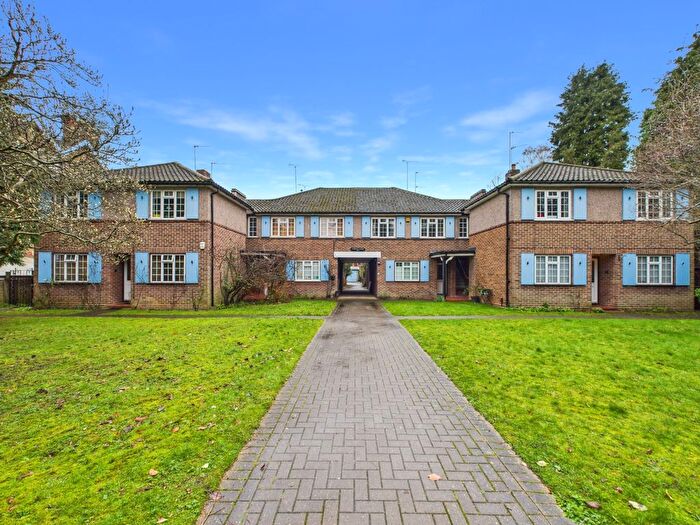
Properties in this part of Copers Cope within Bromley have an average house price of £502,497.00 and had 102 Property Transactions within the last 3 years¹. This area has 927 households² , where the most expensive property was sold for £2,650,000.00.
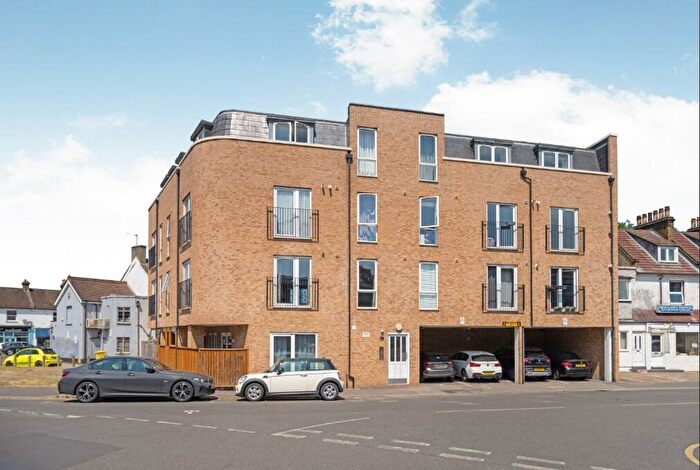
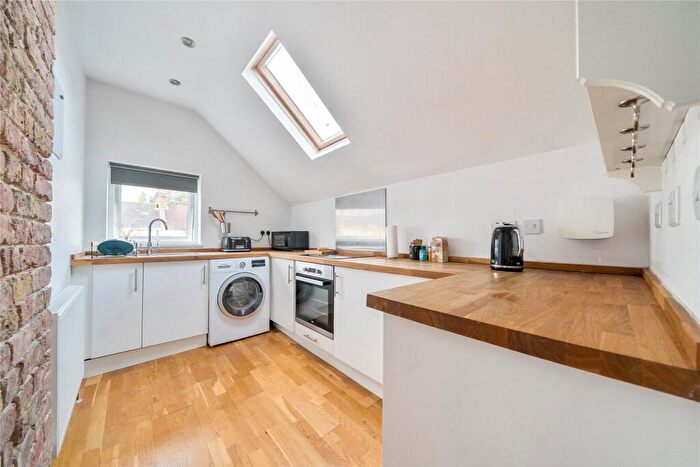
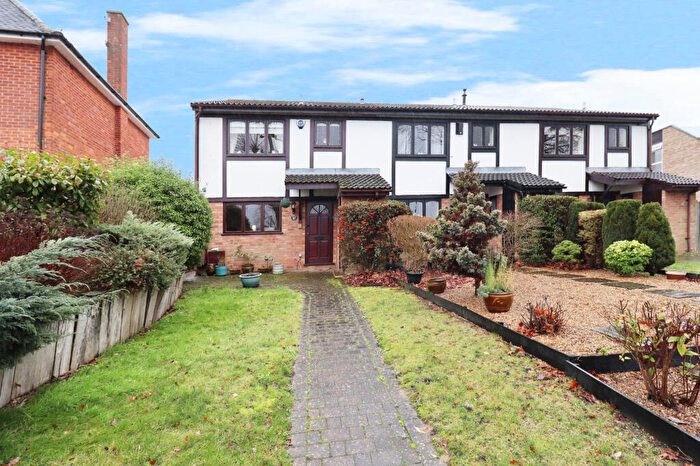
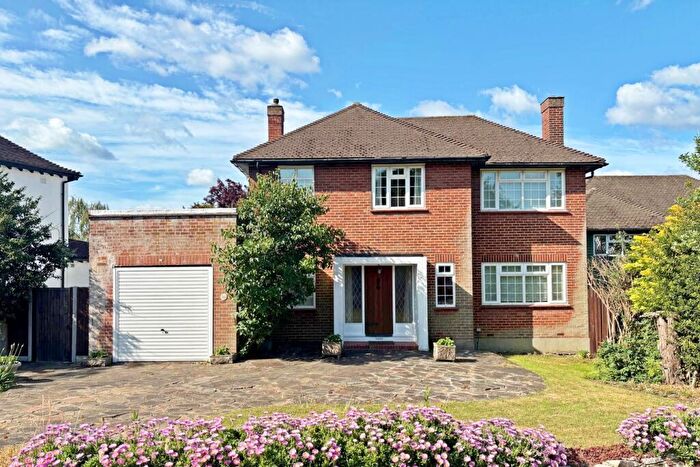
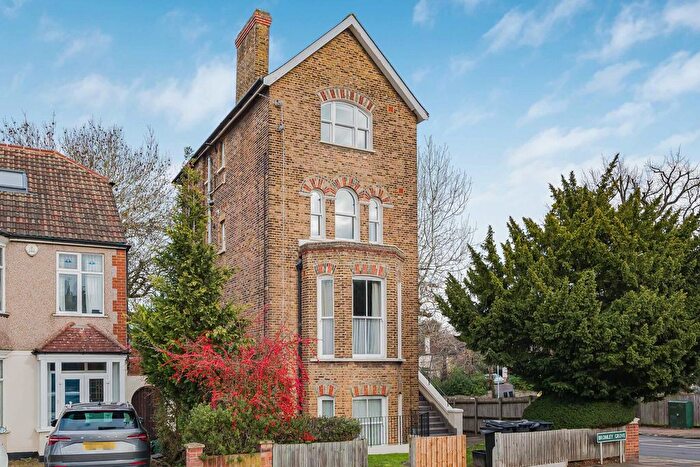
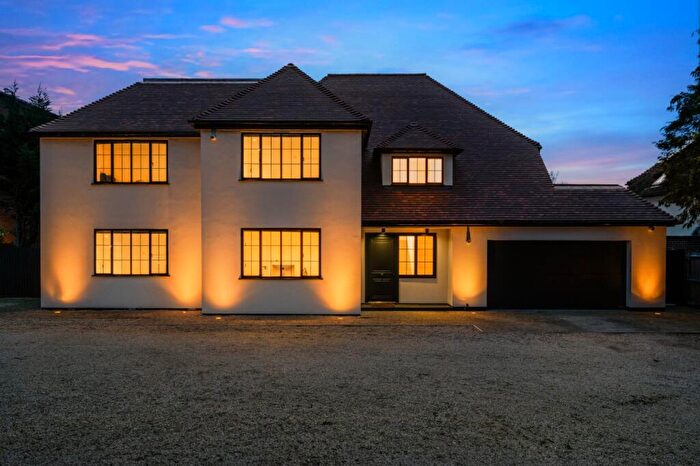
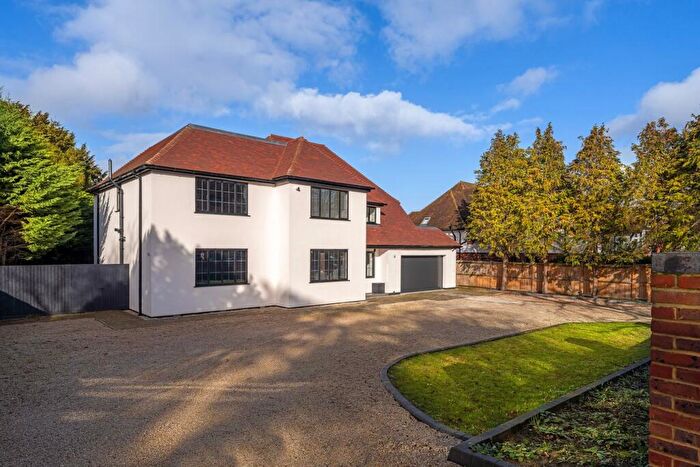
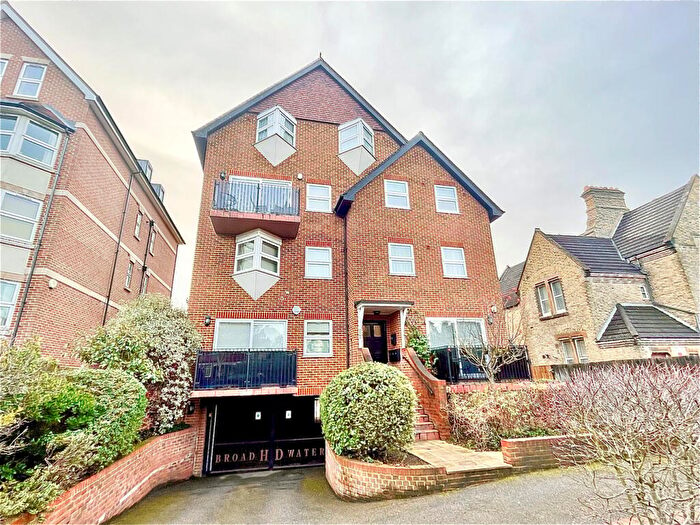
Properties for sale in Copers Cope
Roads and Postcodes in Copers Cope
Navigate through our locations to find the location of your next house in Copers Cope, Bromley for sale or to rent.
| Streets | Postcodes |
|---|---|
| Beckenham Grove | BR2 0JN BR2 0JT BR2 0JU BR2 0JW BR2 0JY BR2 0JZ BR2 0NA BR2 0XA BR2 0XB BR2 0XL BR2 0XN BR2 0XS BR2 0XU BR2 0NU |
| Bromley Grove | BR2 0LN BR2 0LP BR2 0LW |
| Bromley Road | BR2 0AA BR2 0AB BR2 0AD BR2 0AE BR2 0AG BR2 0AH BR2 0AJ BR2 0AL BR2 0AQ BR2 0AW BR2 0BL BR2 0BN BR2 0BW BR2 0AN BR2 0BS |
| Ferguson Close | BR2 0LY |
| Hildenlea Place | BR2 0YH |
| Oakway | BR2 0LJ |
| Oates Close | BR2 0WA |
| Park Hill Road | BR2 0JX BR2 0LB BR2 0LE BR2 0LF BR2 0XG BR2 0XQ |
| Scotts Avenue | BR2 0LG BR2 0LQ BR2 0NB |
| Scotts Lane | BR2 0LD BR2 0LH BR2 0LL BR2 0LT BR2 0LU BR2 0LX |
| Shortlands Grove | BR2 0LR BR2 0LS BR2 0ND |
Transport near Copers Cope
-
Shortlands Station
-
Ravensbourne Station
-
Bromley North Station
-
Bromley South Station
-
Beckenham Junction Station
-
Sundridge Park Station
-
Eden Park Station
-
Beckenham Hill Station
-
New Beckenham Station
-
Clock House Station
- FAQ
- Price Paid By Year
- Property Type Price
Frequently asked questions about Copers Cope
What is the average price for a property for sale in Copers Cope?
The average price for a property for sale in Copers Cope is £502,497. This amount is 11% lower than the average price in Bromley. There are 1,968 property listings for sale in Copers Cope.
What streets have the most expensive properties for sale in Copers Cope?
The streets with the most expensive properties for sale in Copers Cope are Oates Close at an average of £1,425,000, Oakway at an average of £1,129,000 and Scotts Lane at an average of £1,017,730.
What streets have the most affordable properties for sale in Copers Cope?
The streets with the most affordable properties for sale in Copers Cope are Bromley Road at an average of £280,295, Beckenham Grove at an average of £321,250 and Park Hill Road at an average of £366,022.
Which train stations are available in or near Copers Cope?
Some of the train stations available in or near Copers Cope are Shortlands, Ravensbourne and Bromley North.
Property Price Paid in Copers Cope by Year
The average sold property price by year was:
| Year | Average Sold Price | Price Change |
Sold Properties
|
|---|---|---|---|
| 2025 | £469,628 | -18% |
35 Properties |
| 2024 | £556,506 | 16% |
40 Properties |
| 2023 | £465,092 | 9% |
27 Properties |
| 2022 | £420,911 | 1% |
51 Properties |
| 2021 | £417,433 | -6% |
45 Properties |
| 2020 | £441,862 | 8% |
40 Properties |
| 2019 | £407,692 | -10% |
39 Properties |
| 2018 | £448,129 | 4% |
34 Properties |
| 2017 | £429,580 | 11% |
42 Properties |
| 2016 | £381,580 | 3% |
36 Properties |
| 2015 | £371,128 | 12% |
38 Properties |
| 2014 | £327,749 | 6% |
64 Properties |
| 2013 | £309,326 | -6% |
41 Properties |
| 2012 | £328,984 | 26% |
50 Properties |
| 2011 | £244,844 | -6% |
62 Properties |
| 2010 | £260,004 | -3% |
43 Properties |
| 2009 | £268,446 | -13% |
32 Properties |
| 2008 | £302,156 | -0,2% |
40 Properties |
| 2007 | £302,772 | 16% |
63 Properties |
| 2006 | £254,513 | 7% |
75 Properties |
| 2005 | £237,097 | 5% |
50 Properties |
| 2004 | £224,927 | 3% |
87 Properties |
| 2003 | £218,211 | 25% |
54 Properties |
| 2002 | £164,033 | 5% |
65 Properties |
| 2001 | £155,566 | 16% |
60 Properties |
| 2000 | £130,748 | 10% |
77 Properties |
| 1999 | £117,033 | 16% |
68 Properties |
| 1998 | £98,001 | 17% |
71 Properties |
| 1997 | £81,537 | 8% |
89 Properties |
| 1996 | £74,680 | -18% |
56 Properties |
| 1995 | £87,907 | - |
40 Properties |
Property Price per Property Type in Copers Cope
Here you can find historic sold price data in order to help with your property search.
The average Property Paid Price for specific property types in the last three years are:
| Property Type | Average Sold Price | Sold Properties |
|---|---|---|
| Semi Detached House | £899,333.00 | 3 Semi Detached Houses |
| Detached House | £1,406,884.00 | 13 Detached Houses |
| Terraced House | £518,625.00 | 4 Terraced Houses |
| Flat | £343,814.00 | 82 Flats |

