
Houses for sale & to rent in Bromley Town, Bromley
House Prices in Bromley Town
Properties in this part of Bromley Town within Bromley have an average house price of £499k and had 771 Property Transactions within the last 3 years¹. This area has 7,326 households² , where the most expensive property was sold for £1.9M.
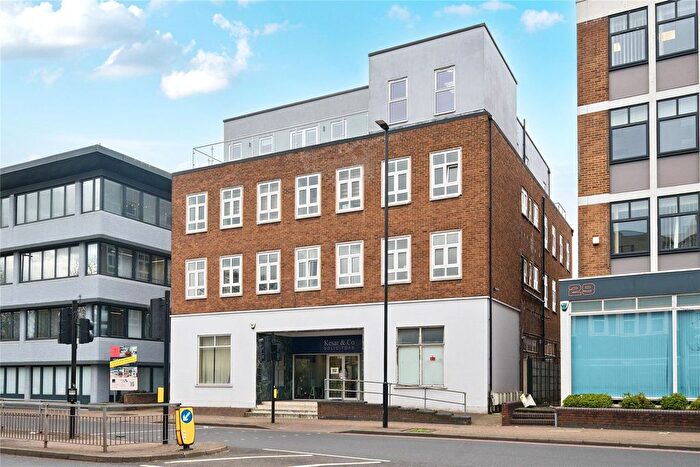
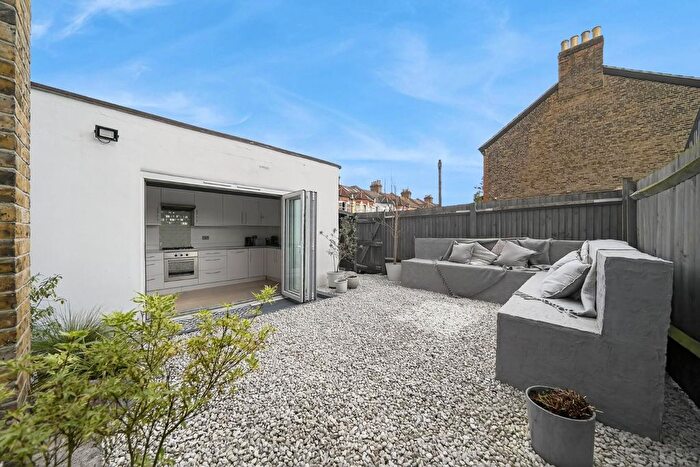
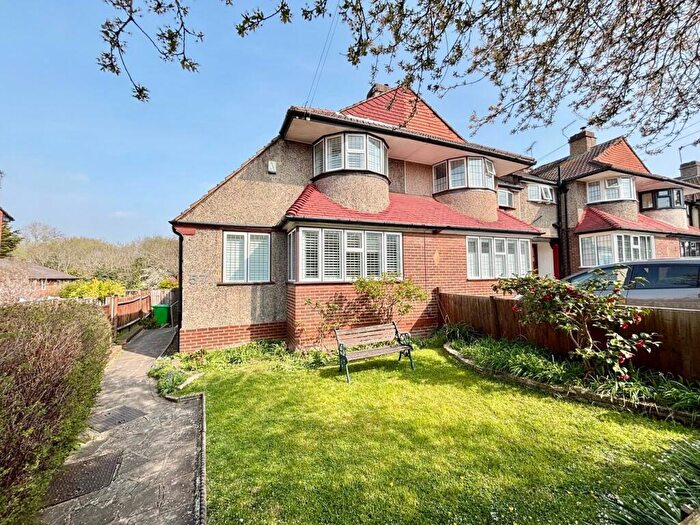
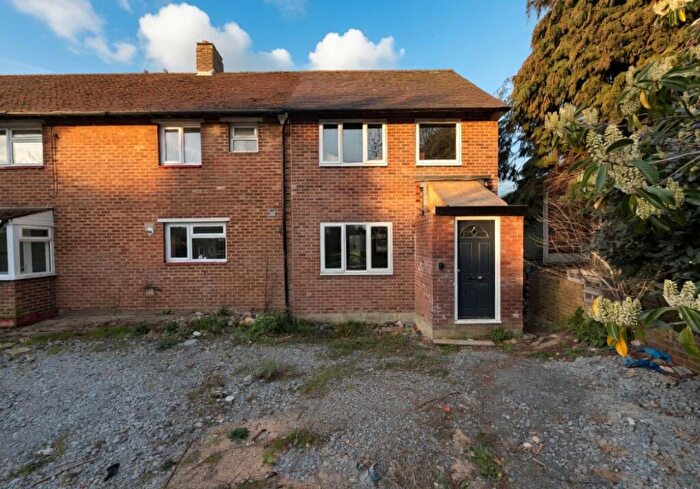
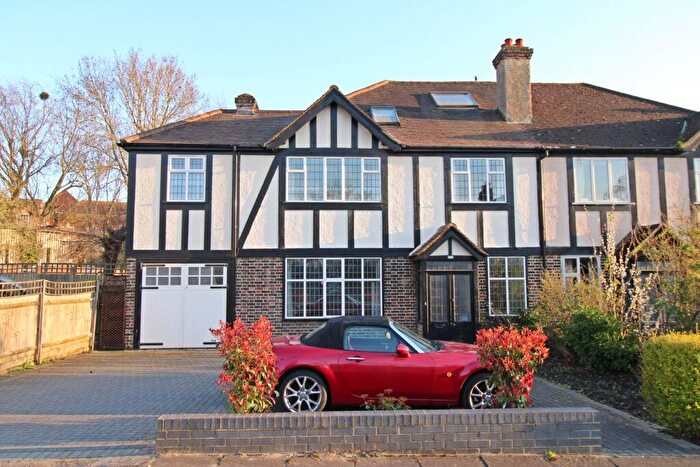
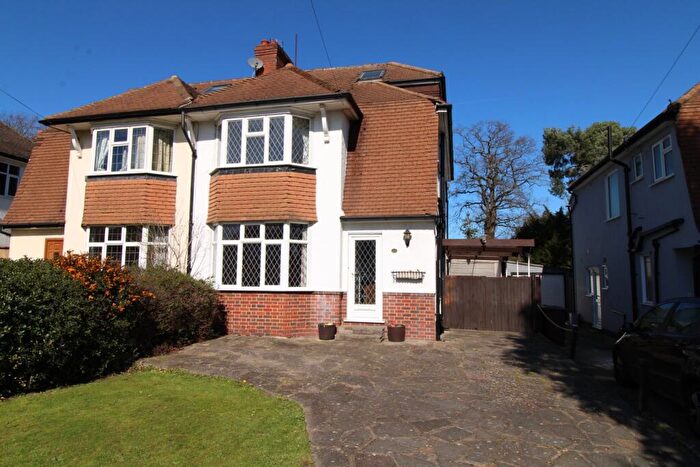
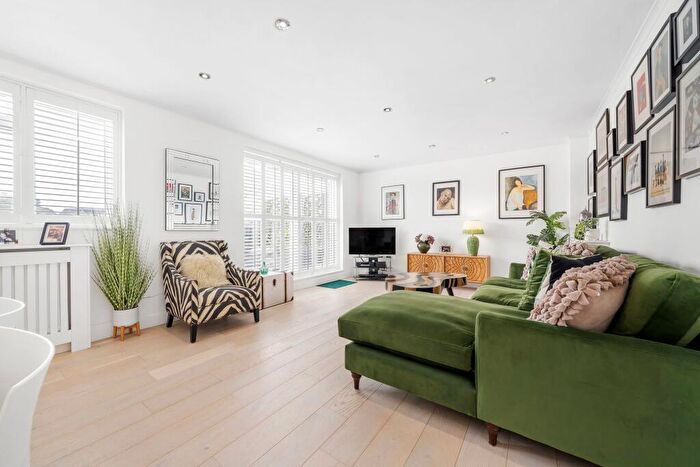
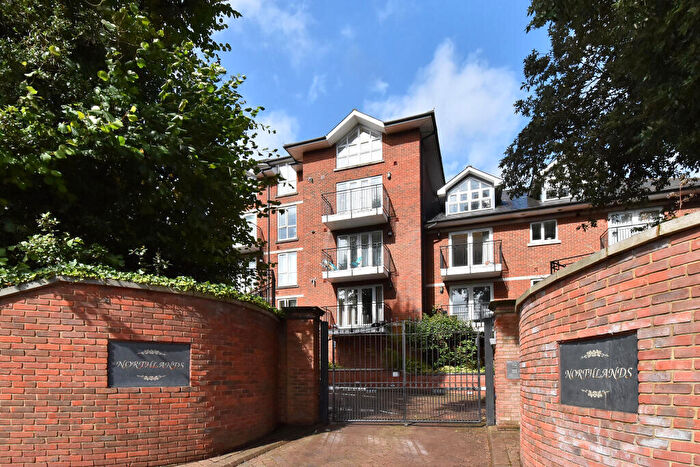
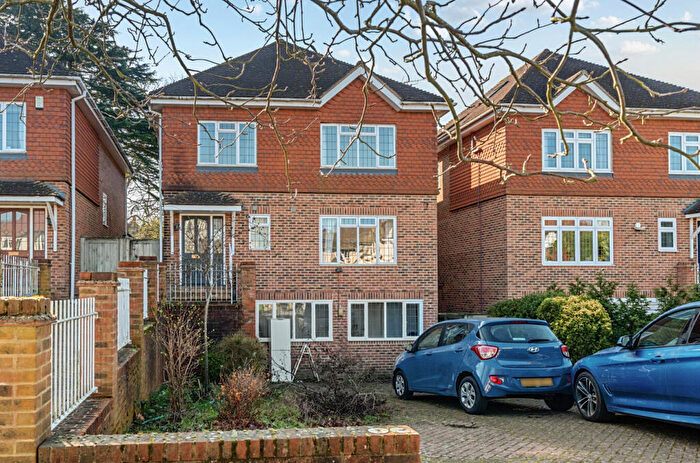
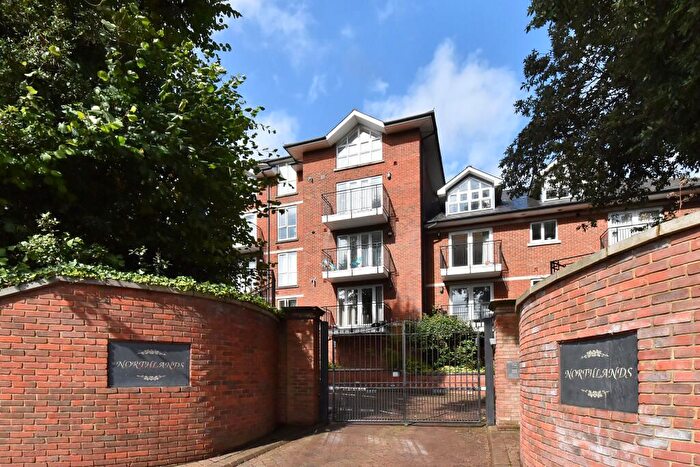
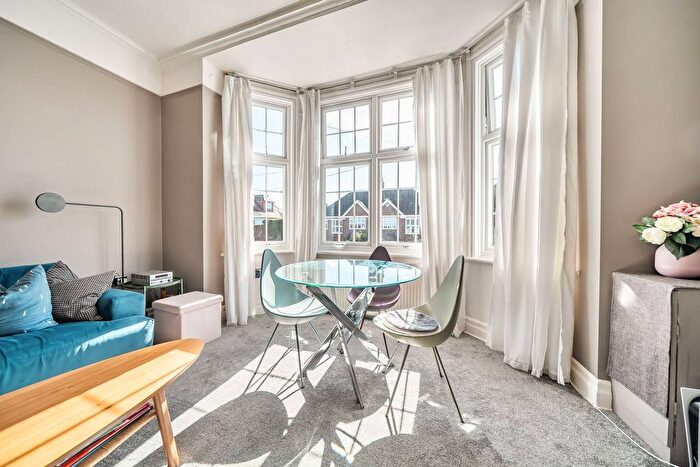
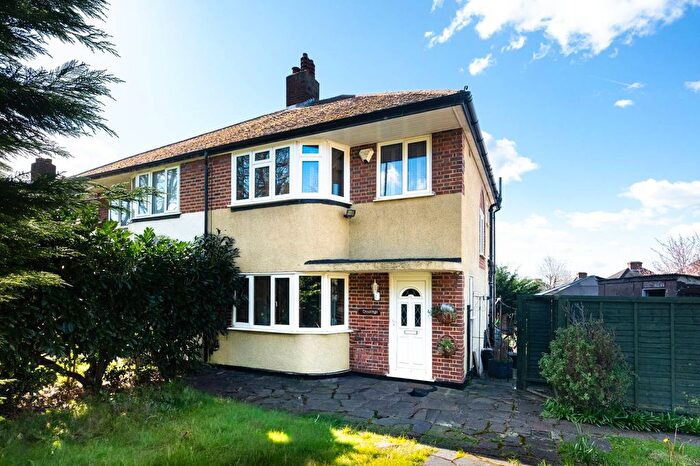
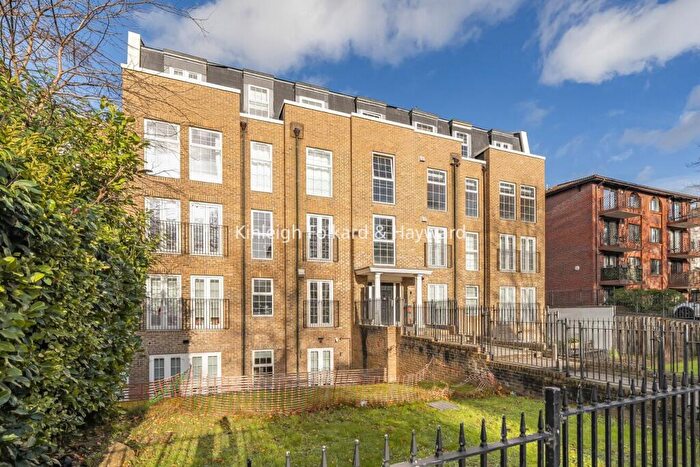
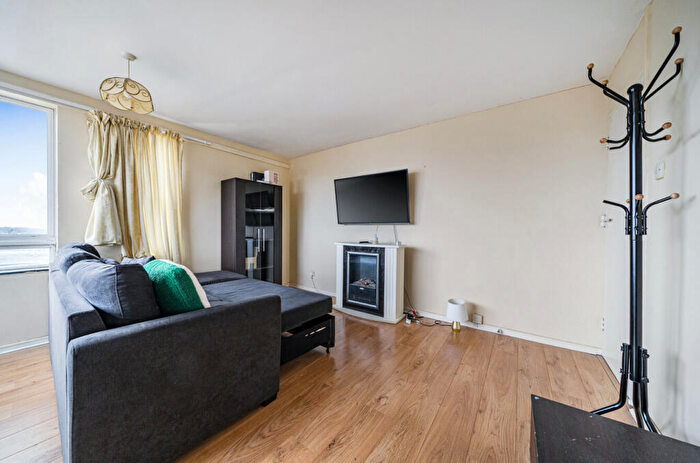
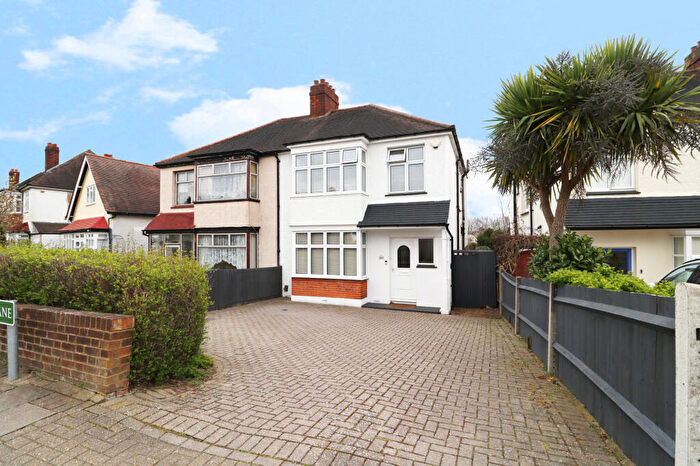
Properties for sale in Bromley Town

![]()
If you are looking to sell your house, let it out, or receive a property valuation, an expert can help you.
Click the button below to get started.
Roads and Postcodes in Bromley Town
Navigate through our locations to find the location of your next house in Bromley Town, Bromley for sale or to rent.
Transport near Bromley Town
-
 Bromley North Station
 -
Bromley South Station
-
Shortlands Station
-
Sundridge Park Station
-
Ravensbourne Station
-
Bickley Station
-
Elmstead Woods Station
-
Grove Park Station
-
Chislehurst Station
-
 Beckenham Junction Station
- FAQ
- Price Paid By Year
- Property Type Price
Frequently asked questions about Bromley Town
What is the average price for a property for sale in Bromley Town?
The average price for a property for sale in Bromley Town is £499,114. This amount is 11% lower than the average price in Bromley. There are 7,371 property listings for sale in Bromley Town.
What streets have the most expensive properties for sale in Bromley Town?
The streets with the most expensive properties for sale in Bromley Town are Stone Road at an average of £1,580,714, New Farm Avenue at an average of £1,340,000 and Westmoreland Road at an average of £1,170,000.
What streets have the most affordable properties for sale in Bromley Town?
The streets with the most affordable properties for sale in Bromley Town are Palace Grove at an average of £200,843, Elmfield Road at an average of £224,333 and North Street at an average of £259,400.
Which train stations are available in or near Bromley Town?
Some of the train stations available in or near Bromley Town are Bromley North, Bromley South and Shortlands.
Property Price Paid in Bromley Town by Year
The average sold property price by year was:
| Year | Average Sold Price | Price Change |
Sold Properties
|
|---|---|---|---|
| 2026 | £497,500 | -4% |
2 Properties |
| 2025 | £517,763 | 3% |
257 Properties |
| 2024 | £502,189 | 5% |
275 Properties |
| 2023 | £475,336 | -7% |
237 Properties |
| 2022 | £510,966 | 4% |
329 Properties |
| 2021 | £492,358 | 5% |
429 Properties |
| 2020 | £466,197 | 8% |
286 Properties |
| 2019 | £427,045 | 1% |
364 Properties |
| 2018 | £422,222 | -9% |
303 Properties |
| 2017 | £458,894 | 11% |
347 Properties |
| 2016 | £407,951 | 10% |
367 Properties |
| 2015 | £365,541 | 1% |
495 Properties |
| 2014 | £361,495 | 16% |
372 Properties |
| 2013 | £302,138 | 0,1% |
335 Properties |
| 2012 | £301,935 | 2% |
335 Properties |
| 2011 | £294,678 | -0,1% |
306 Properties |
| 2010 | £295,106 | 12% |
282 Properties |
| 2009 | £260,799 | -9% |
253 Properties |
| 2008 | £284,125 | -1% |
262 Properties |
| 2007 | £285,597 | 6% |
558 Properties |
| 2006 | £267,993 | 9% |
572 Properties |
| 2005 | £243,709 | -1% |
480 Properties |
| 2004 | £247,067 | 10% |
578 Properties |
| 2003 | £223,142 | 10% |
420 Properties |
| 2002 | £200,783 | 12% |
538 Properties |
| 2001 | £176,787 | 10% |
463 Properties |
| 2000 | £158,275 | 16% |
415 Properties |
| 1999 | £132,241 | 20% |
495 Properties |
| 1998 | £105,977 | 12% |
384 Properties |
| 1997 | £93,307 | 4% |
409 Properties |
| 1996 | £89,413 | -6% |
421 Properties |
| 1995 | £94,448 | - |
237 Properties |
Property Price per Property Type in Bromley Town
Here you can find historic sold price data in order to help with your property search.
The average Property Paid Price for specific property types in the last three years are:
| Property Type | Average Sold Price | Sold Properties |
|---|---|---|
| Semi Detached House | £672,827.00 | 155 Semi Detached Houses |
| Detached House | £964,082.00 | 58 Detached Houses |
| Terraced House | £558,863.00 | 185 Terraced Houses |
| Flat | £324,992.00 | 373 Flats |