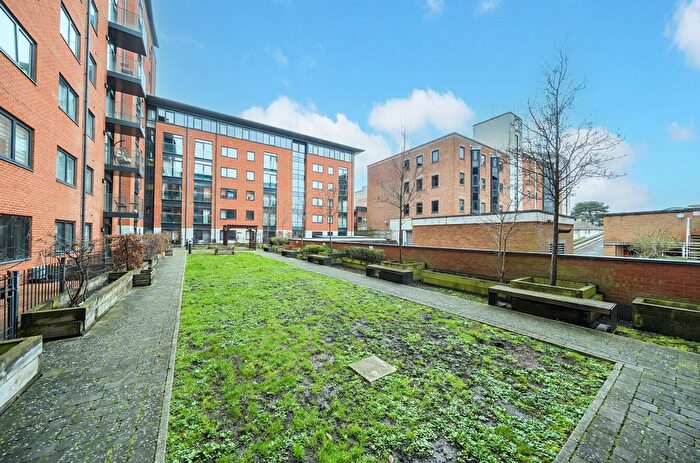
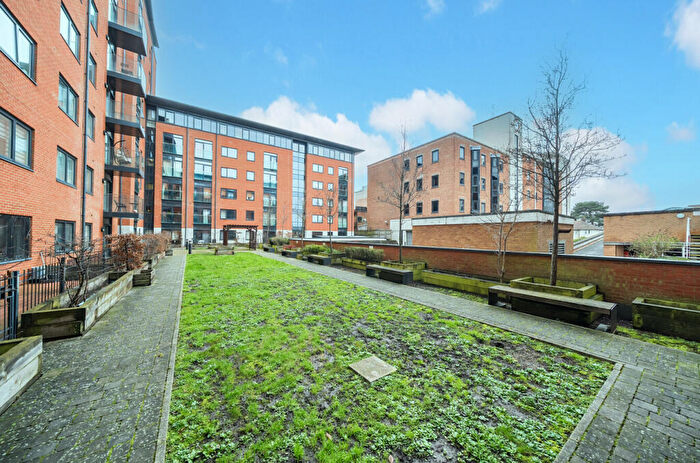
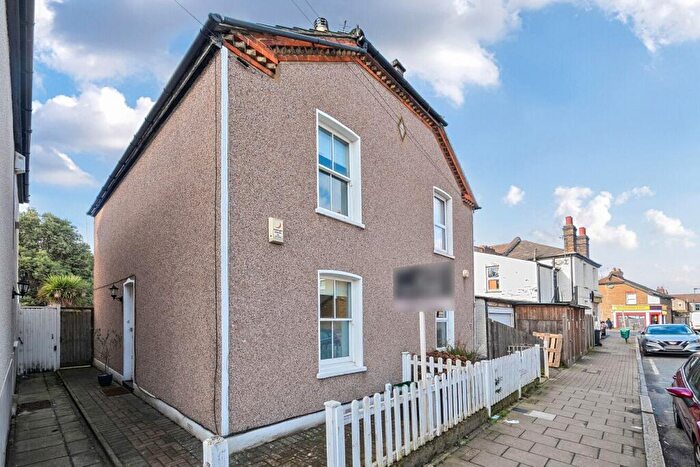
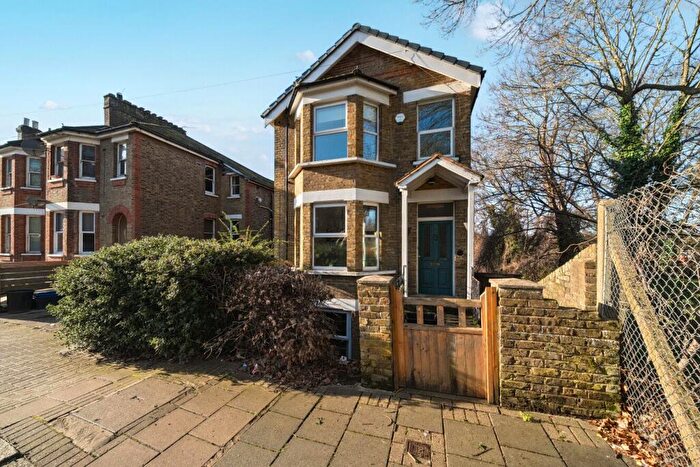
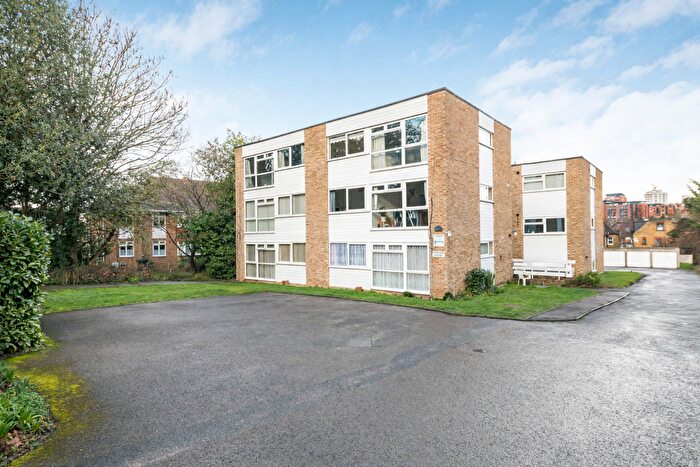
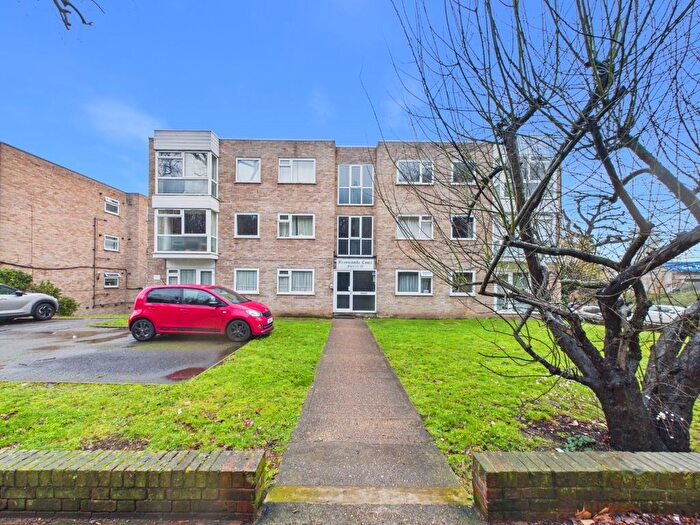
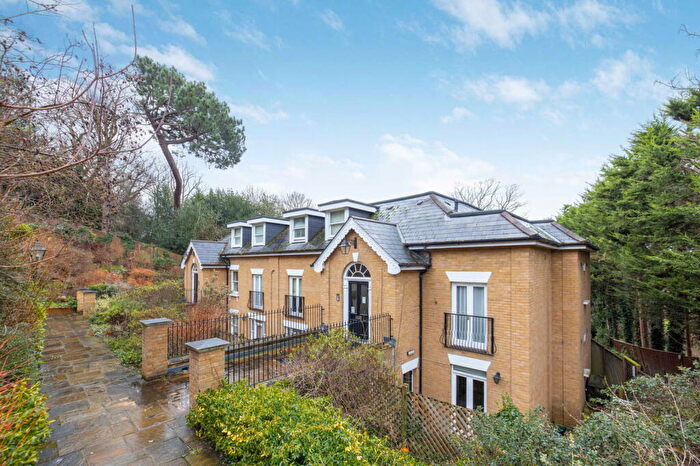
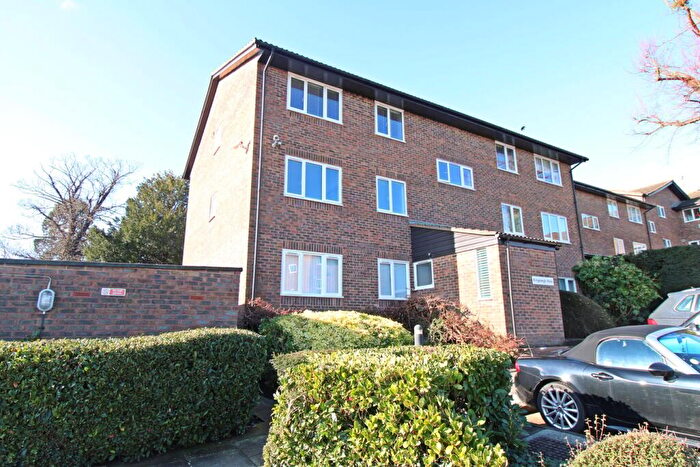
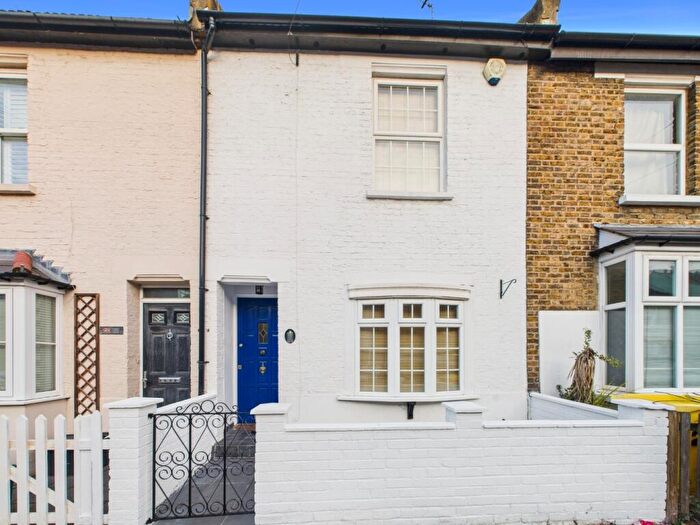
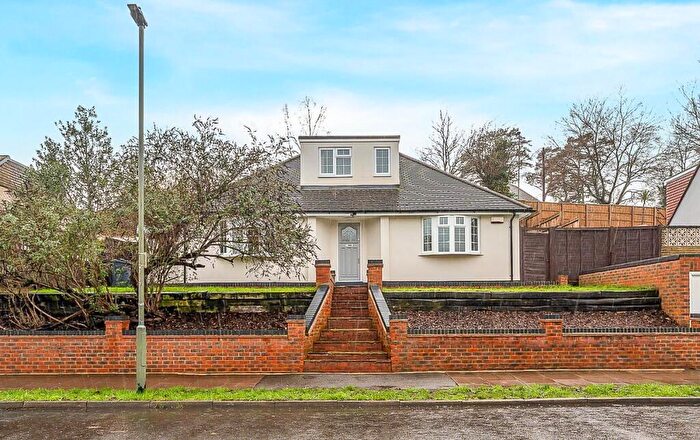
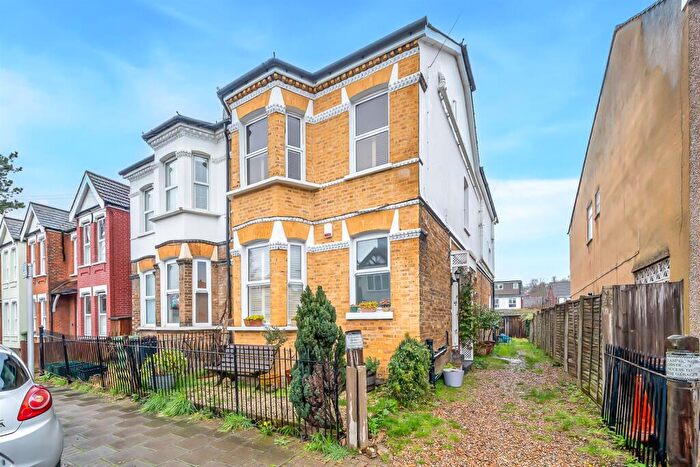
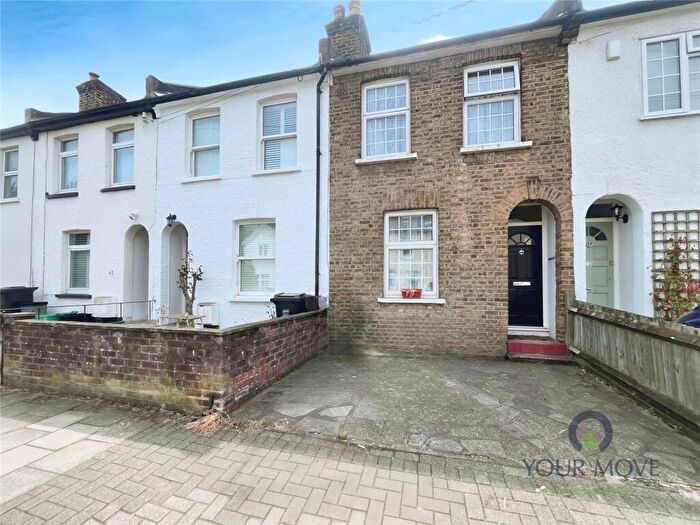
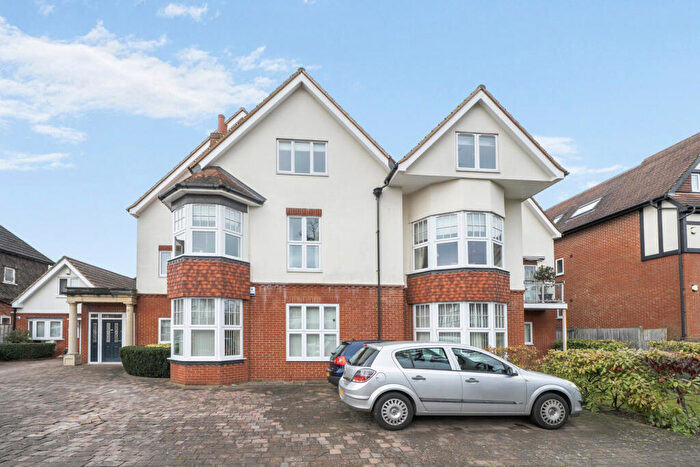
Houses for sale & to rent in Shortlands, Bromley
House Prices in Shortlands
Properties in this part of Shortlands within Bromley have an average house price of £566,661.00 and had 270 Property Transactions within the last 3 years¹. This area has 3,211 households² , where the most expensive property was sold for £2,075,000.00.
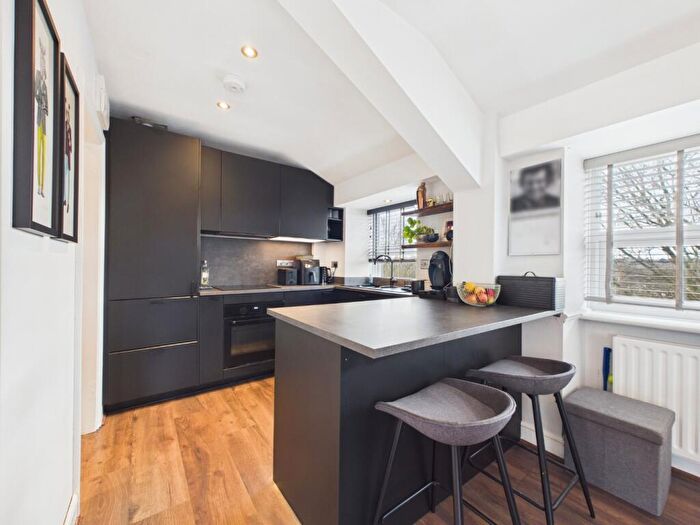
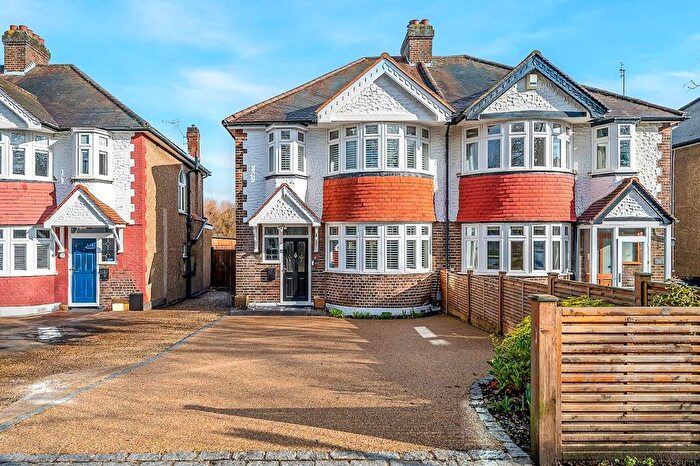
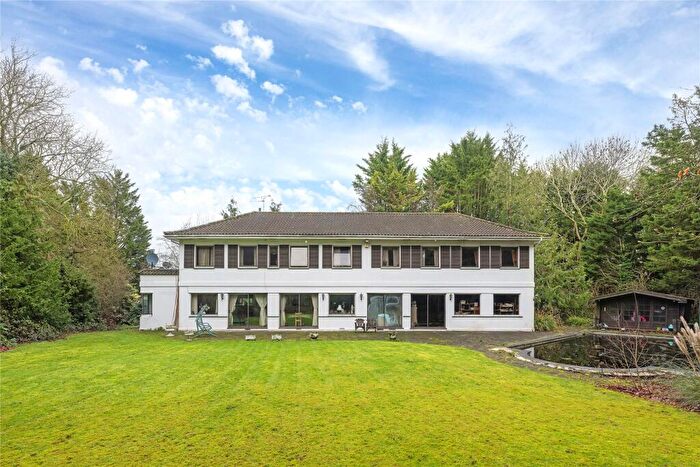
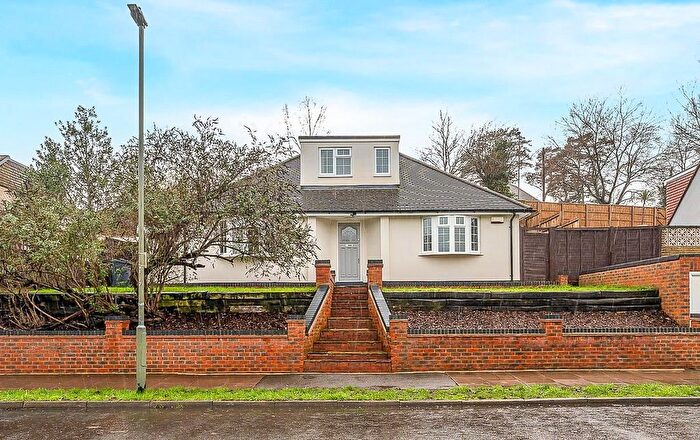
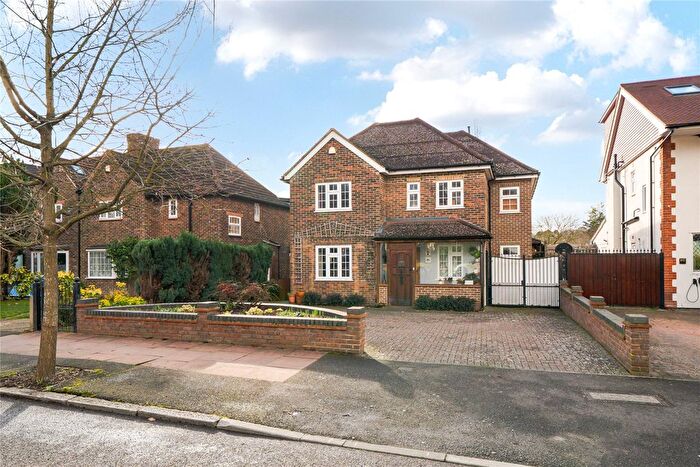
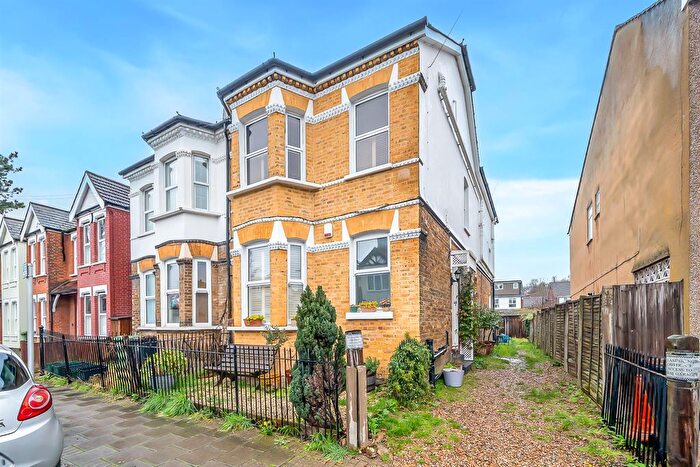
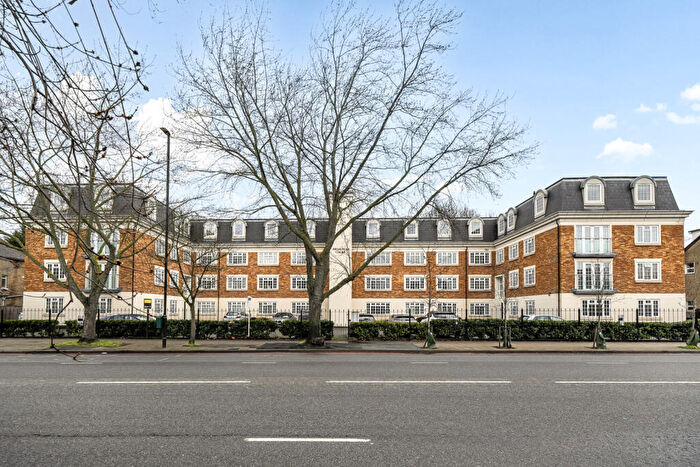
Properties for sale in Shortlands
Roads and Postcodes in Shortlands
Navigate through our locations to find the location of your next house in Shortlands, Bromley for sale or to rent.
Transport near Shortlands
-
Shortlands Station
-
Bromley South Station
-
Bromley North Station
-
Ravensbourne Station
-
Sundridge Park Station
-
Eden Park Station
-
West Wickham Station
-
Beckenham Junction Station
-
Hayes (Kent) Station
-
Hayes Station
- FAQ
- Price Paid By Year
- Property Type Price
Frequently asked questions about Shortlands
What is the average price for a property for sale in Shortlands?
The average price for a property for sale in Shortlands is £566,661. This amount is 0.86% higher than the average price in Bromley. There are 1,929 property listings for sale in Shortlands.
What streets have the most expensive properties for sale in Shortlands?
The streets with the most expensive properties for sale in Shortlands are Den Road at an average of £1,375,000, Pellings Close at an average of £1,200,000 and Tootswood Road at an average of £1,190,000.
What streets have the most affordable properties for sale in Shortlands?
The streets with the most affordable properties for sale in Shortlands are Tavistock Road at an average of £240,000, Kingsleigh Walk at an average of £286,900 and Durham Avenue at an average of £337,381.
Which train stations are available in or near Shortlands?
Some of the train stations available in or near Shortlands are Shortlands, Bromley South and Bromley North.
Property Price Paid in Shortlands by Year
The average sold property price by year was:
| Year | Average Sold Price | Price Change |
Sold Properties
|
|---|---|---|---|
| 2025 | £598,801 | 6% |
87 Properties |
| 2024 | £564,620 | 5% |
103 Properties |
| 2023 | £534,339 | -0,4% |
80 Properties |
| 2022 | £536,585 | 0,4% |
146 Properties |
| 2021 | £534,472 | -9% |
176 Properties |
| 2020 | £580,732 | 10% |
94 Properties |
| 2019 | £524,869 | -6% |
127 Properties |
| 2018 | £557,610 | 1% |
127 Properties |
| 2017 | £551,812 | 16% |
117 Properties |
| 2016 | £466,083 | 6% |
125 Properties |
| 2015 | £437,486 | 2% |
146 Properties |
| 2014 | £430,225 | 18% |
138 Properties |
| 2013 | £354,874 | 12% |
142 Properties |
| 2012 | £313,120 | -8% |
125 Properties |
| 2011 | £338,116 | 0,2% |
144 Properties |
| 2010 | £337,313 | 12% |
126 Properties |
| 2009 | £296,025 | -2% |
112 Properties |
| 2008 | £300,765 | -2% |
107 Properties |
| 2007 | £305,662 | 9% |
209 Properties |
| 2006 | £278,819 | 2% |
235 Properties |
| 2005 | £274,064 | -1% |
176 Properties |
| 2004 | £275,499 | 11% |
204 Properties |
| 2003 | £246,185 | 13% |
183 Properties |
| 2002 | £214,296 | 13% |
201 Properties |
| 2001 | £187,358 | 6% |
208 Properties |
| 2000 | £175,640 | 16% |
181 Properties |
| 1999 | £148,009 | 17% |
231 Properties |
| 1998 | £122,484 | 10% |
223 Properties |
| 1997 | £110,422 | 8% |
218 Properties |
| 1996 | £101,168 | 1% |
170 Properties |
| 1995 | £100,109 | - |
108 Properties |
Property Price per Property Type in Shortlands
Here you can find historic sold price data in order to help with your property search.
The average Property Paid Price for specific property types in the last three years are:
| Property Type | Average Sold Price | Sold Properties |
|---|---|---|
| Semi Detached House | £807,812.00 | 51 Semi Detached Houses |
| Detached House | £951,314.00 | 45 Detached Houses |
| Terraced House | £582,307.00 | 39 Terraced Houses |
| Flat | £342,823.00 | 135 Flats |

