
Houses for sale in Aylesbury, Buckinghamshire
House Prices in Aylesbury
Properties in Aylesbury have an average house price of £405k and had 5,570 Property Transactions within the last 3 years.¹
Aylesbury is an area in Buckinghamshire with 57,001 households², where the most expensive property was sold for £3M.
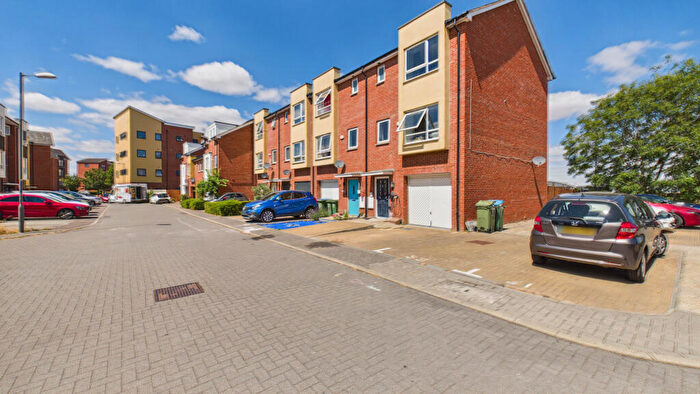
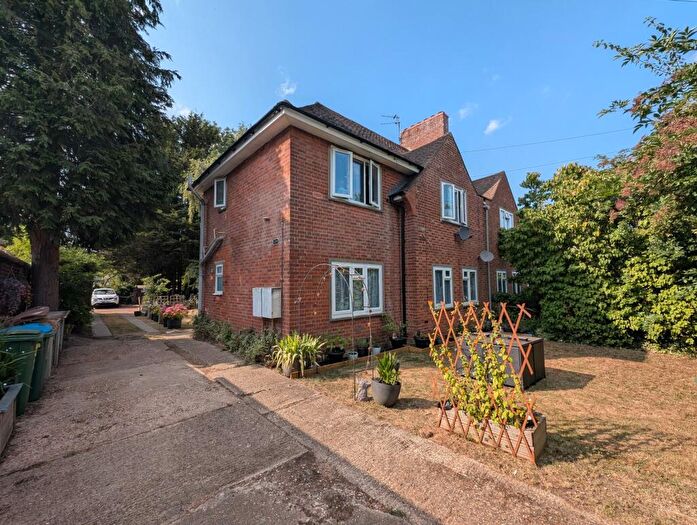
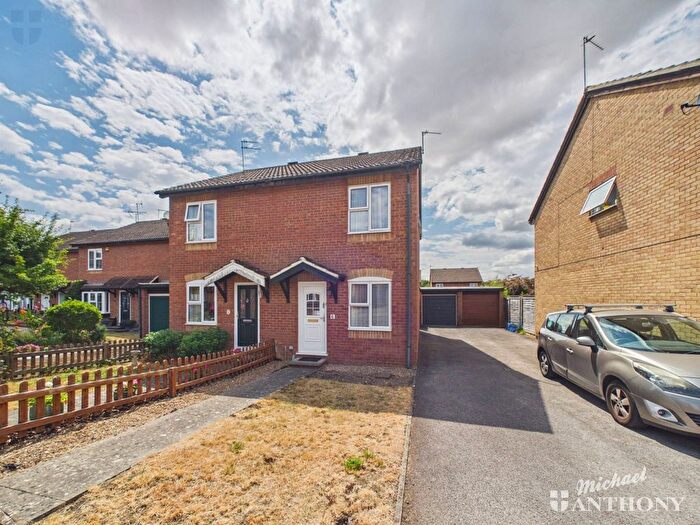
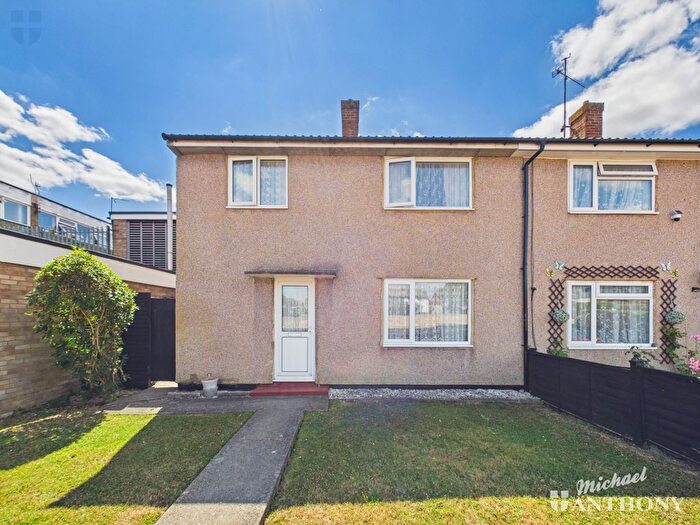
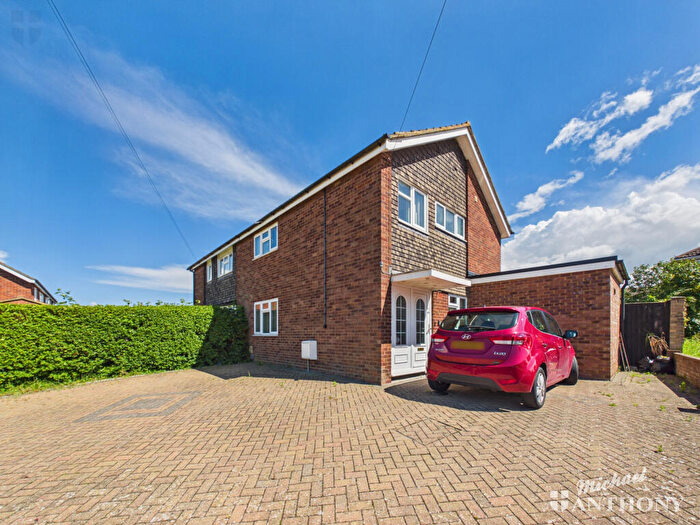
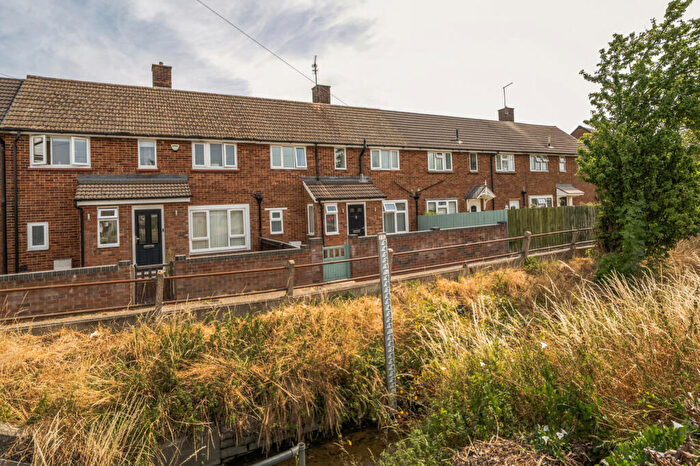
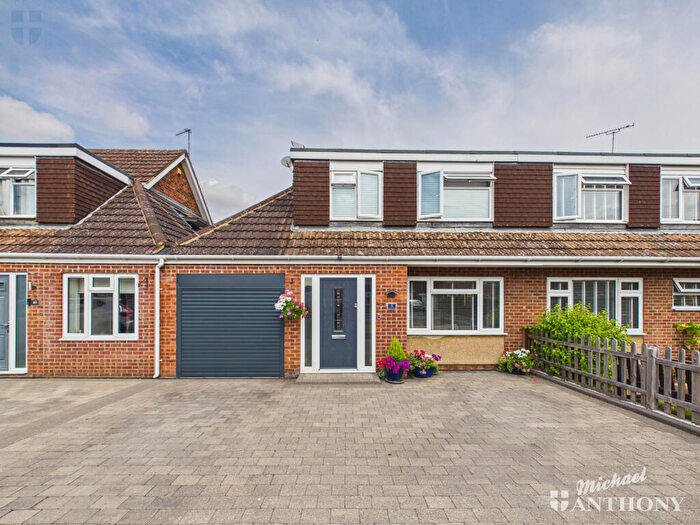
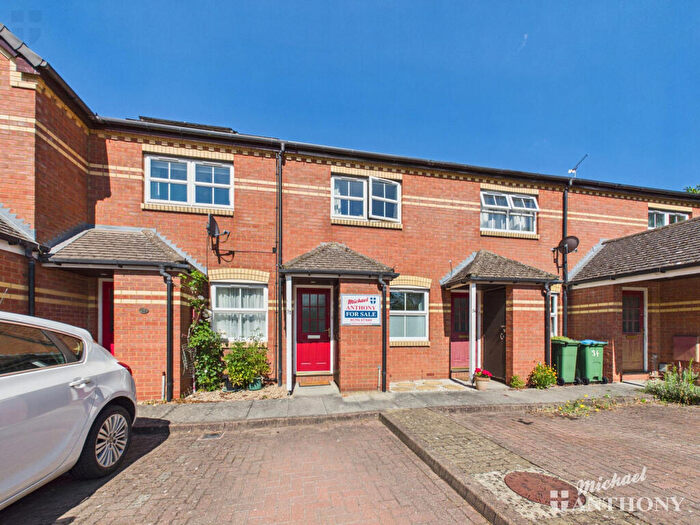
Properties for sale in Aylesbury
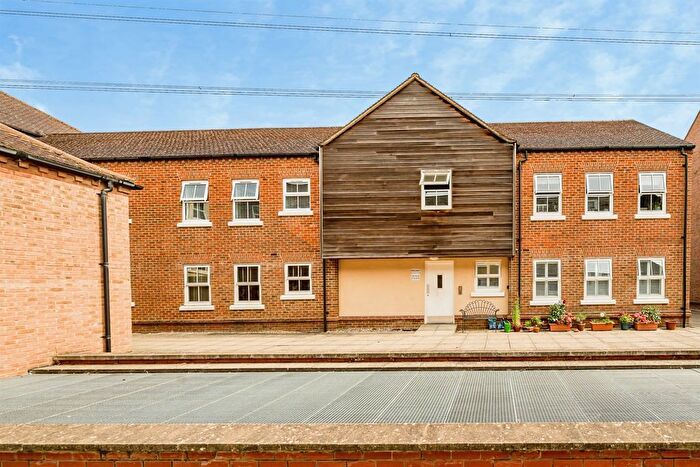
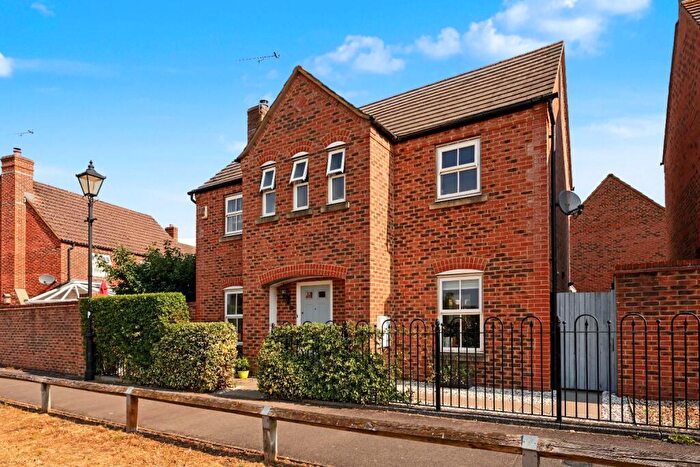
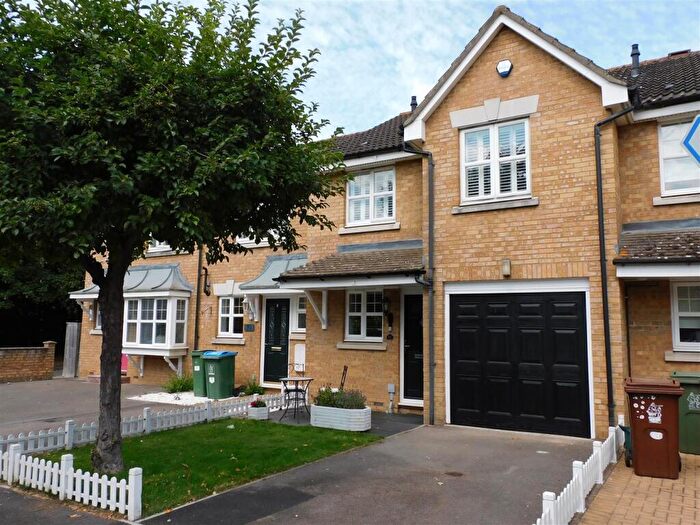
![]()
If you are looking to sell your house, let it out, or receive a property valuation, an expert can help you.
Click the button below to get started.

Neighbourhoods in Aylesbury
Navigate through our locations to find the location of your next house in Aylesbury, Buckinghamshire for sale or to rent.
- Aston Clinton
- Aylesbury Central
- Bedgrove
- Bierton
- Brill
- Coldharbour
- Elmhurst And Watermead
- Gatehouse
- Grendon Underwood
- Haddenham
- Long Crendon
- Mandeville And Elm Farm
- Oakfield
- Quainton
- Quarrendon
- Southcourt
- Stewkley
- Waddesdon
- Walton Court And Hawkslade
- Weedon
- Wendover
- Wingrave
- Icknield
- Ridgeway East
- Wendover, Halton and Stoke Mandeville
- Aylesbury North
- Bernwood
- Stone and Waddesdon
- Aylesbury North West
- Aylesbury West
- Aylesbury East
- Aston Clinton and Bierton
- Aylesbury South East
- Aylesbury South West
- Chiltern Ridges
- Wing
- Great Brickhill
Property price trends in Aylesbury
According to the latest Land Registry data, the average home in Aylesbury sold for £424,437 in 2026. That figure comes from a substantial record of 79,864 sales logged over the past 31 years.
Prices have continued to climb over the last three years. Compared with 2023, when the typical sale came in around £391,638, that's a rise of roughly 8.4%.
Looking back five years, average prices are up about 5.8% since 2021, a gain of around £23,167 in cash terms.
Zoom out to the past decade for the fuller picture. Back in 2016, homes here averaged £331,116, so the typical sold price has climbed about 28.2% since then, roughly 2.5% a year. Stretch the view to fifteen years and that annual pace edges up closer to 3.4%.
Frequently asked questions about Aylesbury
What is the average price for a property for sale in Aylesbury?
The average price for a property for sale in Aylesbury is £404,940. This amount is 28% lower than the average price in Buckinghamshire. There are more than 10,000 property listings for sale in Aylesbury.
What locations have the most expensive properties for sale in Aylesbury?
The locations with the most expensive properties for sale in Aylesbury are Stewkley at an average of £1,350,000, Long Crendon at an average of £694,523 and Icknield at an average of £692,223.
What locations have the most affordable properties for sale in Aylesbury?
The locations with the most affordable properties for sale in Aylesbury are Aylesbury West at an average of £230,945, Aylesbury North at an average of £240,878 and Aylesbury Central at an average of £242,204.
Which train stations are available in or near Aylesbury?
Some of the train stations available in or near Aylesbury are Aylesbury, Aylesbury Vale Parkway and Stoke Mandeville.
Property Price Paid in Aylesbury by Year
The average sold property price by year was:
| Year | Average Sold Price | Price Change |
Sold Properties
|
|---|---|---|---|
| 2026 | £424,437 | 3% |
150 Properties |
| 2025 | £411,930 | 1% |
1,864 Properties |
| 2024 | £408,637 | 4% |
1,844 Properties |
| 2023 | £391,638 | -5% |
1,712 Properties |
| 2022 | £412,201 | 3% |
2,310 Properties |
| 2021 | £401,270 | 4% |
2,991 Properties |
| 2020 | £386,449 | 5% |
2,222 Properties |
| 2019 | £366,399 | 1% |
2,736 Properties |
| 2018 | £363,005 | 1% |
2,832 Properties |
| 2017 | £360,027 | 8% |
2,590 Properties |
Property Price per Property Type in Aylesbury
Here you can find historic sold price data in order to help with your property search.
The average Property Paid Price for specific property types in the last three years are:
| Property Type | Average Sold Price | Sold Properties |
|---|---|---|
| Semi Detached House | £407,251.00 | 1,671 Semi Detached Houses |
| Terraced House | £327,724.00 | 1,647 Terraced Houses |
| Detached House | £650,611.00 | 1,301 Detached Houses |
| Flat | £198,520.00 | 951 Flats |
Transport in Aylesbury
Please see below transportation links in this area:
