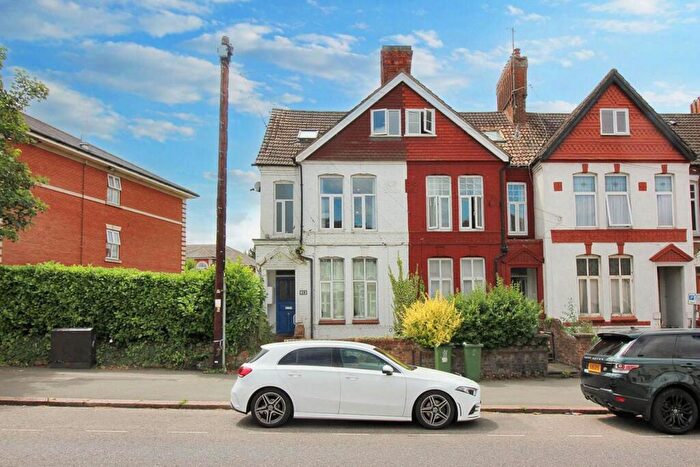
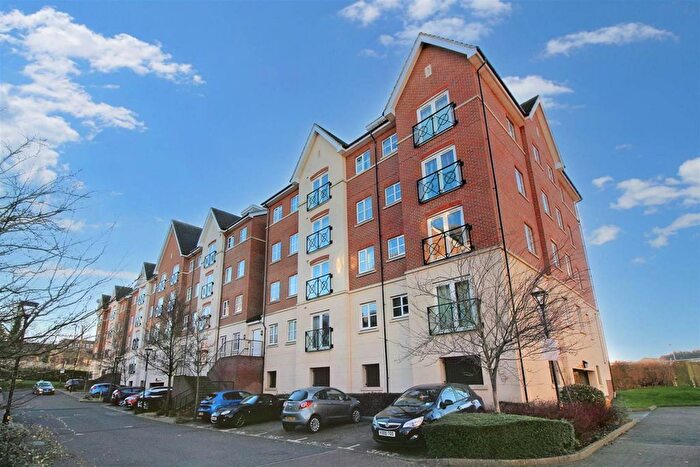
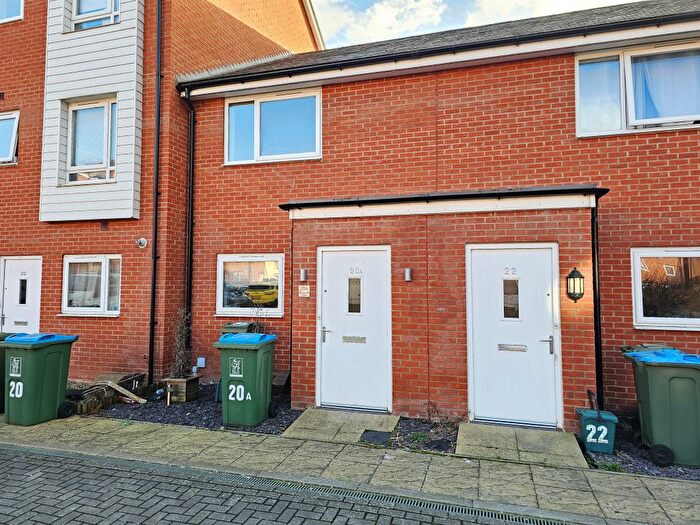
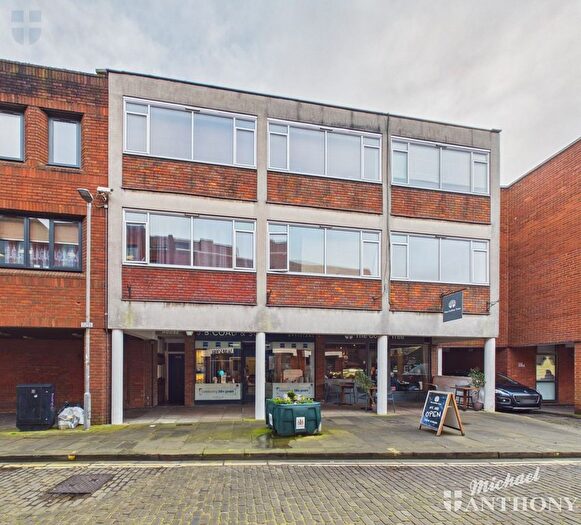
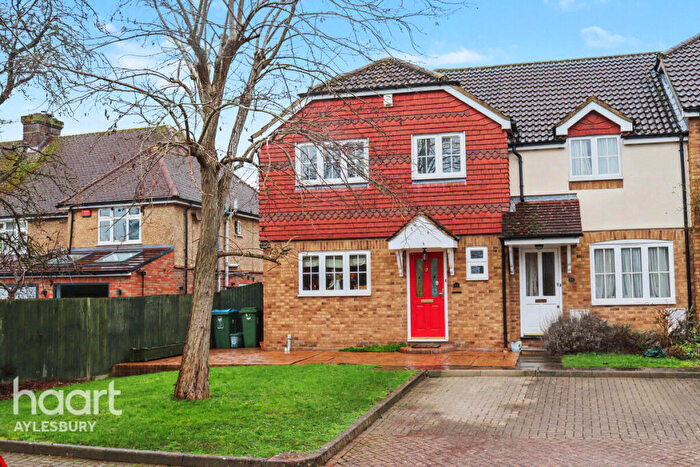
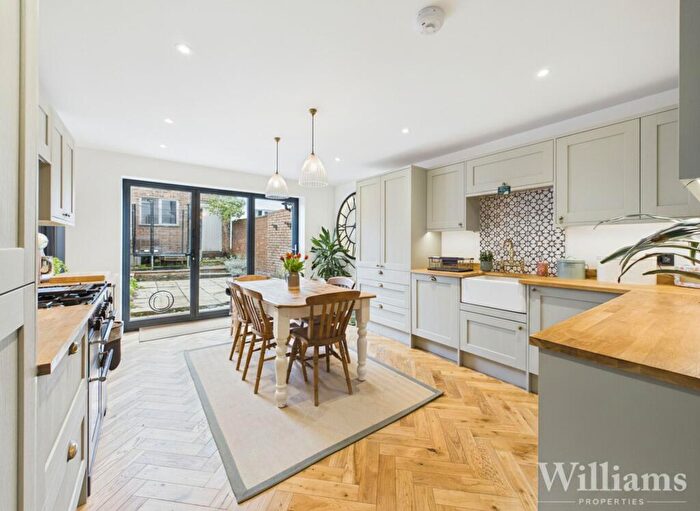
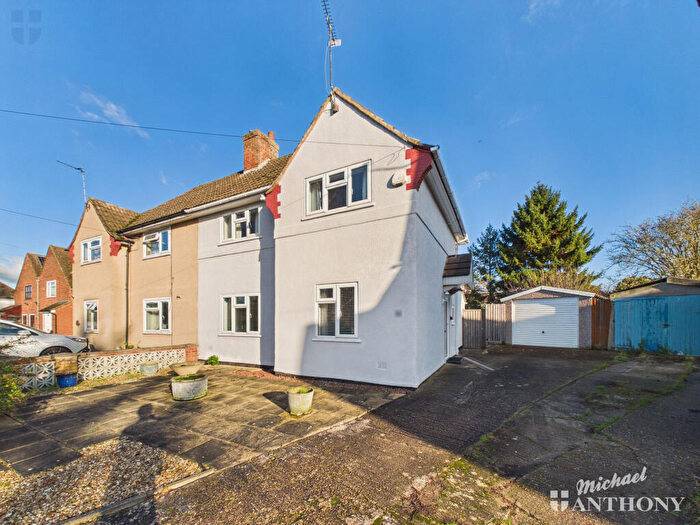
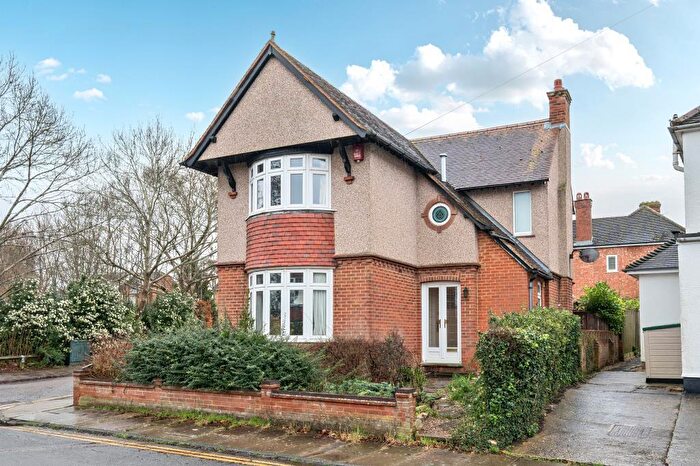
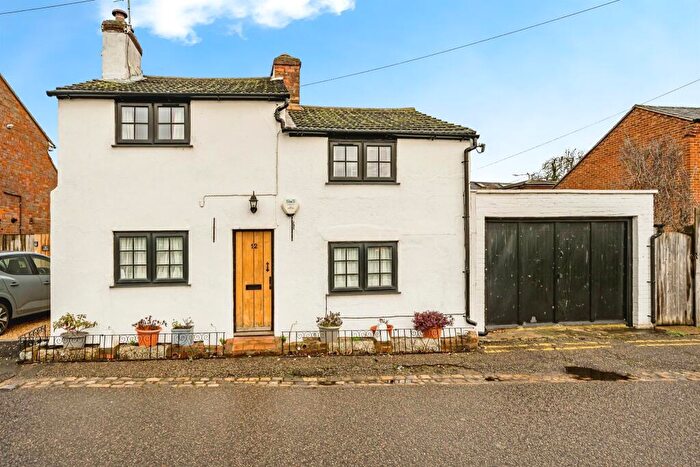
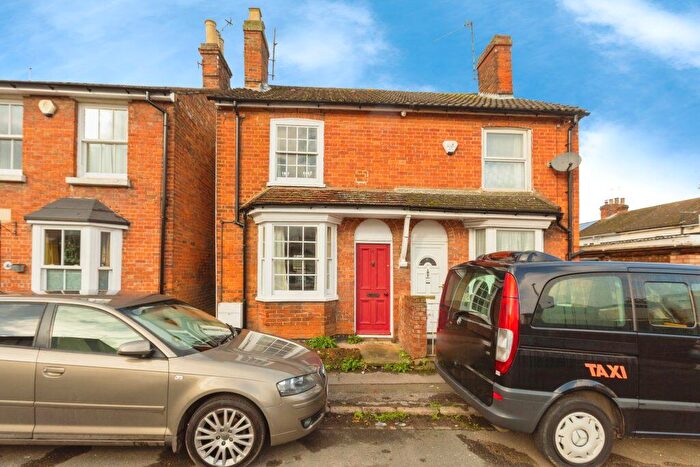
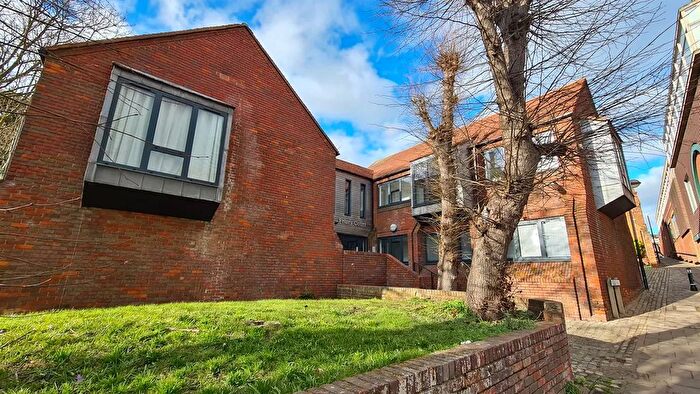
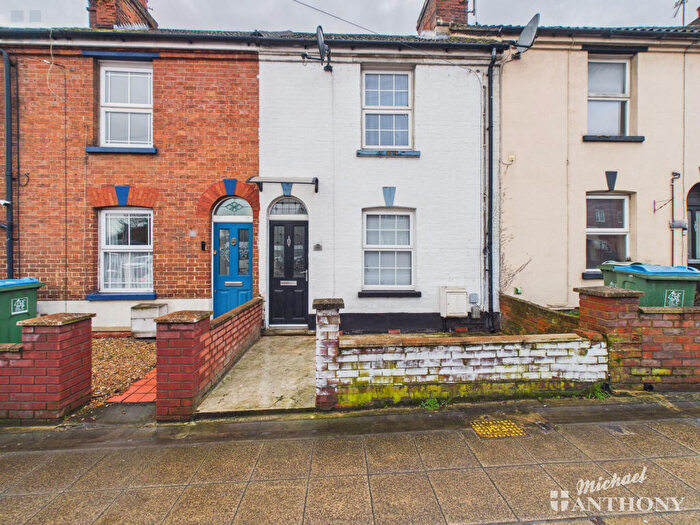
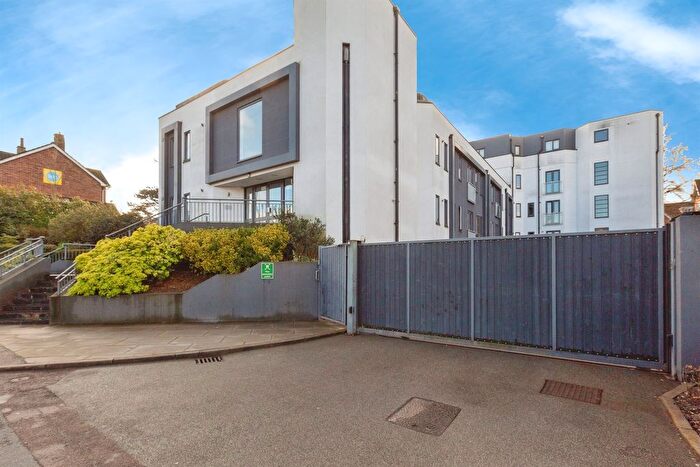
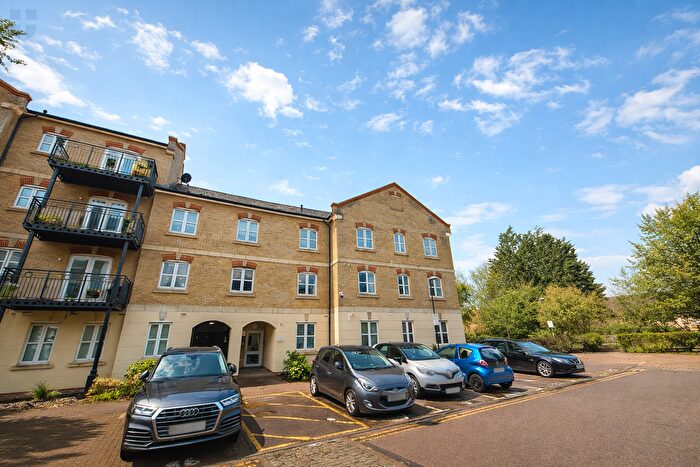
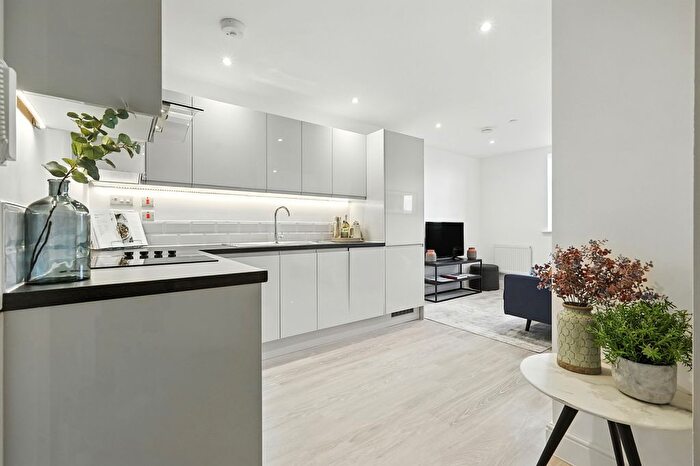
Houses for sale & to rent in Aylesbury Central, Aylesbury
House Prices in Aylesbury Central
Properties in Aylesbury Central have an average house price of £241,914.00 and had 185 Property Transactions within the last 3 years¹.
Aylesbury Central is an area in Aylesbury, Buckinghamshire with 1,663 households², where the most expensive property was sold for £925,000.00.
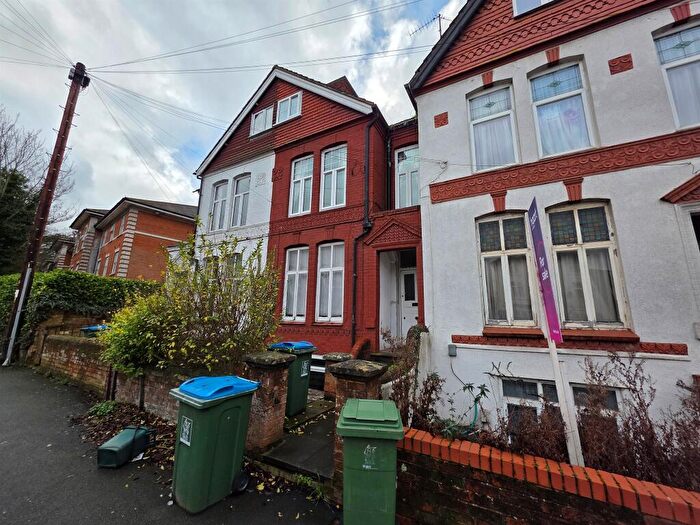
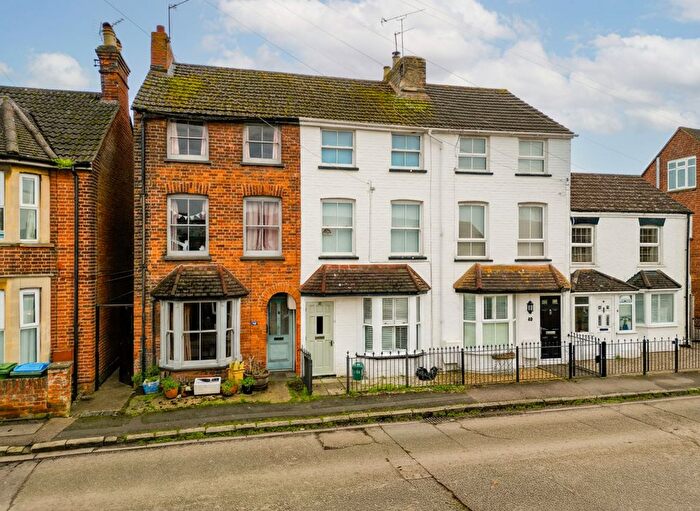
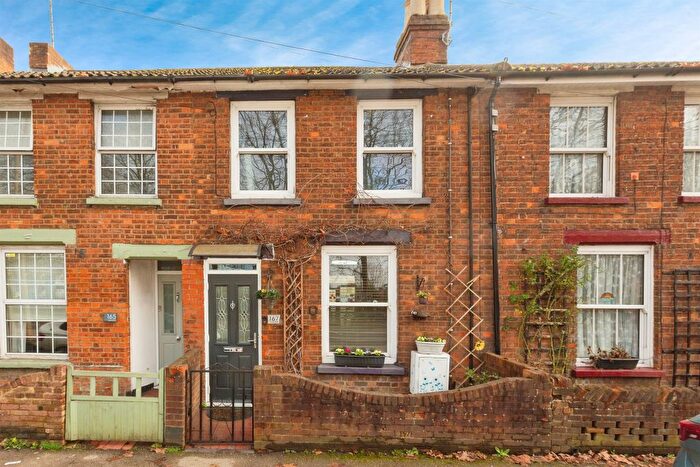
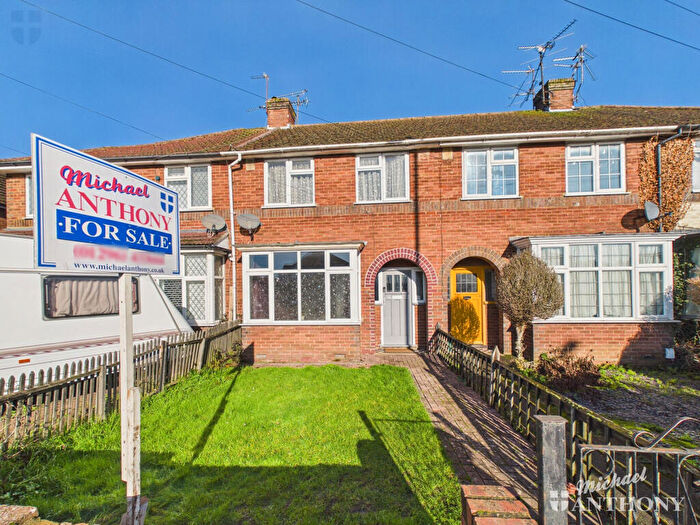
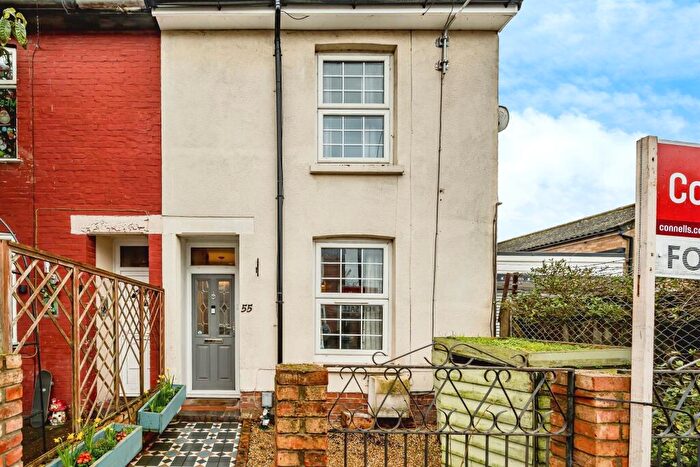
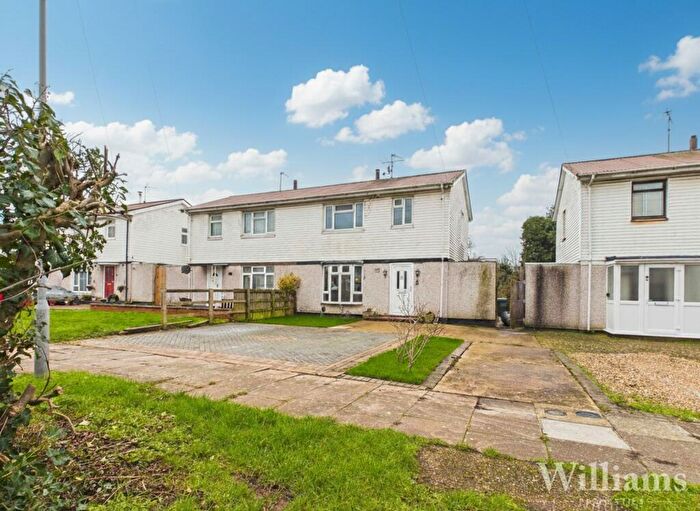
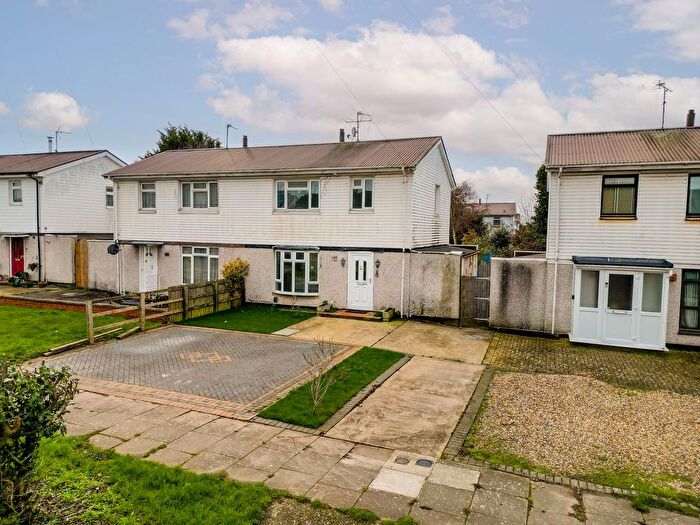
Properties for sale in Aylesbury Central
Roads and Postcodes in Aylesbury Central
Navigate through our locations to find the location of your next house in Aylesbury Central, Aylesbury for sale or to rent.
| Streets | Postcodes |
|---|---|
| Albion Street | HP20 1RD |
| Beaconsfield Road | HP21 7RG HP21 7RQ HP21 7SA |
| Brookside Terrace | HP21 7SF |
| Buckingham Street | HP20 2JZ HP20 2LB HP20 2LE HP20 2LH HP20 2LL HP20 2NB HP20 2NE HP20 2NF |
| Cambridge Street | HP20 1RA |
| Canal Side Terrace | HP21 7SB |
| Castle Court | HP20 2RD |
| Castle Street | HP20 2RA HP20 2RE HP20 2RF |
| Chadbone Close | HP20 2PS |
| Coronation Villas | HP21 7RN |
| Croft Court | HP21 7RE |
| Croft Road | HP21 7BY HP21 7RD HP21 7RH |
| Exchange Street | HP20 1QY |
| Florey Gardens | HP20 1RW HP20 1RY |
| Friarage Road | HP20 2SD HP20 2SG |
| Friarscroft Way | HP20 2TE HP20 2TF |
| George Street | HP20 2HU |
| Granville Place | HP20 2JS |
| Granville Street | HP20 2JR |
| Green End | HP20 2SA |
| Hale Street | HP20 1SB |
| High Street | HP20 1RB HP20 1RE HP20 1RQ HP20 1SA |
| Highbridge Road | HP21 7RX HP21 7RY |
| Highbridge Walk | HP21 7SE |
| Hilda Wharf | HP20 1RJ |
| Kerr Place | HP21 7BB |
| Kings Road | HP21 7RR |
| Kingsbury | HP20 2HT |
| Laurel Way | HP21 7TW |
| Market Square | HP20 1TW |
| Mill Way | HP20 2SF |
| Mount Street | HP20 2SE |
| Nelson Terrace | HP20 2JN |
| Old Brewery Close | HP21 7SH |
| Oxford Road | HP19 8RH |
| Parsons Fee | HP20 2QZ |
| Princes Road | HP21 7RZ |
| Queens Park | HP21 7RS HP21 7RT |
| Redwood Drive | HP21 7TN |
| Rickfords Hill | HP20 2RT HP20 2RX |
| Riley Close | HP20 2TH |
| Ripon Street | HP20 2JP |
| St Marys Row | HP20 2JL |
| St Marys Square | HP20 2JJ HP20 2JU |
| Stoke Road | HP21 7TF |
| Temple Street | HP20 2RQ |
| Viridian Square | HP21 7FX HP21 7FY HP21 7FZ |
| Walton Green | HP21 7RB |
| Walton Road | HP21 7RU HP21 7RW HP21 7SN HP21 7SR |
| Walton Street | HP20 1TZ HP21 7QX |
| Walton Terrace | HP21 7QY |
| Wendover Road | HP21 7SZ |
| Whitehall Street | HP20 2JW |
| Willowbank Terrace | HP21 7SD |
Transport near Aylesbury Central
- FAQ
- Price Paid By Year
- Property Type Price
Frequently asked questions about Aylesbury Central
What is the average price for a property for sale in Aylesbury Central?
The average price for a property for sale in Aylesbury Central is £241,914. This amount is 40% lower than the average price in Aylesbury. There are 1,990 property listings for sale in Aylesbury Central.
What streets have the most expensive properties for sale in Aylesbury Central?
The streets with the most expensive properties for sale in Aylesbury Central are Walton Terrace at an average of £562,500, Nelson Terrace at an average of £390,000 and Walton Road at an average of £380,000.
What streets have the most affordable properties for sale in Aylesbury Central?
The streets with the most affordable properties for sale in Aylesbury Central are Croft Road at an average of £135,375, Beaconsfield Road at an average of £155,928 and Temple Street at an average of £160,750.
Which train stations are available in or near Aylesbury Central?
Some of the train stations available in or near Aylesbury Central are Aylesbury, Stoke Mandeville and Aylesbury Vale Parkway.
Property Price Paid in Aylesbury Central by Year
The average sold property price by year was:
| Year | Average Sold Price | Price Change |
Sold Properties
|
|---|---|---|---|
| 2025 | £231,245 | -3% |
54 Properties |
| 2024 | £238,351 | -7% |
64 Properties |
| 2023 | £253,917 | 5% |
67 Properties |
| 2022 | £241,725 | 7% |
95 Properties |
| 2021 | £225,101 | 1% |
95 Properties |
| 2020 | £223,393 | 1% |
52 Properties |
| 2019 | £221,900 | 5% |
77 Properties |
| 2018 | £210,782 | -7% |
75 Properties |
| 2017 | £225,566 | 12% |
79 Properties |
| 2016 | £199,573 | 2% |
104 Properties |
| 2015 | £196,414 | 12% |
120 Properties |
| 2014 | £171,911 | 5% |
91 Properties |
| 2013 | £162,685 | -13% |
63 Properties |
| 2012 | £183,294 | 14% |
47 Properties |
| 2011 | £157,558 | -3% |
54 Properties |
| 2010 | £161,759 | 9% |
86 Properties |
| 2009 | £147,825 | -24% |
80 Properties |
| 2008 | £182,896 | 1% |
140 Properties |
| 2007 | £181,714 | 18% |
211 Properties |
| 2006 | £149,532 | -10% |
123 Properties |
| 2005 | £164,950 | - |
131 Properties |
| 2004 | £164,970 | 15% |
78 Properties |
| 2003 | £140,707 | -0,4% |
96 Properties |
| 2002 | £141,270 | 25% |
131 Properties |
| 2001 | £105,528 | 14% |
119 Properties |
| 2000 | £91,079 | 6% |
113 Properties |
| 1999 | £85,561 | 19% |
162 Properties |
| 1998 | £69,162 | 4% |
100 Properties |
| 1997 | £66,061 | 6% |
82 Properties |
| 1996 | £62,372 | -4% |
138 Properties |
| 1995 | £64,826 | - |
63 Properties |
Property Price per Property Type in Aylesbury Central
Here you can find historic sold price data in order to help with your property search.
The average Property Paid Price for specific property types in the last three years are:
| Property Type | Average Sold Price | Sold Properties |
|---|---|---|
| Semi Detached House | £334,125.00 | 8 Semi Detached Houses |
| Detached House | £590,000.00 | 2 Detached Houses |
| Terraced House | £305,540.00 | 72 Terraced Houses |
| Flat | £183,517.00 | 103 Flats |

