
Houses for sale & to rent in Southcourt, Aylesbury
House Prices in Southcourt
Properties in Southcourt have an average house price of £272,421.00 and had 208 Property Transactions within the last 3 years¹.
Southcourt is an area in Aylesbury, Buckinghamshire with 2,410 households², where the most expensive property was sold for £490,000.00.
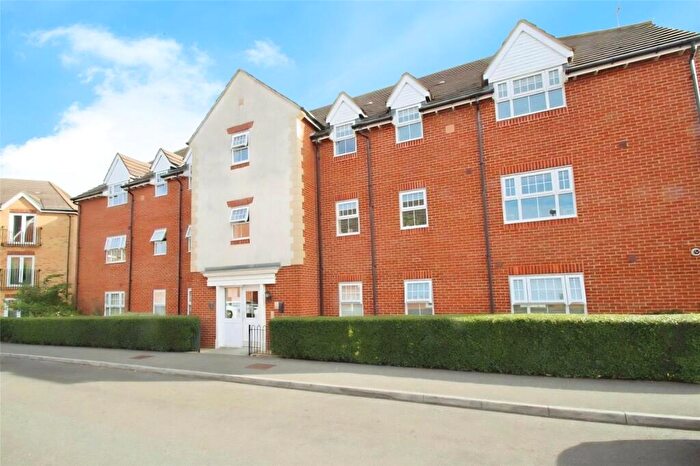
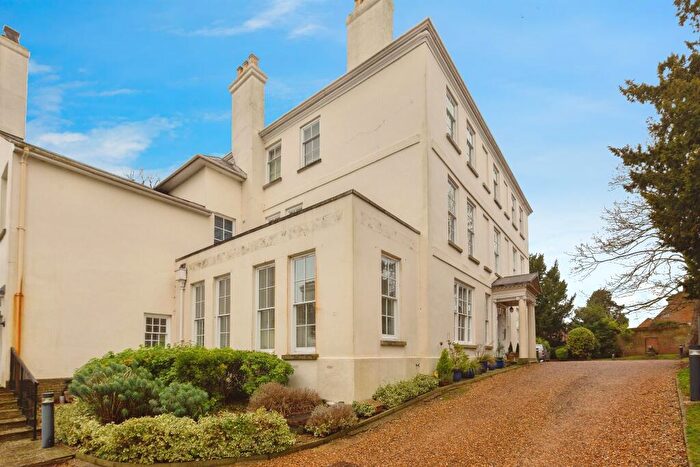
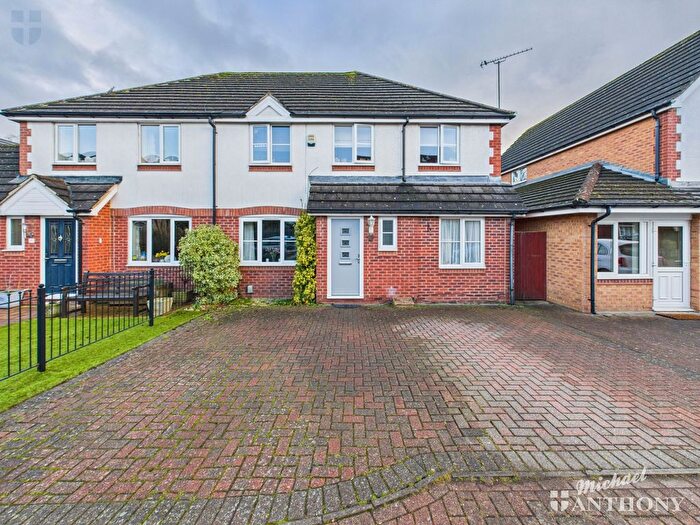
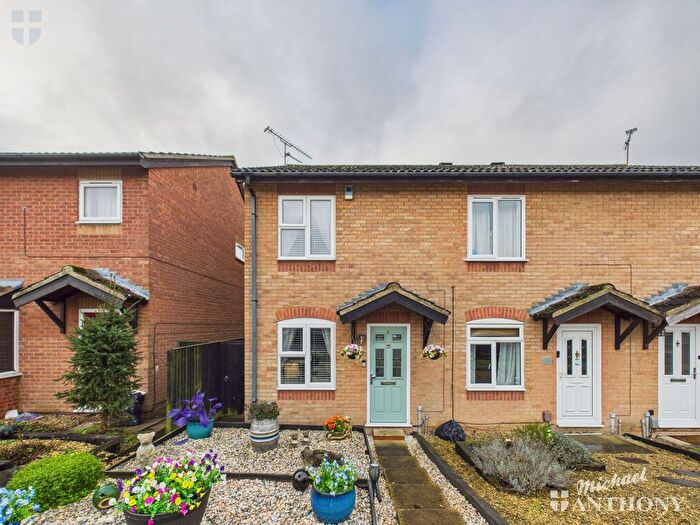
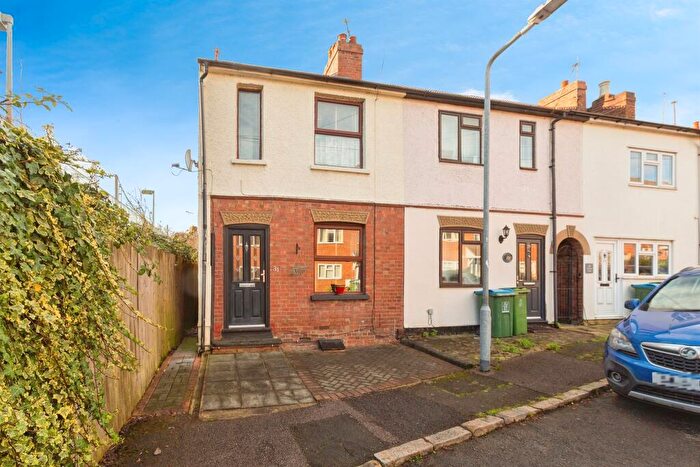
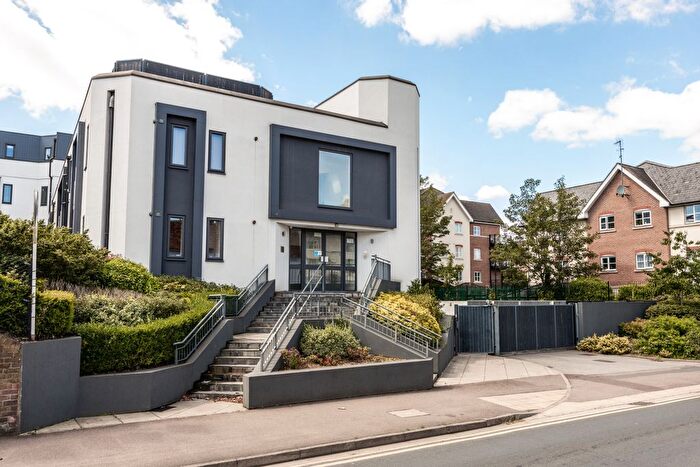
Properties for sale in Southcourt
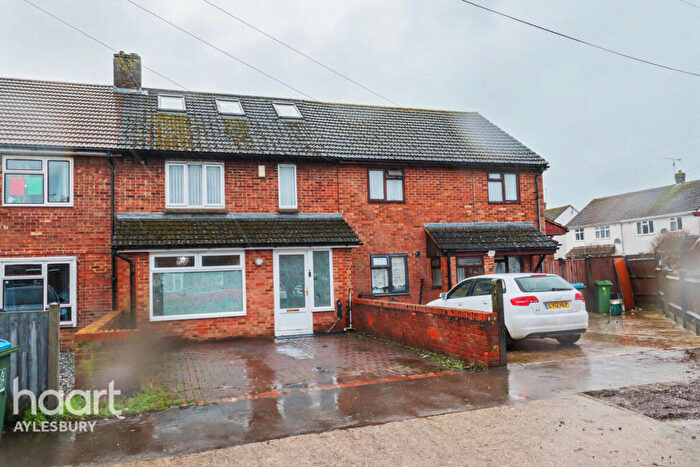
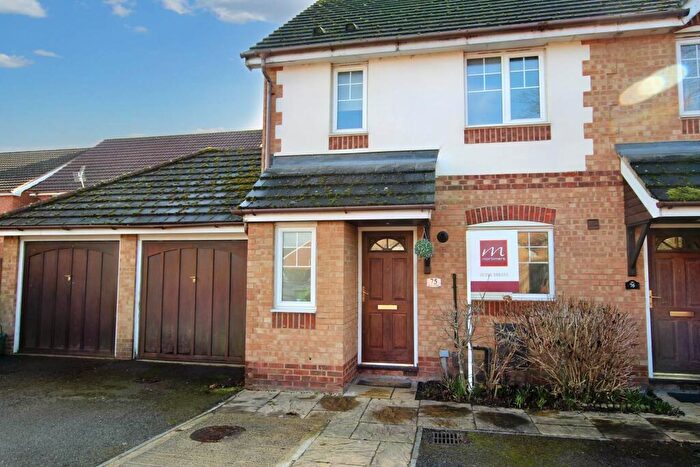
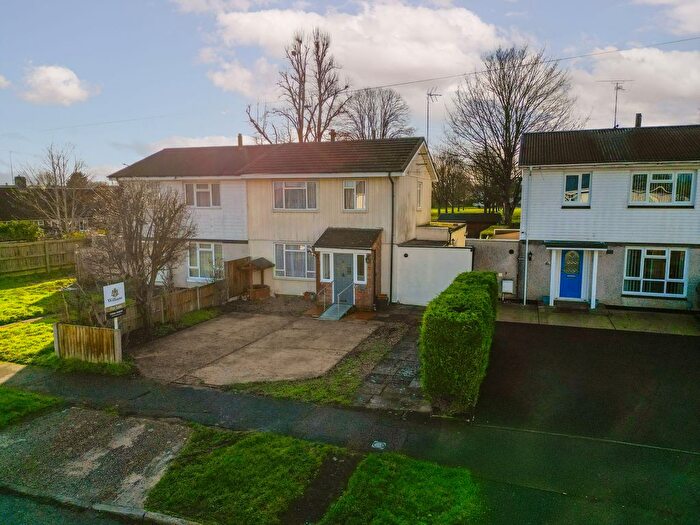
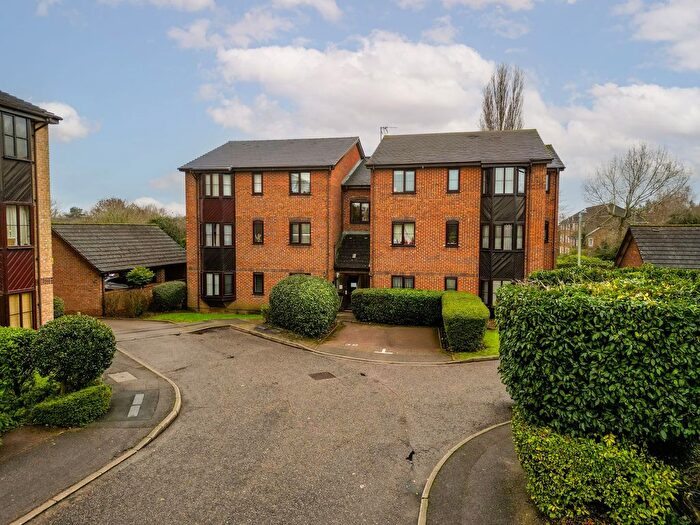

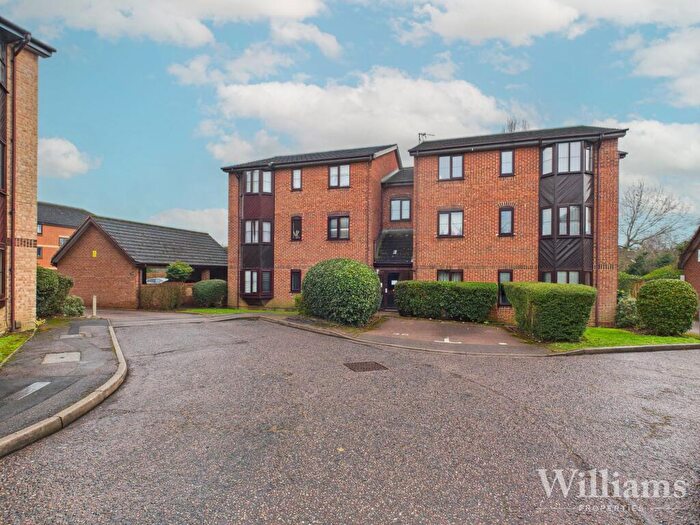
![]()
If you are looking to sell your house, let it out, or receive a property valuation, an expert can help you.
Click the button below to get started.


Roads and Postcodes in Southcourt
Navigate through our locations to find the location of your next house in Southcourt, Aylesbury for sale or to rent.
Transport near Southcourt

- FAQ
- Price Paid By Year
- Property Type Price
Frequently asked questions about Southcourt
What is the average price for a property for sale in Southcourt?
The average price for a property for sale in Southcourt is £272,421. This amount is 33% lower than the average price in Aylesbury. There are 1,812 property listings for sale in Southcourt.
What streets have the most expensive properties for sale in Southcourt?
The streets with the most expensive properties for sale in Southcourt are Hampden Road at an average of £410,000, Paterson Road at an average of £401,666 and Cottesloe Road at an average of £396,000.
What streets have the most affordable properties for sale in Southcourt?
The streets with the most affordable properties for sale in Southcourt are Lowe Gardens at an average of £170,000, Coxhill Way at an average of £190,738 and Hartwell End at an average of £196,000.
Which train stations are available in or near Southcourt?
Some of the train stations available in or near Southcourt are Aylesbury, Stoke Mandeville and Aylesbury Vale Parkway.
Property Price Paid in Southcourt by Year
The average sold property price by year was:
| Year | Average Sold Price | Price Change |
Sold Properties
|
|---|---|---|---|
| 2025 | £274,542 | -6% |
35 Properties |
| 2024 | £290,700 | 12% |
51 Properties |
| 2023 | £256,261 | -5% |
44 Properties |
| 2022 | £268,632 | 11% |
78 Properties |
| 2021 | £240,246 | -2% |
79 Properties |
| 2020 | £246,230 | 6% |
50 Properties |
| 2019 | £231,949 | -4% |
50 Properties |
| 2018 | £241,540 | 5% |
84 Properties |
| 2017 | £229,527 | 2% |
85 Properties |
| 2016 | £224,672 | 16% |
97 Properties |
| 2015 | £189,574 | 11% |
113 Properties |
| 2014 | £168,751 | 10% |
74 Properties |
| 2013 | £152,371 | 8% |
67 Properties |
| 2012 | £140,808 | -2% |
108 Properties |
| 2011 | £143,530 | -8% |
69 Properties |
| 2010 | £154,878 | 13% |
44 Properties |
| 2009 | £134,895 | -19% |
63 Properties |
| 2008 | £160,202 | -4% |
92 Properties |
| 2007 | £166,308 | 8% |
240 Properties |
| 2006 | £152,614 | 6% |
123 Properties |
| 2005 | £143,047 | 12% |
76 Properties |
| 2004 | £126,463 | 7% |
94 Properties |
| 2003 | £117,134 | 13% |
75 Properties |
| 2002 | £102,448 | 14% |
101 Properties |
| 2001 | £88,078 | 14% |
63 Properties |
| 2000 | £75,662 | 18% |
64 Properties |
| 1999 | £61,791 | 1% |
82 Properties |
| 1998 | £61,230 | 12% |
53 Properties |
| 1997 | £54,155 | 11% |
65 Properties |
| 1996 | £48,454 | -1% |
61 Properties |
| 1995 | £49,054 | - |
54 Properties |
Property Price per Property Type in Southcourt
Here you can find historic sold price data in order to help with your property search.
The average Property Paid Price for specific property types in the last three years are:
| Property Type | Average Sold Price | Sold Properties |
|---|---|---|
| Semi Detached House | £325,473.00 | 95 Semi Detached Houses |
| Detached House | £360,000.00 | 2 Detached Houses |
| Terraced House | £298,988.00 | 38 Terraced Houses |
| Flat | £187,150.00 | 73 Flats |