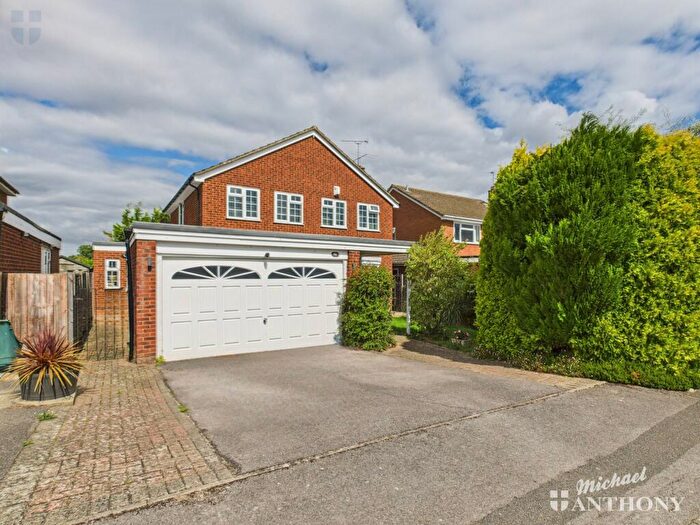
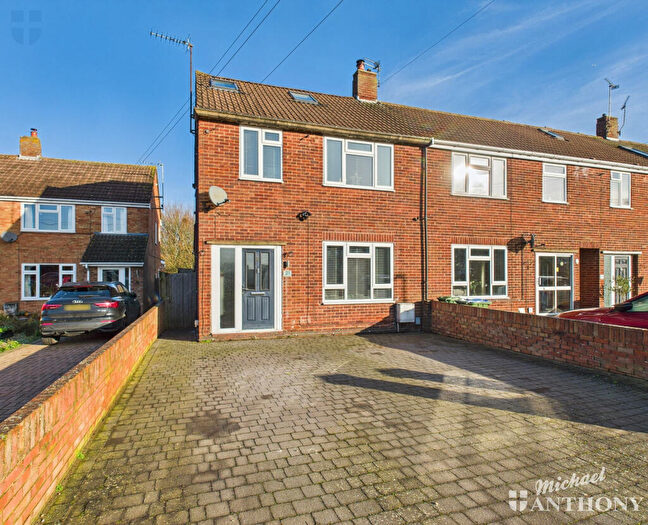
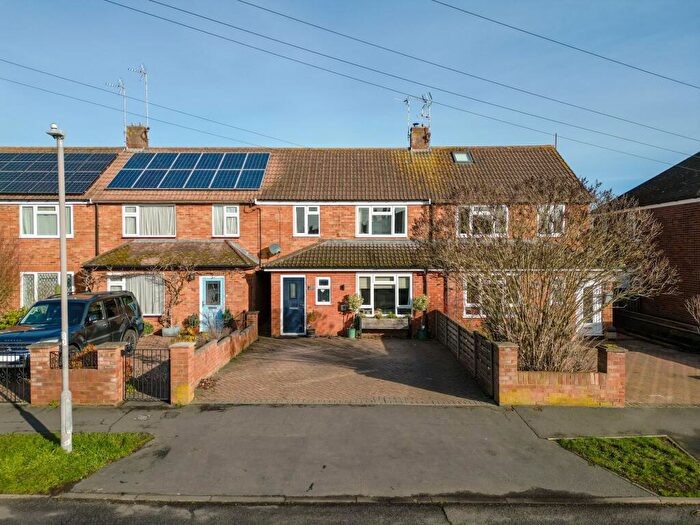
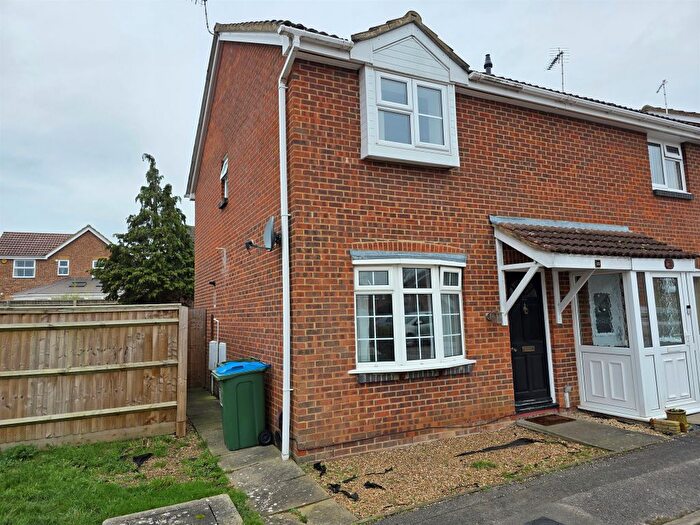
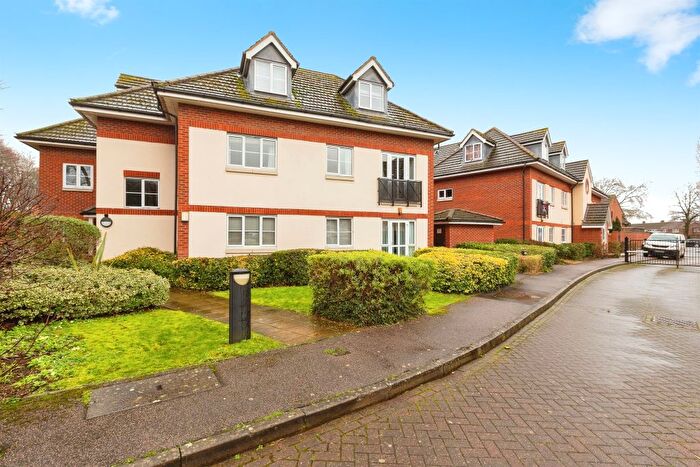
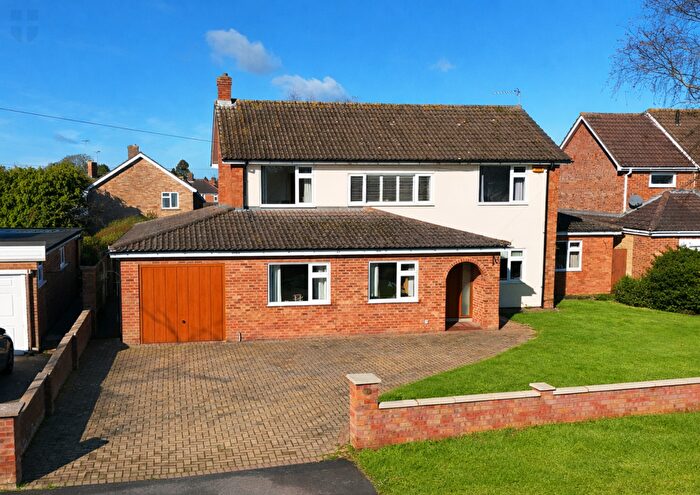
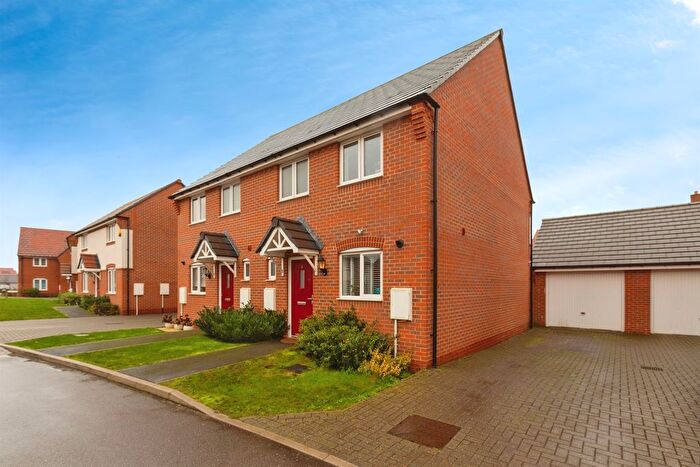
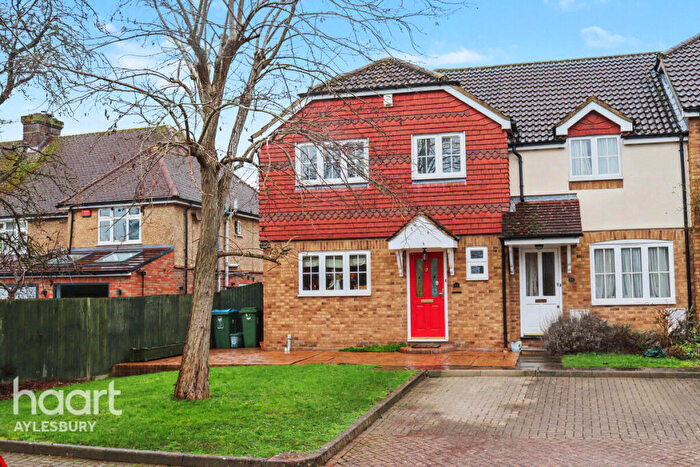
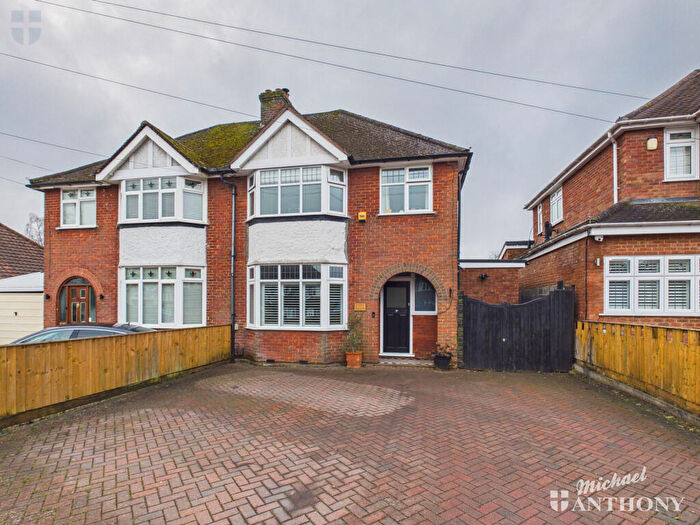
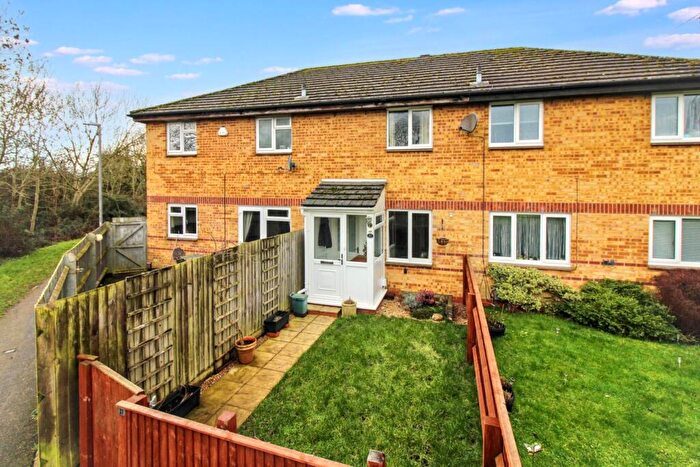
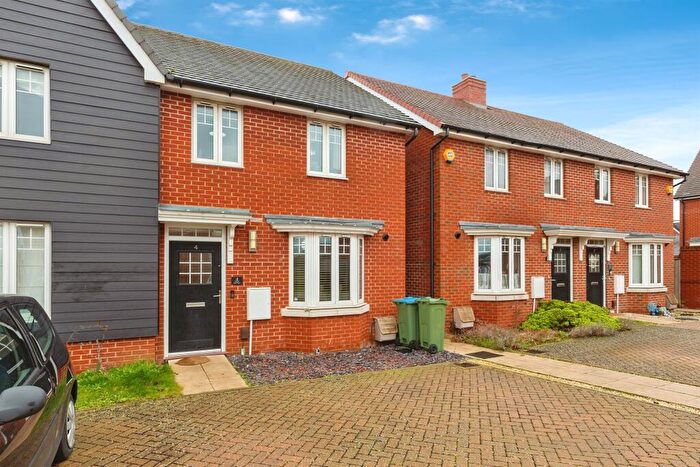
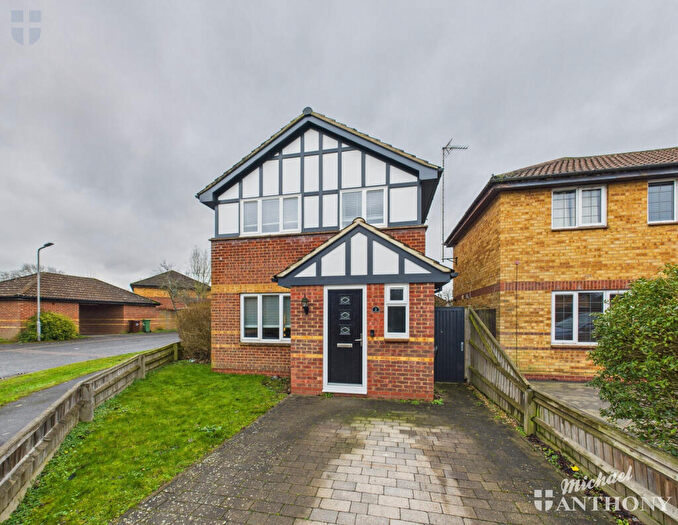
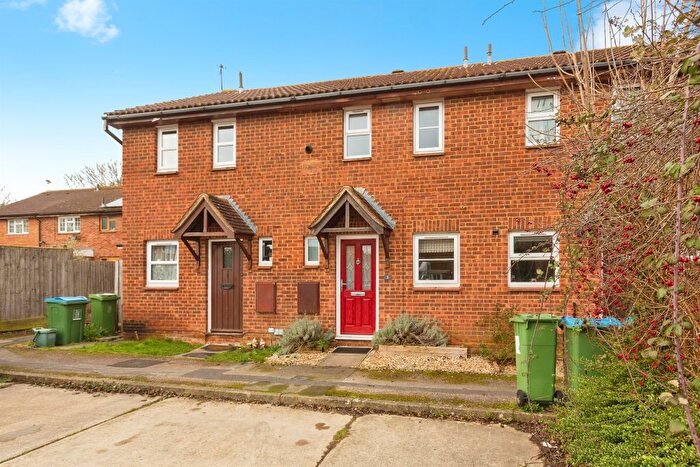
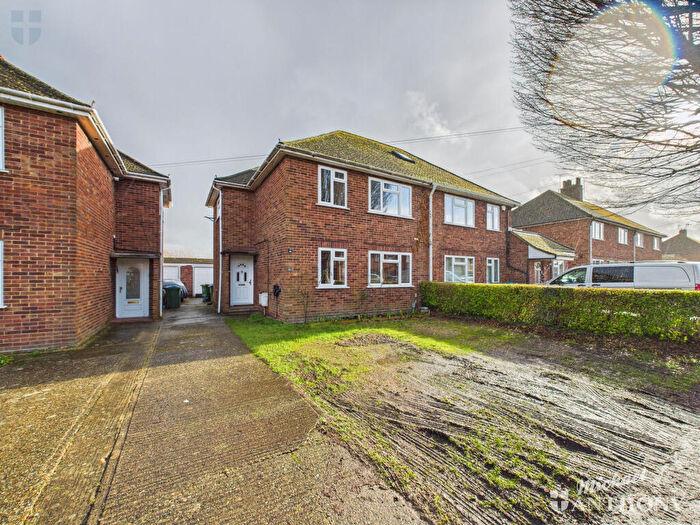
Houses for sale & to rent in Oakfield, Aylesbury
House Prices in Oakfield
Properties in Oakfield have an average house price of £340,046.00 and had 248 Property Transactions within the last 3 years¹.
Oakfield is an area in Aylesbury, Buckinghamshire with 2,153 households², where the most expensive property was sold for £724,667.00.
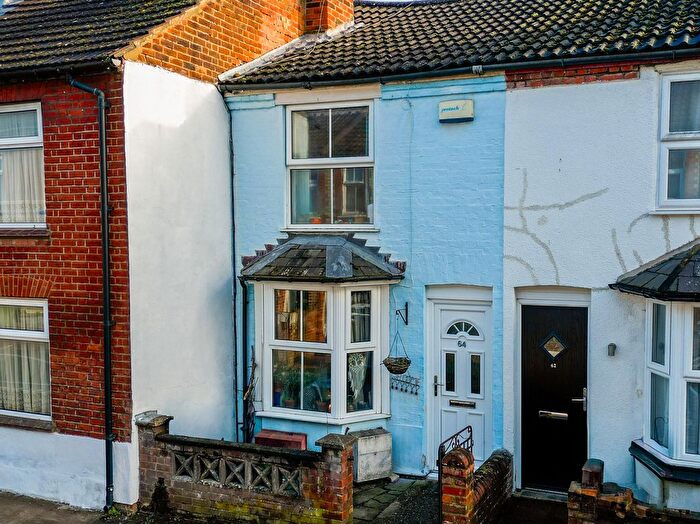
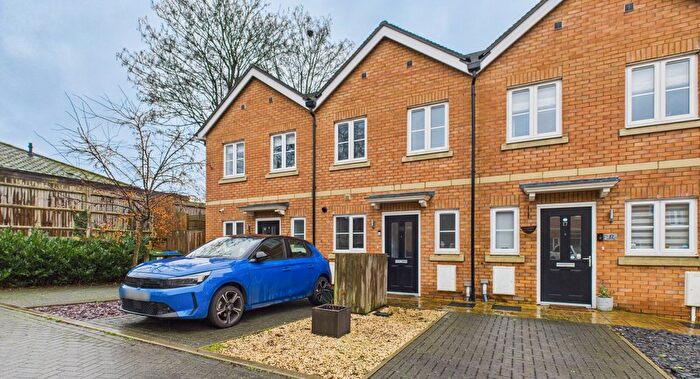
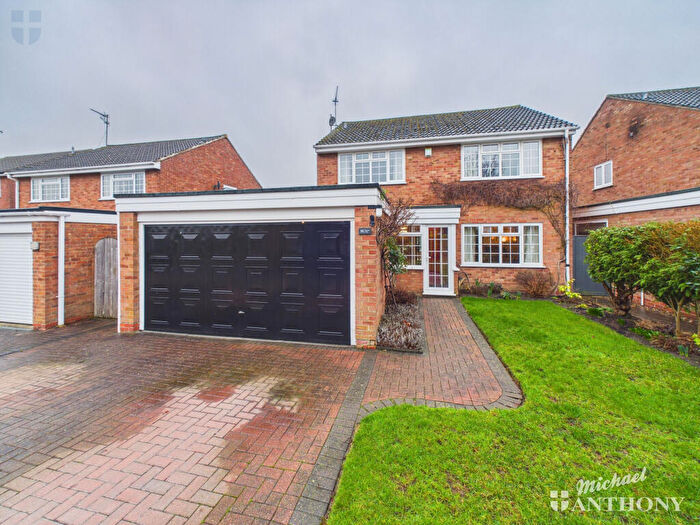
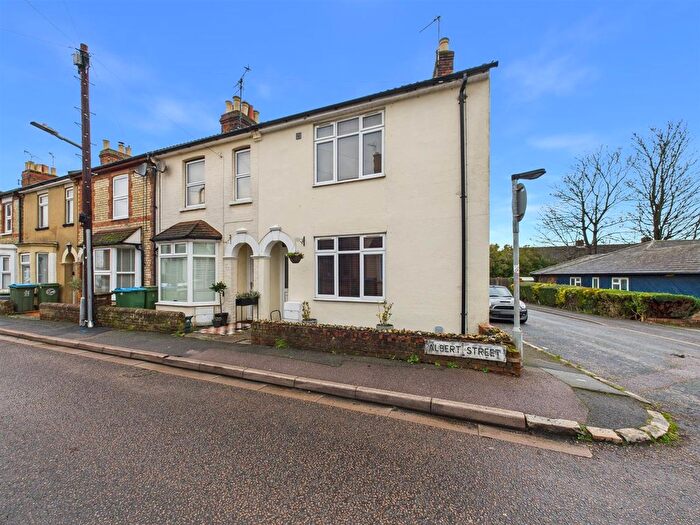
Properties for sale in Oakfield
Roads and Postcodes in Oakfield
Navigate through our locations to find the location of your next house in Oakfield, Aylesbury for sale or to rent.
| Streets | Postcodes |
|---|---|
| Albert Street | HP20 1LX HP20 1LY |
| Archer Drive | HP20 1DZ HP20 1EP HP20 1ER |
| Ash Close | HP20 1XX |
| Ashley Row | HP20 1HJ |
| Aspen Close | HP20 1XY |
| Barnsbury Avenue | HP20 1NL |
| Bierton Road | HP20 1EE |
| Bramcote Close | HP20 1QE |
| Broughton Avenue | HP20 1NH HP20 1NN HP20 1NQ HP20 1PU HP20 1PX HP20 1PY HP20 1QB |
| Broughton Terrace | HP20 1NJ |
| Campion Close | HP20 1QG |
| Cedar Close | HP20 1XU |
| Como Road | HP20 1NR |
| Connaught Road | HP20 1PS |
| Coppice Close | HP20 1XT |
| Coppice Way | HP20 1XG HP20 1XQ |
| Coy Court | HP20 1JJ |
| Denby Walk | HP20 1LW |
| Douglas Road | HP20 1ES HP20 1HW |
| Eastfield Road | HP20 1PA |
| Field Close | HP20 1XR |
| Field Way | HP20 1XJ |
| Grasslands | HP20 1XE |
| Grecian Street | HP20 1LT |
| Green View | HP20 1XP |
| Haddington Way | HP20 1HH |
| Hawthorn Close | HP20 1HP |
| Henry Road | HP20 1NP HP20 1NW |
| Heron Close | HP20 1PT |
| Ivinghoe View | HP20 1HL HP20 1HN |
| Larch Close | HP20 1XZ |
| Lawrence Close | HP20 1DY |
| Ludlow Place | HP20 1QD |
| Malvern Road | HP20 1QF |
| Meadow Close | HP20 1XH |
| Meadow Way | HP20 1XS |
| Narbeth Drive | HP20 1NS HP20 1NT HP20 1NU HP20 1NX HP20 1PZ HP20 1QA |
| Northfield Road | HP20 1PB HP20 1PD HP20 1QH |
| Oakfield Road | HP20 1LH HP20 1LL |
| Olivier Way | HP20 1JG |
| Park Street | HP20 1AD HP20 1DU HP20 1DX |
| Phipps Close | HP20 1DT |
| Poplar Close | HP20 1XW |
| Poplar Road | HP20 1XN |
| Queen Street | HP20 1LU |
| Richmond Road | HP20 1PL HP20 1PN HP20 1PW |
| Shakespeare Way | HP20 1JF |
| Shaw Close | HP20 1JQ |
| Shepherd Close | HP20 1DR |
| Southfield Road | HP20 1PE |
| Stanhope Road | HP20 1LP HP20 1LR |
| Stocklake | HP20 1DA HP20 1DN |
| The Dell | HP20 1YP |
| The Pastures | HP20 1XL |
| Tring Road | HP20 1JH HP20 1LD HP20 1LE HP20 1LQ HP20 1ND HP20 1PH HP20 1PJ |
| Victoria Street | HP20 1LZ HP20 1NA |
| Warwick Row | HP20 1HD |
| Wesley Close | HP20 1DL |
| Wingate Walk | HP20 1LN |
Transport near Oakfield
-
Aylesbury Station
-
Stoke Mandeville Station
-
Aylesbury Vale Parkway Station
-
Wendover Station
-
Little Kimble Station
- FAQ
- Price Paid By Year
- Property Type Price
Frequently asked questions about Oakfield
What is the average price for a property for sale in Oakfield?
The average price for a property for sale in Oakfield is £340,046. This amount is 16% lower than the average price in Aylesbury. There are 1,463 property listings for sale in Oakfield.
What streets have the most expensive properties for sale in Oakfield?
The streets with the most expensive properties for sale in Oakfield are Malvern Road at an average of £571,666, Southfield Road at an average of £525,000 and Broughton Avenue at an average of £475,625.
What streets have the most affordable properties for sale in Oakfield?
The streets with the most affordable properties for sale in Oakfield are Coy Court at an average of £188,500, Grasslands at an average of £211,000 and Poplar Road at an average of £212,700.
Which train stations are available in or near Oakfield?
Some of the train stations available in or near Oakfield are Aylesbury, Stoke Mandeville and Aylesbury Vale Parkway.
Property Price Paid in Oakfield by Year
The average sold property price by year was:
| Year | Average Sold Price | Price Change |
Sold Properties
|
|---|---|---|---|
| 2025 | £341,330 | 3% |
82 Properties |
| 2024 | £332,475 | -4% |
82 Properties |
| 2023 | £346,184 | -1% |
84 Properties |
| 2022 | £348,789 | 11% |
78 Properties |
| 2021 | £311,860 | 6% |
126 Properties |
| 2020 | £294,383 | -1% |
80 Properties |
| 2019 | £298,044 | 7% |
78 Properties |
| 2018 | £278,329 | -1% |
91 Properties |
| 2017 | £280,867 | 11% |
103 Properties |
| 2016 | £250,676 | 7% |
101 Properties |
| 2015 | £232,429 | 7% |
128 Properties |
| 2014 | £215,464 | 7% |
101 Properties |
| 2013 | £200,254 | -2% |
88 Properties |
| 2012 | £204,751 | 1% |
66 Properties |
| 2011 | £201,871 | 1% |
90 Properties |
| 2010 | £199,203 | 7% |
69 Properties |
| 2009 | £186,160 | -12% |
65 Properties |
| 2008 | £207,583 | 2% |
77 Properties |
| 2007 | £203,417 | 13% |
174 Properties |
| 2006 | £176,725 | -2% |
172 Properties |
| 2005 | £180,962 | 7% |
112 Properties |
| 2004 | £168,155 | 10% |
183 Properties |
| 2003 | £151,407 | 13% |
162 Properties |
| 2002 | £131,250 | 16% |
174 Properties |
| 2001 | £110,445 | 7% |
168 Properties |
| 2000 | £102,378 | 14% |
156 Properties |
| 1999 | £87,670 | 2% |
169 Properties |
| 1998 | £86,229 | 10% |
200 Properties |
| 1997 | £77,965 | 22% |
208 Properties |
| 1996 | £60,673 | -1% |
114 Properties |
| 1995 | £61,418 | - |
103 Properties |
Property Price per Property Type in Oakfield
Here you can find historic sold price data in order to help with your property search.
The average Property Paid Price for specific property types in the last three years are:
| Property Type | Average Sold Price | Sold Properties |
|---|---|---|
| Semi Detached House | £393,168.00 | 83 Semi Detached Houses |
| Detached House | £486,520.00 | 33 Detached Houses |
| Terraced House | £298,534.00 | 101 Terraced Houses |
| Flat | £177,143.00 | 31 Flats |

