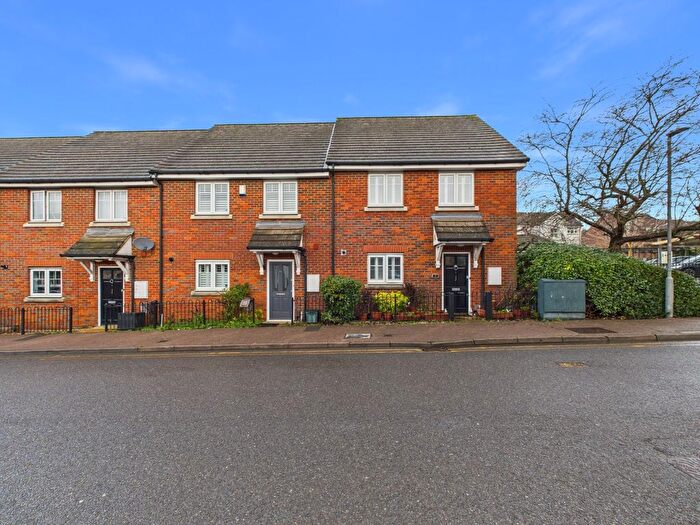
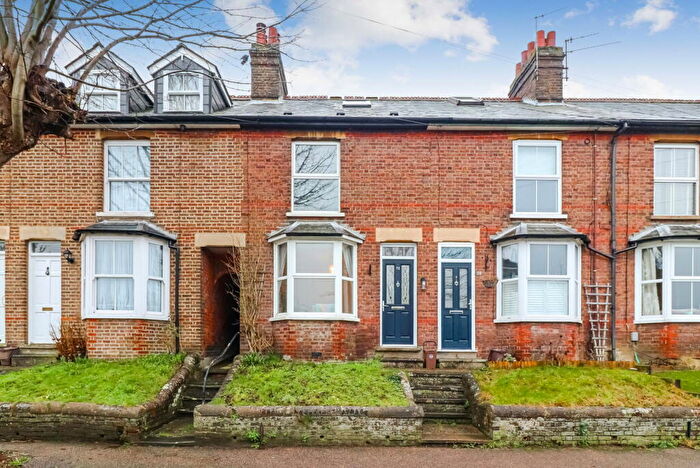
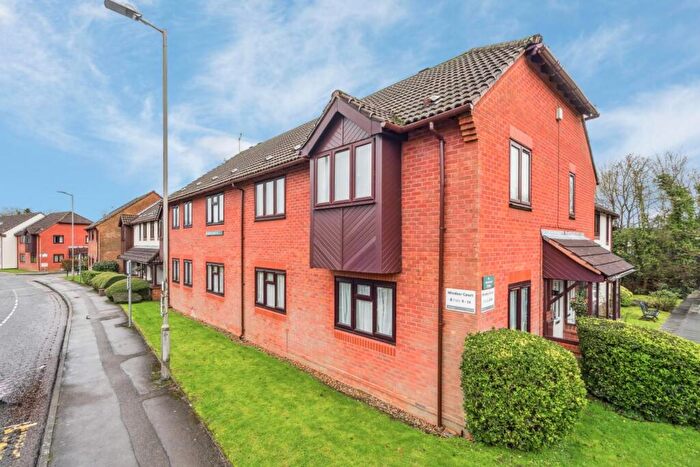
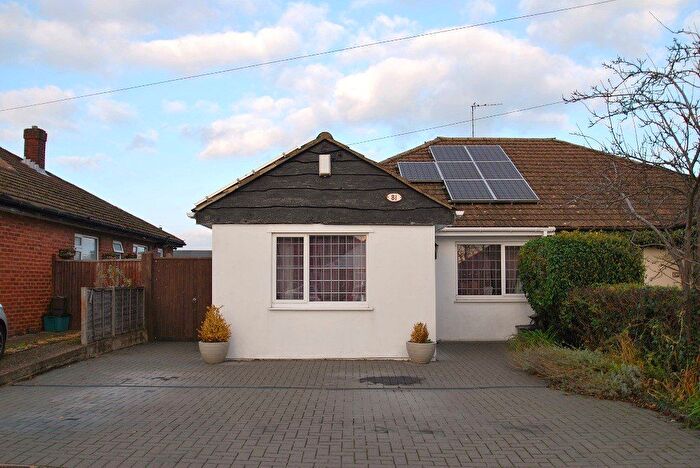
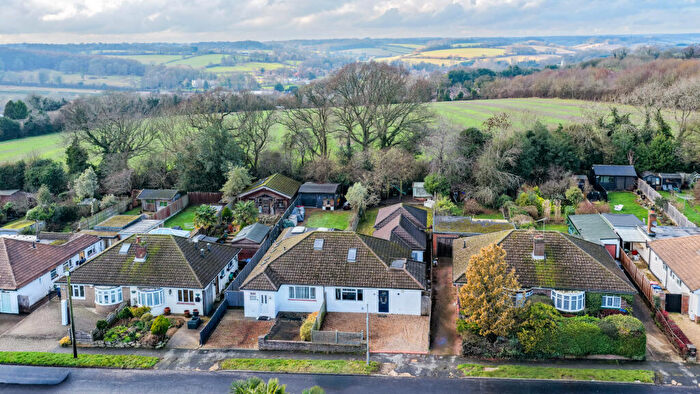
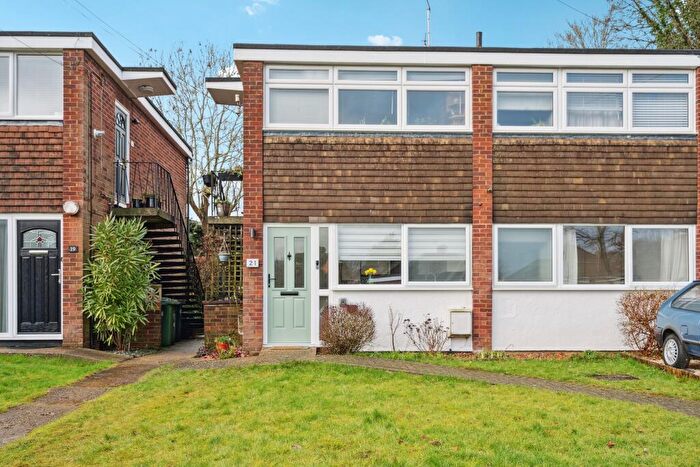
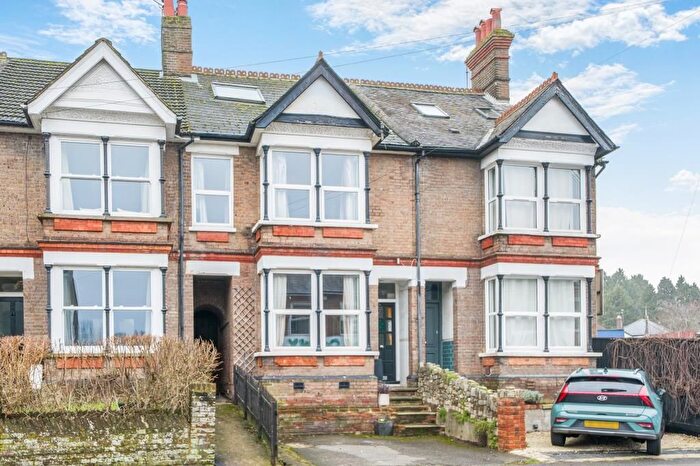
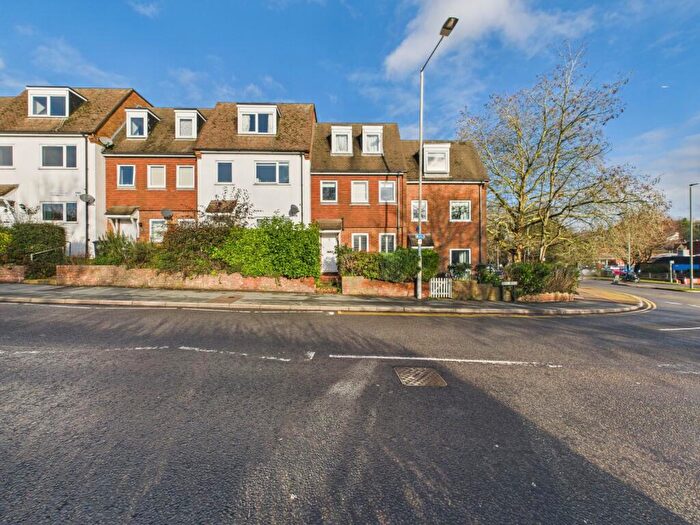
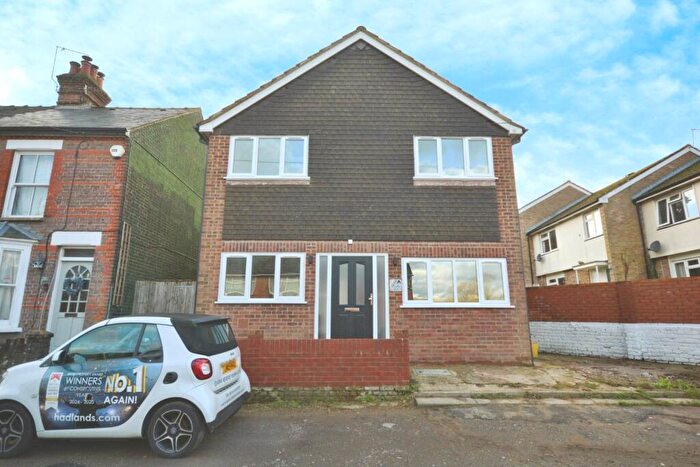
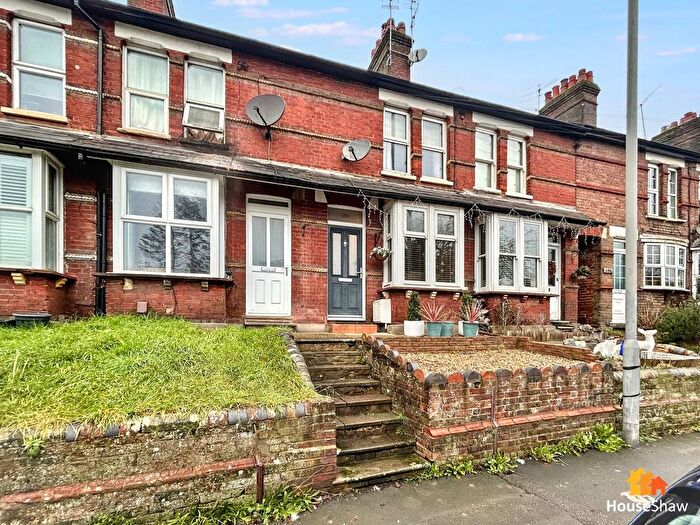
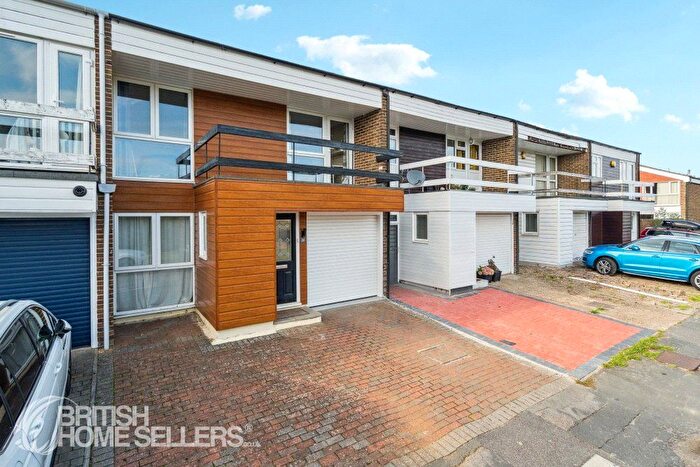
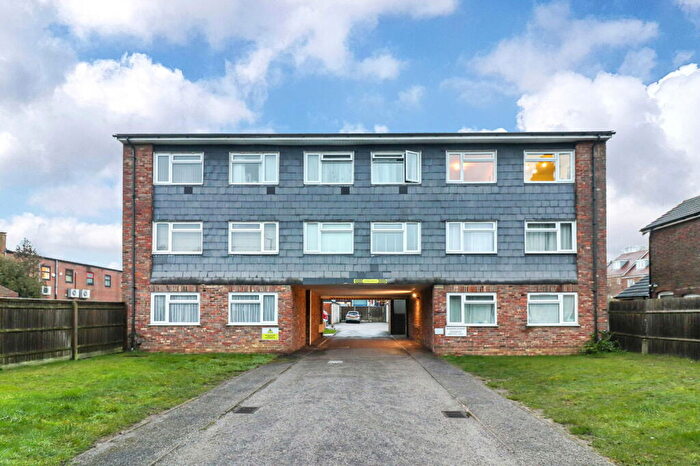
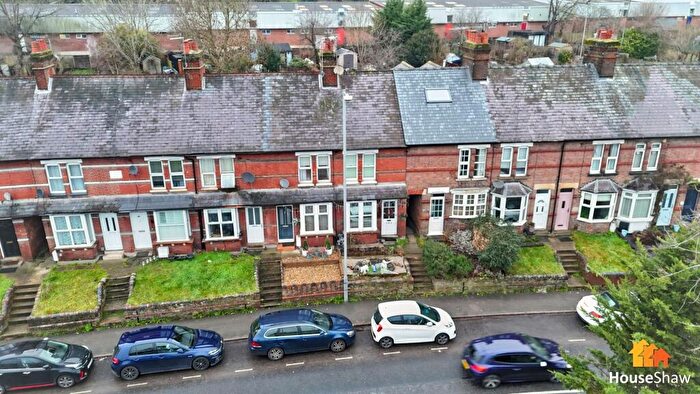
Houses for sale & to rent in St Marys And Waterside, Chesham
House Prices in St Marys And Waterside
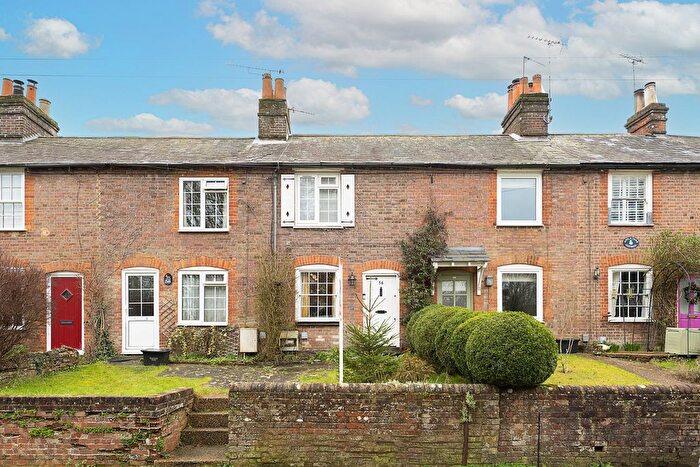
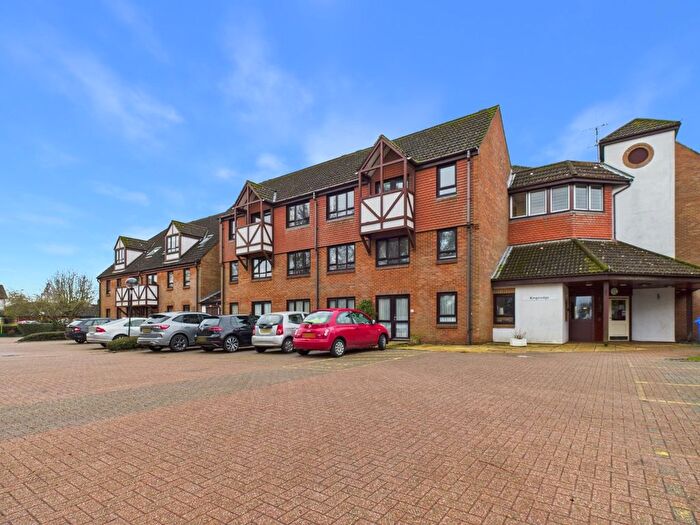
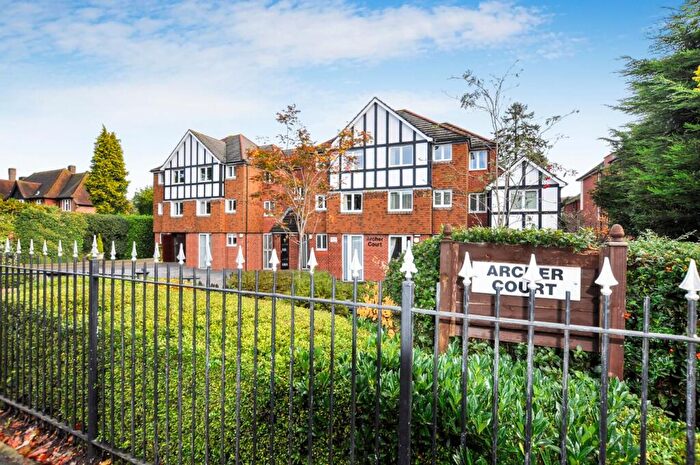
Properties in St Marys And Waterside have an average house price of £401,292.00 and had 211 Property Transactions within the last 3 years¹.
St Marys And Waterside is an area in Chesham, Buckinghamshire with 1,958 households², where the most expensive property was sold for £1,250,000.00.
Properties for sale in St Marys And Waterside
Roads and Postcodes in St Marys And Waterside
Navigate through our locations to find the location of your next house in St Marys And Waterside, Chesham for sale or to rent.
| Streets | Postcodes |
|---|---|
| Amersham Road | HP5 1NE |
| Amy Lane | HP5 1NA HP5 1NB |
| Appletree Walk | HP5 1SY |
| Blackhorse Avenue | HP5 1QU |
| Bois Hill | HP5 1TB |
| Bois Mill | HP5 1TP |
| Bois Moor Road | HP5 1SH HP5 1SN HP5 1SS HP5 1SU |
| Box Tree Close | HP5 1RZ |
| Bury Lane | HP5 1HX |
| Cannon Mill Avenue | HP5 1QX |
| Cavendish Road | HP5 1RW |
| Chessbury Road | HP5 1JR HP5 1JT |
| Chessmount Rise | HP5 1RB HP5 1RF HP5 1RJ |
| Church Street | HP5 1HT HP5 1HU HP5 1HY HP5 1JD |
| Cooks Yard | HP5 1FA |
| Cressbed Villas | HP5 1TJ |
| Cresswell Road | HP5 1SX HP5 1TA |
| Delmeade Road | HP5 1JS |
| Drydell Lane | HP5 2JT |
| East Street | HP5 1BP HP5 1DA |
| Eunice Grove | HP5 1RL |
| Five Acres | HP5 1NN |
| Forelands Way | HP5 1QP HP5 1QR |
| Fryer Close | HP5 1RD |
| Fullers Close | HP5 1LT HP5 1LU |
| Fullers Grove | HP5 1LR |
| Fullers Hill | HP5 1LS |
| Germain Street | HP5 1LH HP5 1LW |
| Germains Close | HP5 1JJ |
| Glebe Cottages | HP5 1LY |
| Gordon Road | HP5 1PL |
| High Street | HP5 1BW HP5 1BX HP5 1EB HP5 1EF HP5 1EP |
| Hill Farm Road | HP5 1QT |
| Hodds Wood Road | HP5 1SQ |
| Hospital Hill | HP5 1DX HP5 1PJ |
| Inkerman Terrace | HP5 1QA |
| Kesters Road | HP5 1RP |
| King Street | HP5 1LZ |
| Larks Rise | HP5 1RG |
| Latimer Road | HP5 1QH HP5 1QQ HP5 1TH HP5 1TL |
| Market Square | HP5 1ES HP5 1HG |
| Meades Lane | HP5 1ND |
| Mill Close | HP5 1QL |
| Millfields | HP5 1SG |
| Mineral Lane | HP5 1NL |
| Missenden Road | HP5 1JL HP5 1JY HP5 1JZ |
| Moor Road | HP5 1SA HP5 1SE |
| Pednor Road | HP5 2JU HP5 2SS |
| Pednormead End | HP5 2JS |
| Pheasant Rise | HP5 1LX HP5 1NS HP5 1NT |
| Rachels Way | HP5 1SZ |
| Red Lion Street | HP5 1EZ |
| Reynolds Yard | HP5 1JB |
| Riverside Court | HP5 1PX |
| Rose Drive | HP5 1RN HP5 1RR HP5 1RS HP5 1RT |
| Ryecroft Road | HP5 1JX |
| Shantung Place | HP5 1SF |
| Shepherds Way | HP5 1RH |
| Springfield Close | HP5 1PU |
| Springfield Road | HP5 1PW |
| Station Road | HP5 1DB HP5 1DH |
| Town Bridge Court | HP5 1LN |
| Trapps Lane | HP5 1NP |
| Water Meadow | HP5 1JA |
| Waterside | HP5 1PD HP5 1PE HP5 1PF HP5 1PG HP5 1PR HP5 1PY HP5 1QD HP5 1QE HP5 1QF HP5 1QG |
| Wentworth Place | HP5 1PN |
| Wey Lane | HP5 1JH |
| Whichcote Gardens | HP5 1NW |
| White Lion Yard | HP5 1EY |
| Woodland View | HP5 1NR |
| Woodley Hill | HP5 1SL HP5 1SP |
Transport near St Marys And Waterside
- FAQ
- Price Paid By Year
- Property Type Price
Frequently asked questions about St Marys And Waterside
What is the average price for a property for sale in St Marys And Waterside?
The average price for a property for sale in St Marys And Waterside is £401,292. This amount is 19% lower than the average price in Chesham. There are 2,325 property listings for sale in St Marys And Waterside.
What streets have the most expensive properties for sale in St Marys And Waterside?
The streets with the most expensive properties for sale in St Marys And Waterside are Pednor Road at an average of £1,081,000, King Street at an average of £838,750 and Amersham Road at an average of £775,000.
What streets have the most affordable properties for sale in St Marys And Waterside?
The streets with the most affordable properties for sale in St Marys And Waterside are Town Bridge Court at an average of £126,571, Station Road at an average of £146,000 and Riverside Court at an average of £185,000.
Which train stations are available in or near St Marys And Waterside?
Some of the train stations available in or near St Marys And Waterside are Amersham and Chalfont and Latimer.
Which tube stations are available in or near St Marys And Waterside?
Some of the tube stations available in or near St Marys And Waterside are Chesham, Amersham and Chalfont and Latimer.
Property Price Paid in St Marys And Waterside by Year
The average sold property price by year was:
| Year | Average Sold Price | Price Change |
Sold Properties
|
|---|---|---|---|
| 2025 | £371,920 | -1% |
56 Properties |
| 2024 | £377,129 | -16% |
68 Properties |
| 2023 | £439,085 | -1% |
87 Properties |
| 2022 | £445,363 | 11% |
82 Properties |
| 2021 | £396,416 | 8% |
115 Properties |
| 2020 | £366,446 | -2% |
71 Properties |
| 2019 | £374,720 | 6% |
81 Properties |
| 2018 | £351,360 | -6% |
96 Properties |
| 2017 | £371,716 | 2% |
92 Properties |
| 2016 | £364,228 | 20% |
86 Properties |
| 2015 | £292,958 | 12% |
115 Properties |
| 2014 | £256,913 | -2% |
112 Properties |
| 2013 | £261,714 | -4% |
99 Properties |
| 2012 | £272,733 | 17% |
71 Properties |
| 2011 | £226,268 | -11% |
69 Properties |
| 2010 | £250,940 | 13% |
86 Properties |
| 2009 | £217,295 | -15% |
69 Properties |
| 2008 | £249,824 | 3% |
53 Properties |
| 2007 | £242,902 | 10% |
146 Properties |
| 2006 | £219,146 | 16% |
136 Properties |
| 2005 | £184,151 | -14% |
100 Properties |
| 2004 | £209,698 | 8% |
100 Properties |
| 2003 | £192,891 | 10% |
103 Properties |
| 2002 | £172,909 | 9% |
145 Properties |
| 2001 | £156,570 | 4% |
120 Properties |
| 2000 | £150,263 | 15% |
113 Properties |
| 1999 | £127,880 | 13% |
124 Properties |
| 1998 | £111,567 | 15% |
97 Properties |
| 1997 | £94,946 | 11% |
101 Properties |
| 1996 | £84,731 | -1% |
123 Properties |
| 1995 | £85,266 | - |
87 Properties |
Property Price per Property Type in St Marys And Waterside
Here you can find historic sold price data in order to help with your property search.
The average Property Paid Price for specific property types in the last three years are:
| Property Type | Average Sold Price | Sold Properties |
|---|---|---|
| Semi Detached House | £468,998.00 | 43 Semi Detached Houses |
| Detached House | £775,026.00 | 19 Detached Houses |
| Terraced House | £411,966.00 | 87 Terraced Houses |
| Flat | £224,827.00 | 62 Flats |

