
Houses for sale & to rent in Ridgeway East, High Wycombe
House Prices in Ridgeway East
Properties in Ridgeway East have an average house price of £435k and had 12 Property Transactions within the last 3 years¹.
Ridgeway East is an area in High Wycombe, Buckinghamshire with 224 households², where the most expensive property was sold for £620k.
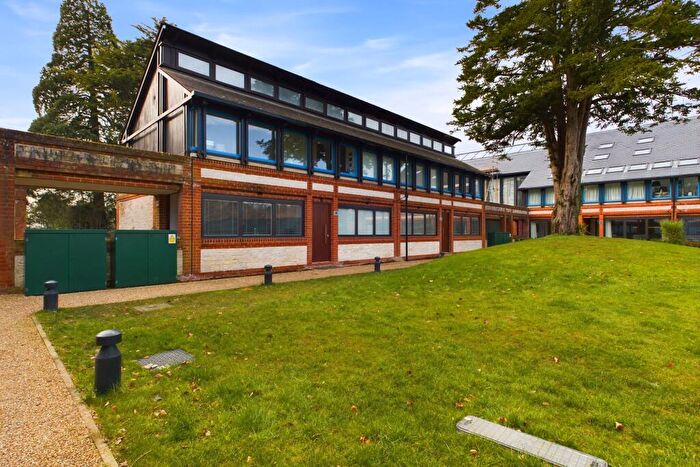
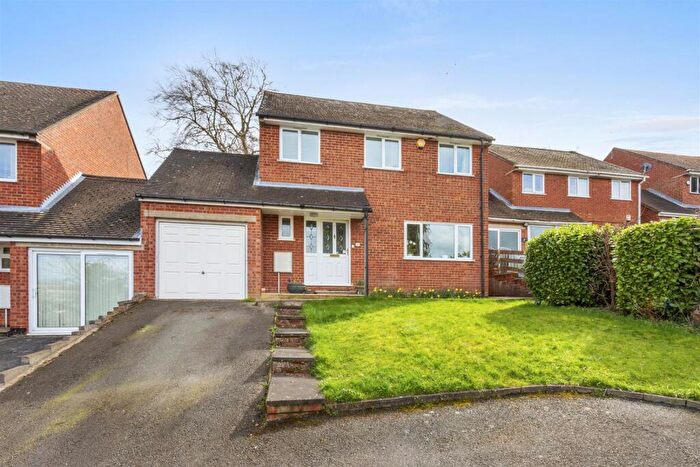
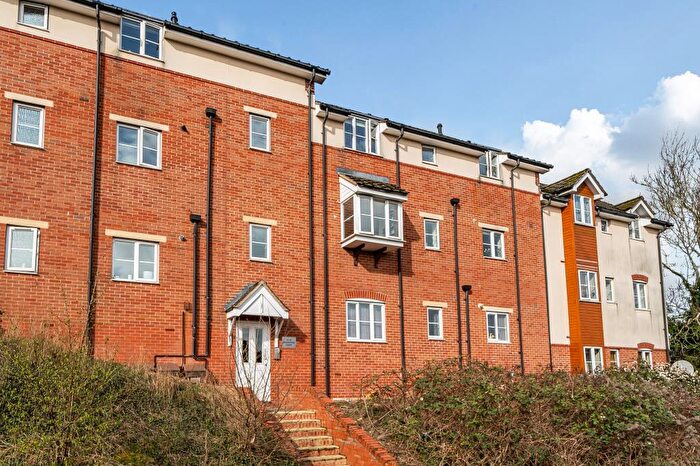
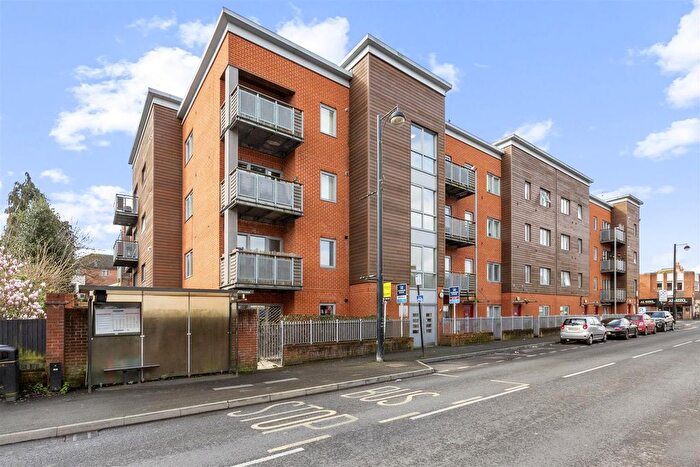
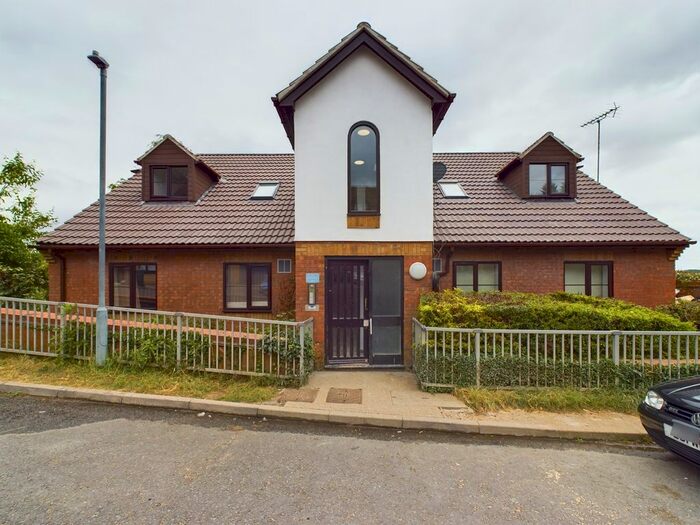
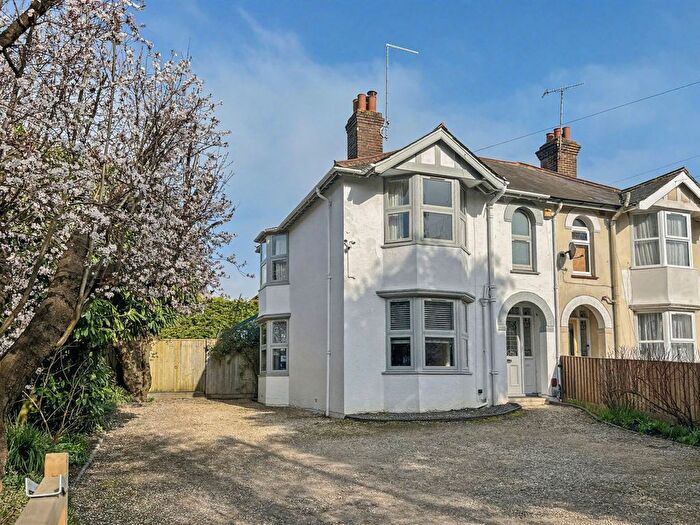
Properties for sale in Ridgeway East
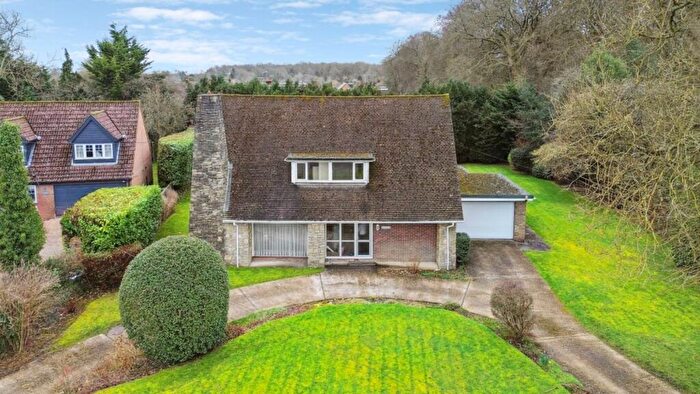
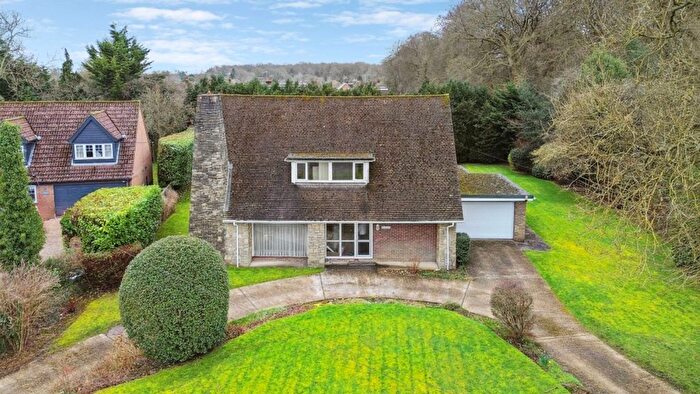


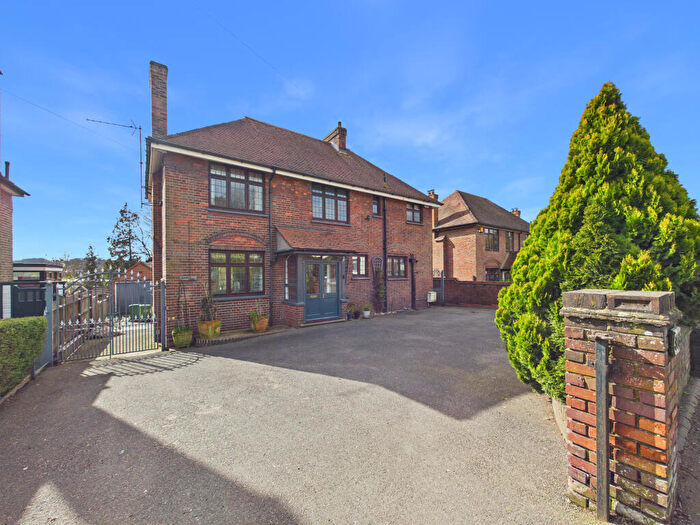
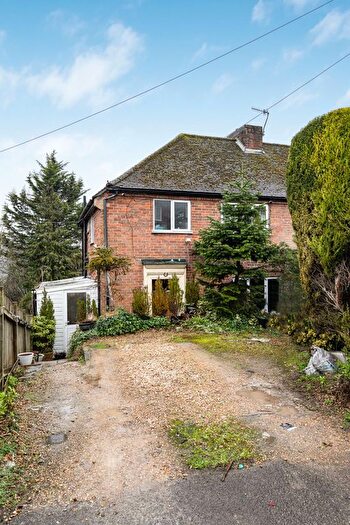
![]()
If you are looking to sell your house, let it out, or receive a property valuation, an expert can help you.
Click the button below to get started.


Roads and Postcodes in Ridgeway East
Navigate through our locations to find the location of your next house in Ridgeway East, High Wycombe for sale or to rent.
| Streets | Postcodes |
|---|---|
| Bradenham Woods Lane | HP14 4XP |
| Fir Tree Cottages | HP14 4TY |
| Four Ashes Road | HP15 6LB HP15 6DY |
| Georges Hill | HP15 6DB |
| Great Kingshill | HP15 6ES |
| Hughenden Park | HP14 4LA |
| Janes Way | HP14 4EN |
| Kilnwood | HP14 4UN HP14 4UP HP14 4UR HP14 4UT HP14 4UW |
| Le Flaive Business Park | HP14 4US |
| Main Road | HP14 4SX HP14 4TS HP14 4UX |
| Naphill Common | HP14 4RQ |
| Pipers Lane | HP15 6LP |
| Silver Birch Caravan Site | HP14 4UY |
| Smiths Road | HP14 4EL |
| Stocking Lane | HP14 4NB HP14 4ND |
| Windmill Lane | HP15 6NX |
| Woodcock Avenue | HP14 4TN HP14 4TP HP14 4TW |
| HP14 4DQ HP14 4UL |
Transport near Ridgeway East

- FAQ
- Price Paid By Year
- Property Type Price
Frequently asked questions about Ridgeway East
What is the average price for a property for sale in Ridgeway East?
The average price for a property for sale in Ridgeway East is £435,458. This amount is 6% lower than the average price in High Wycombe. There are 2,962 property listings for sale in Ridgeway East.
Which train stations are available in or near Ridgeway East?
Some of the train stations available in or near Ridgeway East are Saunderton, High Wycombe and Great Missenden.
Property Price Paid in Ridgeway East by Year
The average sold property price by year was:
| Year | Average Sold Price | Price Change |
Sold Properties
|
|---|---|---|---|
| 2025 | £522,000 | 23% |
4 Properties |
| 2024 | £402,666 | 4% |
3 Properties |
| 2023 | £385,900 | -232% |
5 Properties |
| 2022 | £1,280,000 | 70% |
3 Properties |
| 2021 | £378,125 | -14% |
12 Properties |
| 2020 | £431,872 | 22% |
11 Properties |
| 2019 | £335,000 | -14% |
3 Properties |
| 2018 | £381,800 | 14% |
5 Properties |
| 2017 | £326,846 | -3% |
49 Properties |
| 2016 | £335,274 | 13% |
24 Properties |
| 2015 | £291,001 | - |
14 Properties |
Property Price per Property Type in Ridgeway East
Here you can find historic sold price data in order to help with your property search.
The average Property Paid Price for specific property types in the last three years are:
| Property Type | Average Sold Price | Sold Properties |
|---|---|---|
| Semi Detached House | £508,166.00 | 6 Semi Detached Houses |
| Terraced House | £362,750.00 | 6 Terraced Houses |