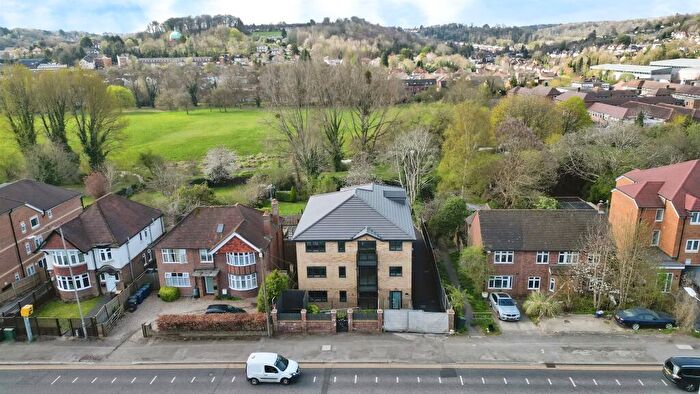
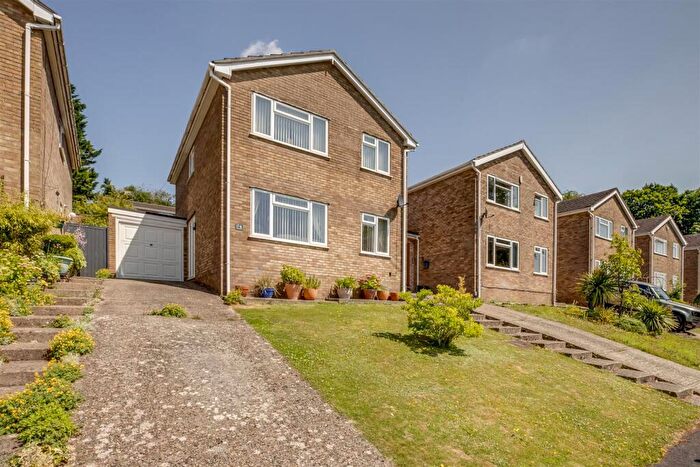
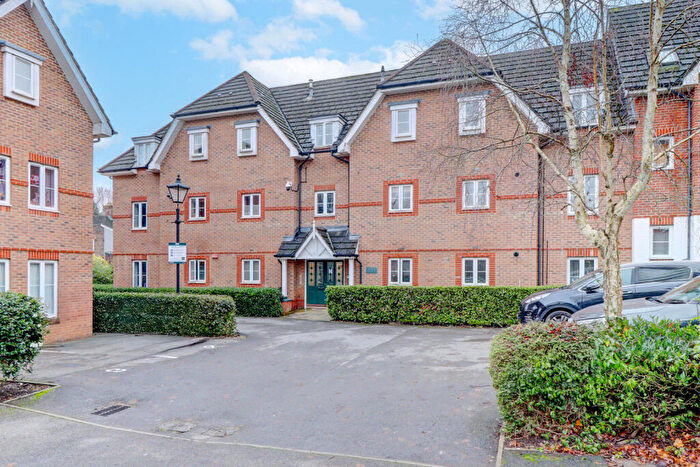
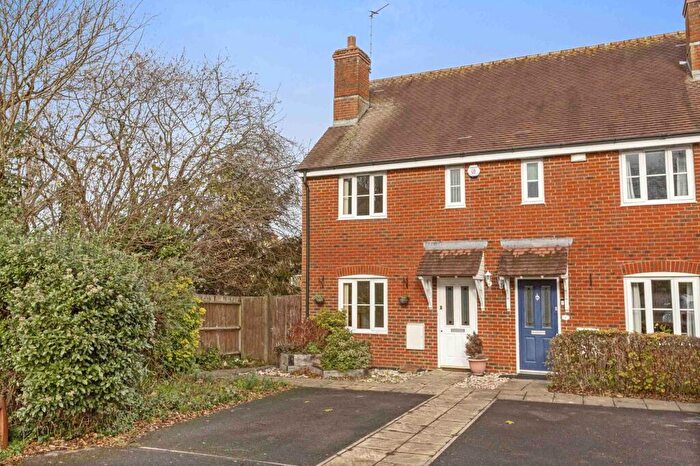
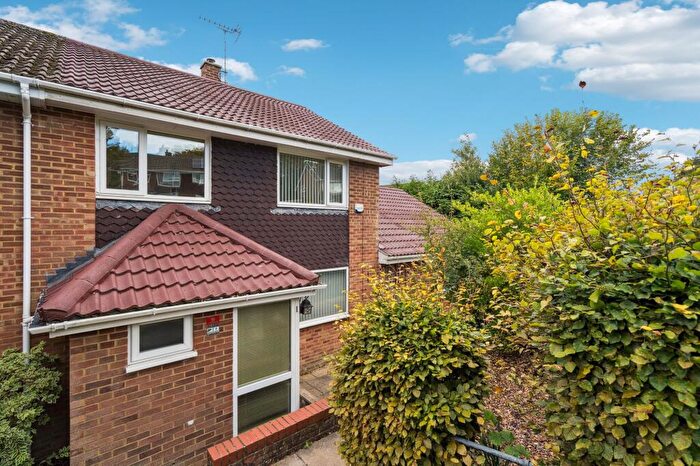
Houses for sale & to rent in Downley And Plomer Hill, High Wycombe
House Prices in Downley And Plomer Hill
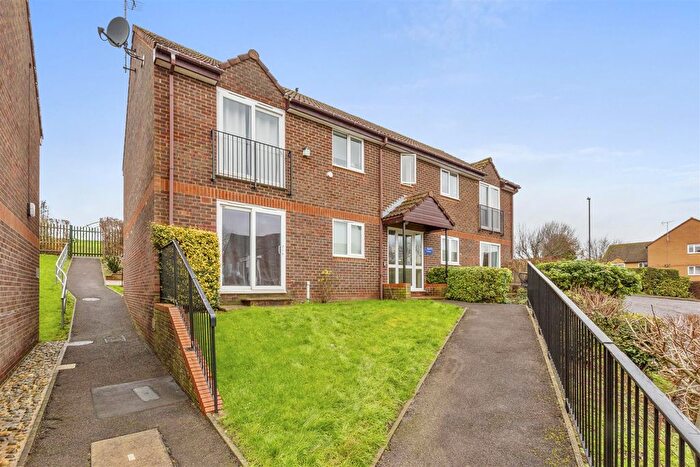
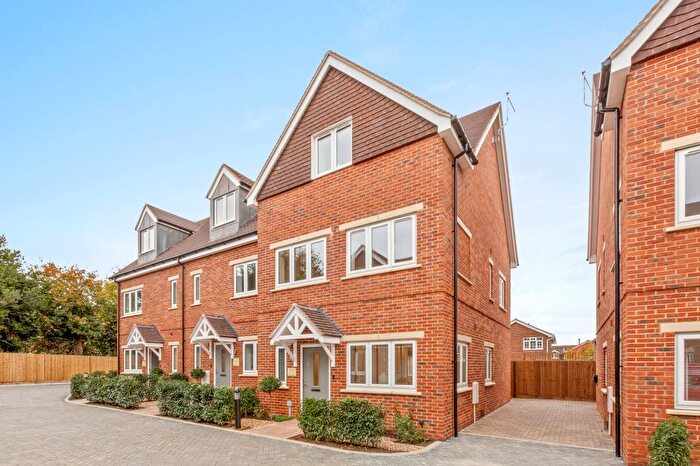
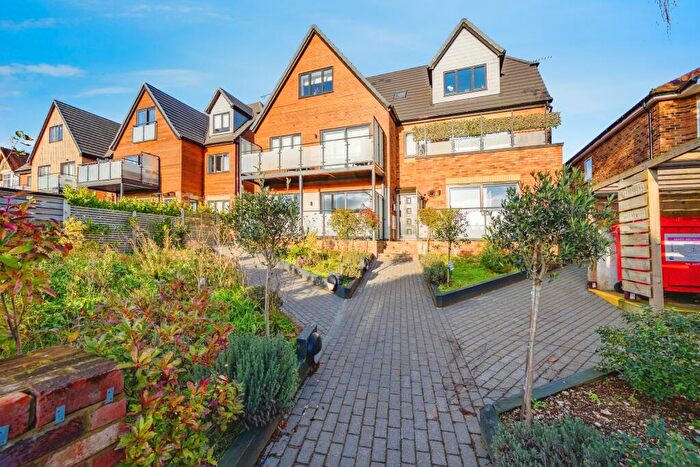
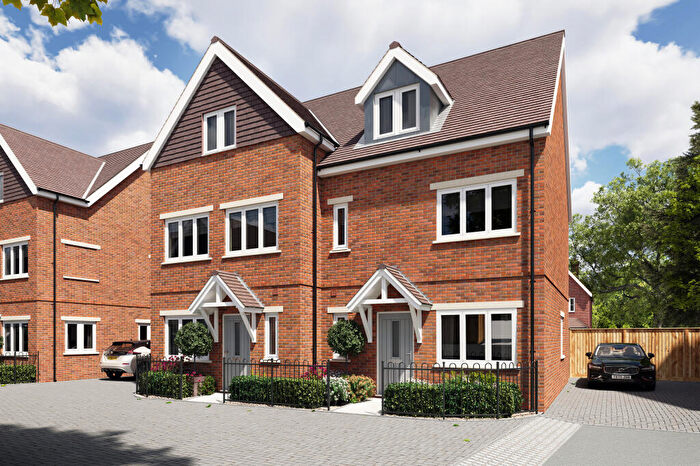
Properties in Downley And Plomer Hill have an average house price of £490,600.00 and had 228 Property Transactions within the last 3 years¹.
Downley And Plomer Hill is an area in High Wycombe, Buckinghamshire with 1,925 households², where the most expensive property was sold for £1,000,000.00.
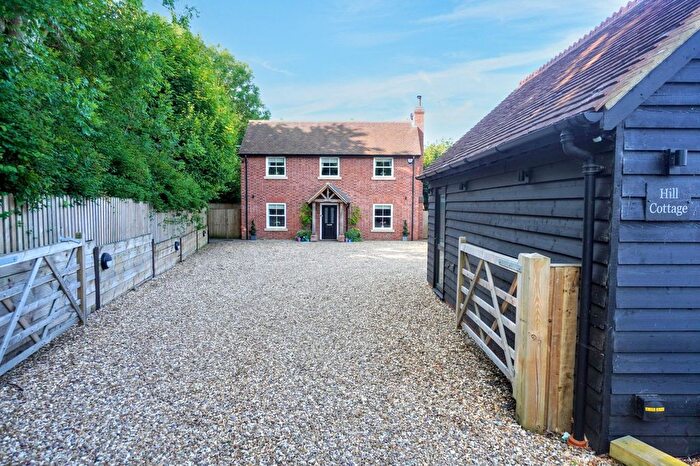
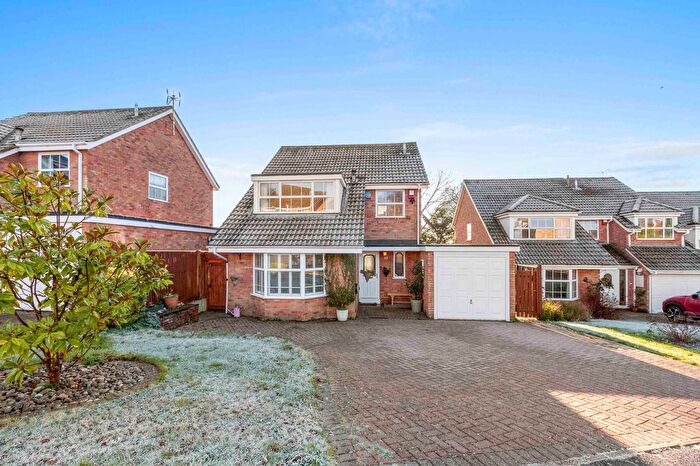
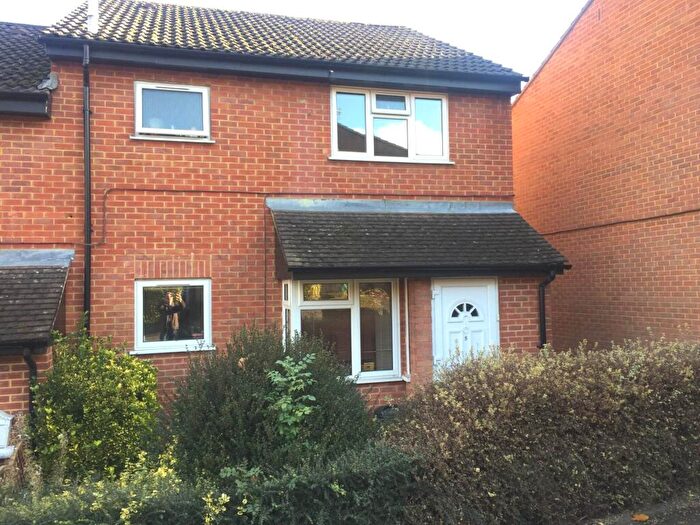
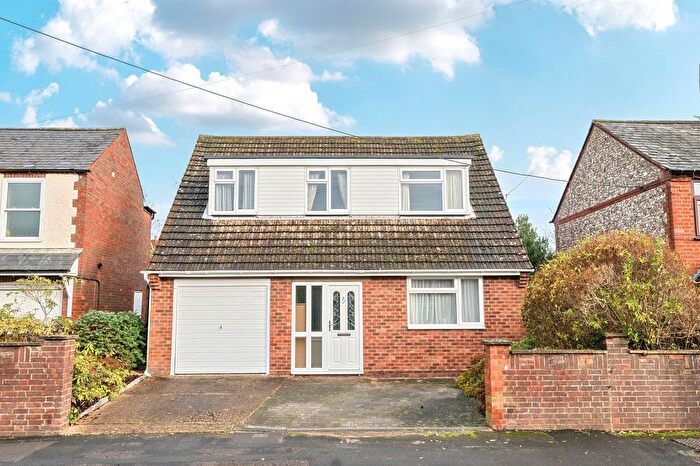
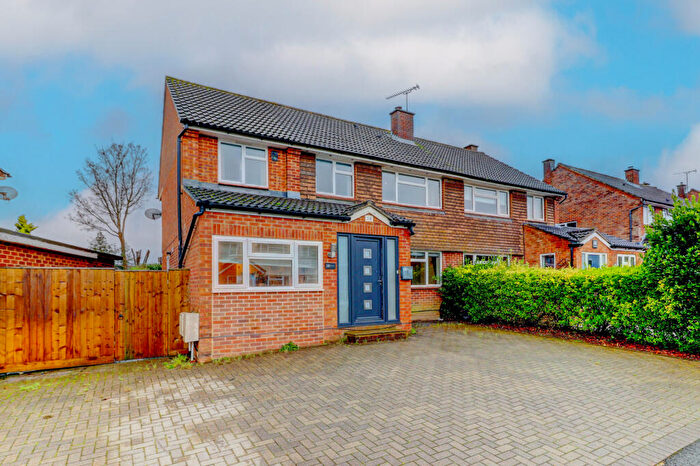
Properties for sale in Downley And Plomer Hill
Roads and Postcodes in Downley And Plomer Hill
Navigate through our locations to find the location of your next house in Downley And Plomer Hill, High Wycombe for sale or to rent.
| Streets | Postcodes |
|---|---|
| Avery Avenue | HP13 5UE |
| Bowler Lea | HP13 5UD |
| Brenchwood Close | HP13 5UP |
| Chapel Street | HP13 5XH |
| Commonside | HP13 5XG HP13 5YA |
| Coronation Cottages | HP13 5YQ |
| Court Close | HP13 5JF |
| Cross Court | HP13 5UW |
| Curlew Close | HP13 5JY |
| Downley Common | HP13 5YN |
| Downs Park | HP13 5LU HP13 5LX |
| Falcon Rise | HP13 5JT |
| Faulkner Way | HP13 5UA |
| Ford Way | HP13 5XW |
| Golf Link Cottages | HP13 5YJ |
| Golf Link Villas | HP13 5YH |
| Gosling Grove | HP13 5UF HP13 5YS |
| Grays Lane | HP13 5TL HP13 5TZ HP13 5UG |
| Green Leys | HP13 5UH |
| Greenwoods | HP13 5YG |
| Heather Cottages | HP13 5YF |
| High Street | HP13 5XJ |
| Hillfield Close | HP13 5NA |
| Hithercroft Road | HP13 5LS HP13 5LT |
| Jubilee Road | HP13 5TP HP13 5TW |
| Kestrel Close | HP13 5JN |
| Littleworth Road | HP13 5LR HP13 5UY HP13 5UZ HP13 5XA HP13 5XB |
| Lyndhurst Close | HP13 5JD |
| Merry Down | HP13 5NQ |
| Middlebrook Road | HP13 5NH HP13 5NJ HP13 5NL |
| Mines Close | HP13 5TQ |
| Mole Run | HP13 5JJ |
| Moor Lane | HP13 5YP |
| Narrow Lane | HP13 5XP |
| Old Farm Road | HP13 5LP |
| Partridge Way | HP13 5JX |
| Pheasant Drive | HP13 5JH HP13 5JL HP13 5JP HP13 5JW |
| Plomer Green Avenue | HP13 5LN HP13 5LW |
| Plomer Green Lane | HP13 5TN HP13 5TS HP13 5TT HP13 5TU HP13 5XN |
| Plomer Hill | HP13 5JG HP13 5JQ HP13 5LL HP13 5NB |
| Red Kite Close | HP13 5GN |
| School Close | HP13 5TR |
| Selwood Way | HP13 5XR |
| South View | HP13 5UL |
| Southfield Road | HP13 5JZ HP13 5LA HP13 5LB HP13 5LD |
| Sunny Croft | HP13 5UQ |
| Sunnycroft | HP13 5UR |
| Talbot Avenue | HP13 5HZ HP13 5JA |
| Taylors Turn | HP13 5TY |
| The Cherry Pit | HP13 5FA |
| The Common | HP13 5XQ HP13 5YD HP13 5YE HP13 5YL HP13 5YW |
| The Pastures | HP13 5LY HP13 5LZ |
| Tilbury Wood Close | HP13 5UT |
| Turners Field | HP13 5YZ |
| West Court | HP13 5TG |
| Westover Court | HP13 5JE |
| Westover Road | HP13 5HX HP13 5HY HP13 5JB |
| White Close | HP13 5ND HP13 5NG |
| Willoughbys Walk | HP13 5UB |
| Woodcote Green | HP13 5UN |
Transport near Downley And Plomer Hill
- FAQ
- Price Paid By Year
- Property Type Price
Frequently asked questions about Downley And Plomer Hill
What is the average price for a property for sale in Downley And Plomer Hill?
The average price for a property for sale in Downley And Plomer Hill is £490,600. This amount is 7% higher than the average price in High Wycombe. There are 915 property listings for sale in Downley And Plomer Hill.
What streets have the most expensive properties for sale in Downley And Plomer Hill?
The streets with the most expensive properties for sale in Downley And Plomer Hill are Moor Lane at an average of £850,000, Sunnycroft at an average of £733,250 and The Common at an average of £716,250.
What streets have the most affordable properties for sale in Downley And Plomer Hill?
The streets with the most affordable properties for sale in Downley And Plomer Hill are High Street at an average of £170,000, Red Kite Close at an average of £212,500 and Falcon Rise at an average of £374,777.
Which train stations are available in or near Downley And Plomer Hill?
Some of the train stations available in or near Downley And Plomer Hill are High Wycombe, Saunderton and Great Missenden.
Property Price Paid in Downley And Plomer Hill by Year
The average sold property price by year was:
| Year | Average Sold Price | Price Change |
Sold Properties
|
|---|---|---|---|
| 2025 | £477,171 | - |
38 Properties |
| 2024 | £477,077 | -6% |
71 Properties |
| 2023 | £505,687 | 1% |
52 Properties |
| 2022 | £500,839 | 10% |
67 Properties |
| 2021 | £452,305 | 11% |
80 Properties |
| 2020 | £403,944 | -2% |
62 Properties |
| 2019 | £412,451 | -3% |
70 Properties |
| 2018 | £423,150 | -3% |
78 Properties |
| 2017 | £435,175 | 11% |
76 Properties |
| 2016 | £388,779 | 6% |
73 Properties |
| 2015 | £365,817 | 13% |
74 Properties |
| 2014 | £317,353 | 9% |
79 Properties |
| 2013 | £290,094 | -0,2% |
69 Properties |
| 2012 | £290,619 | 10% |
59 Properties |
| 2011 | £261,426 | -3% |
81 Properties |
| 2010 | £269,358 | 5% |
84 Properties |
| 2009 | £255,189 | -0,3% |
92 Properties |
| 2008 | £255,976 | -9% |
61 Properties |
| 2007 | £279,518 | 8% |
112 Properties |
| 2006 | £256,045 | 8% |
111 Properties |
| 2005 | £235,531 | 4% |
71 Properties |
| 2004 | £226,898 | 7% |
79 Properties |
| 2003 | £211,431 | 5% |
86 Properties |
| 2002 | £200,132 | 15% |
101 Properties |
| 2001 | £170,204 | 12% |
116 Properties |
| 2000 | £149,849 | 12% |
102 Properties |
| 1999 | £131,473 | 9% |
130 Properties |
| 1998 | £119,363 | 8% |
122 Properties |
| 1997 | £109,304 | 13% |
111 Properties |
| 1996 | £95,203 | 1% |
97 Properties |
| 1995 | £94,401 | - |
91 Properties |
Property Price per Property Type in Downley And Plomer Hill
Here you can find historic sold price data in order to help with your property search.
The average Property Paid Price for specific property types in the last three years are:
| Property Type | Average Sold Price | Sold Properties |
|---|---|---|
| Semi Detached House | £473,729.00 | 99 Semi Detached Houses |
| Detached House | £611,666.00 | 69 Detached Houses |
| Terraced House | £404,535.00 | 50 Terraced Houses |
| Flat | £252,600.00 | 10 Flats |

