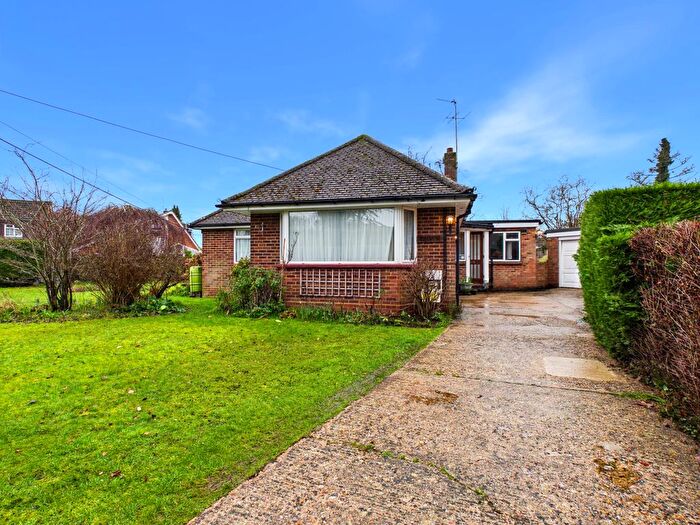
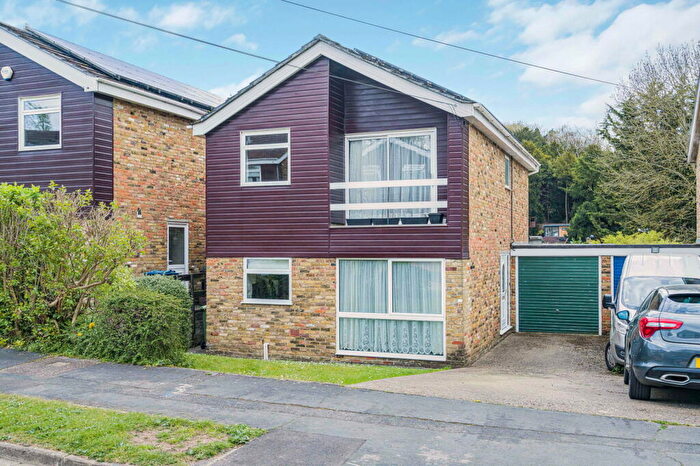
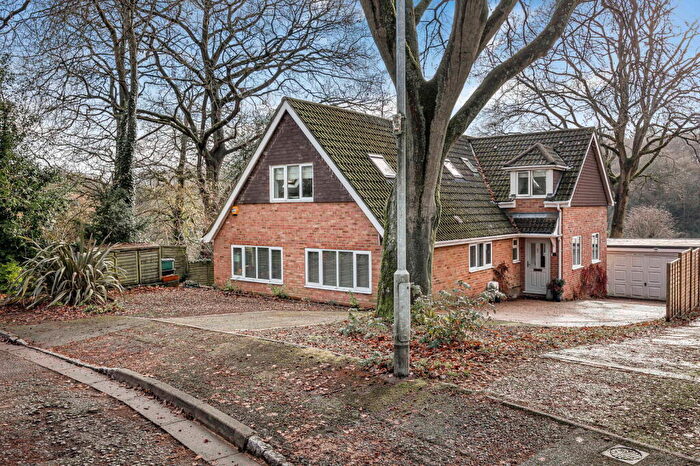
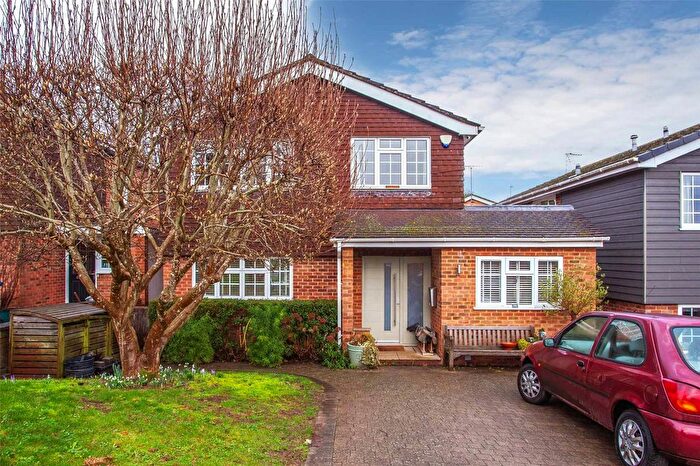
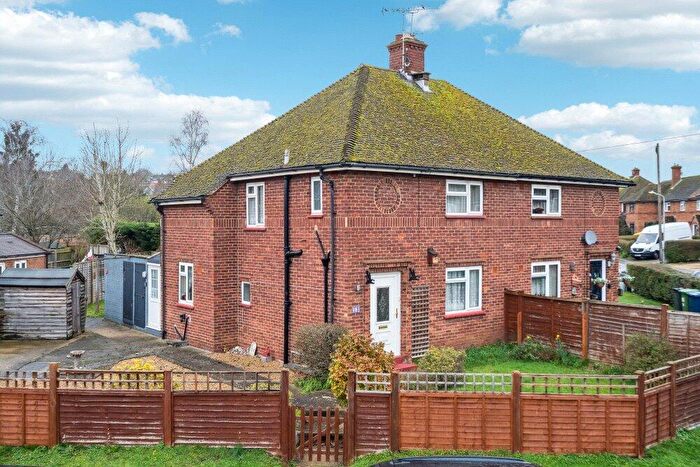
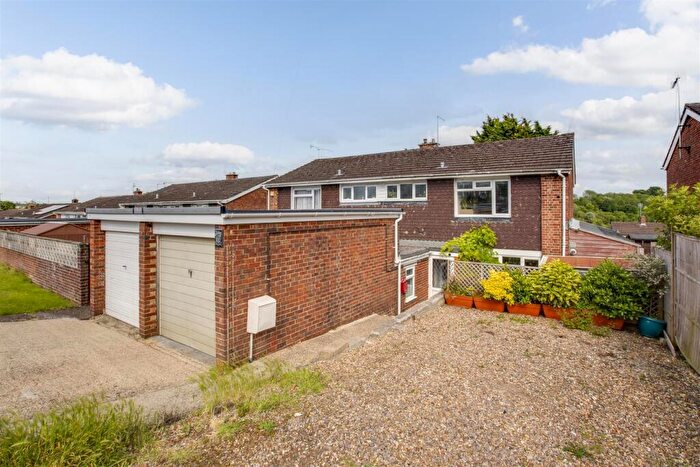
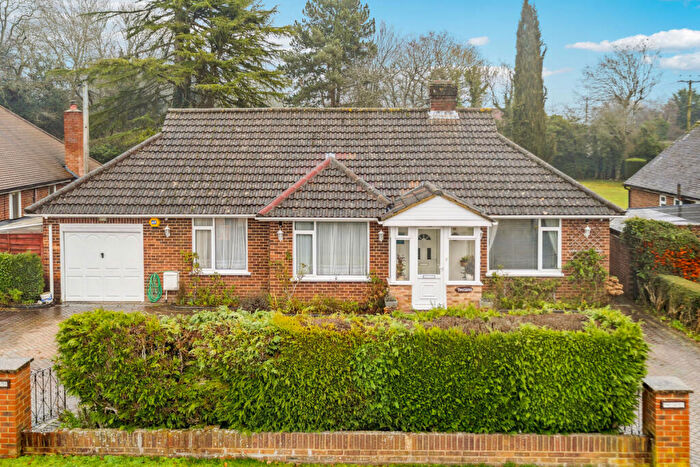
Houses for sale & to rent in Greater Marlow, Marlow
House Prices in Greater Marlow
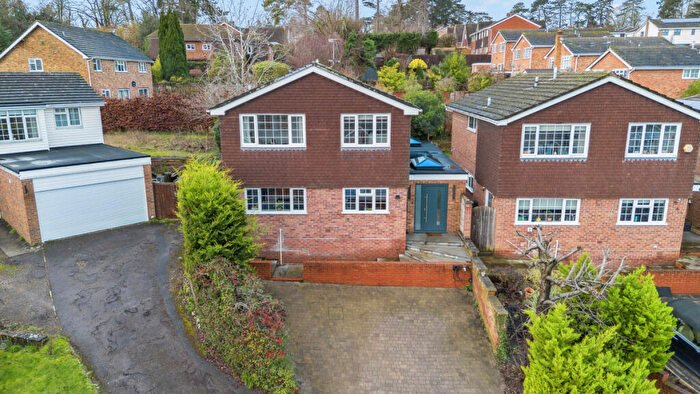
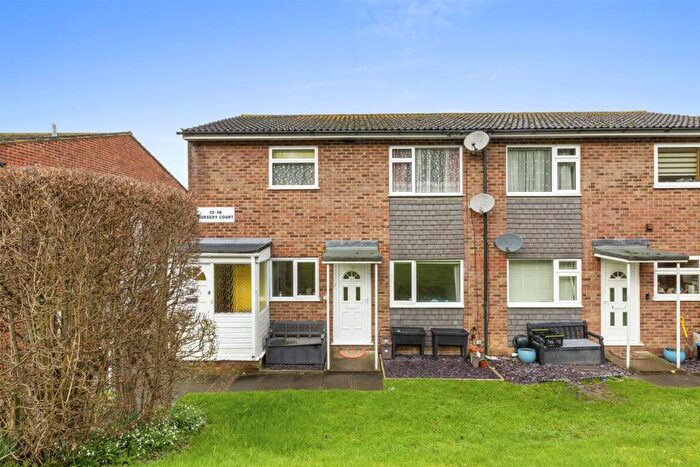
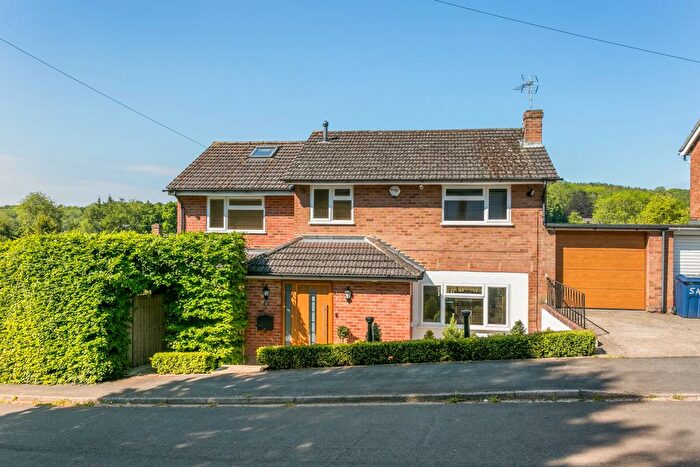
Properties in Greater Marlow have an average house price of £823,201.00 and had 135 Property Transactions within the last 3 years¹.
Greater Marlow is an area in Marlow, Buckinghamshire with 1,632 households², where the most expensive property was sold for £4,000,000.00.
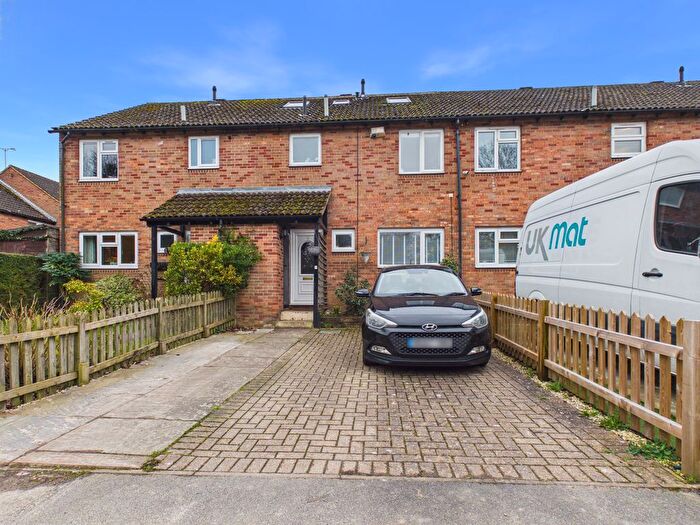
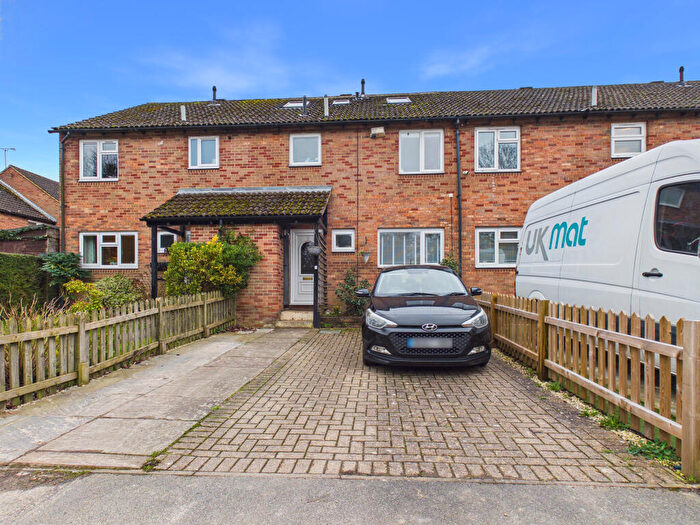
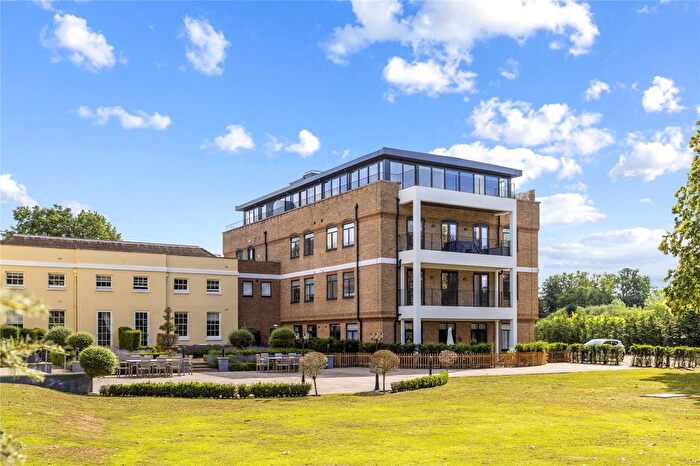
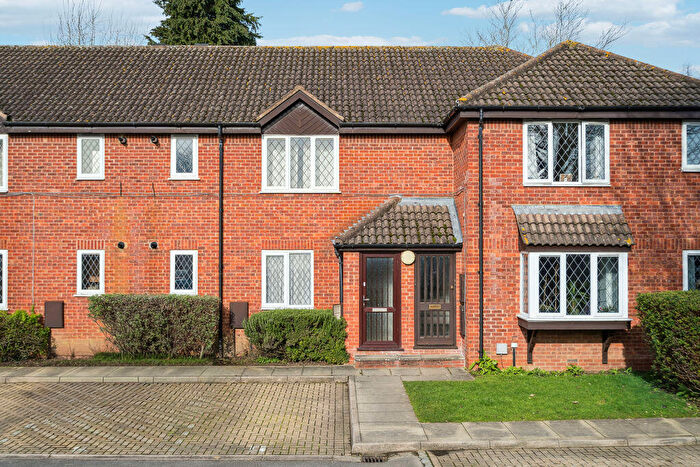
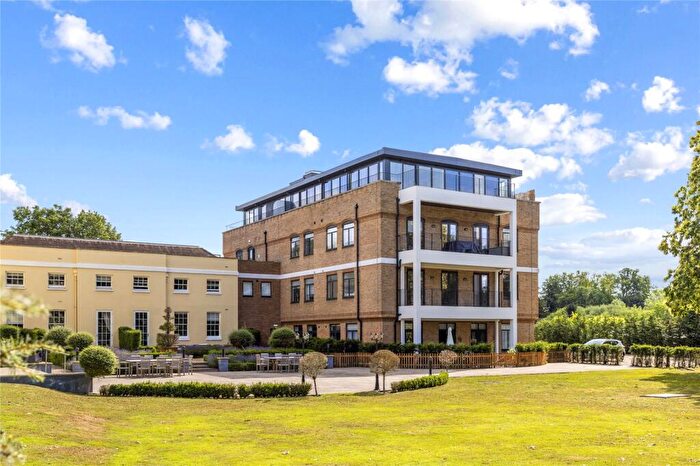
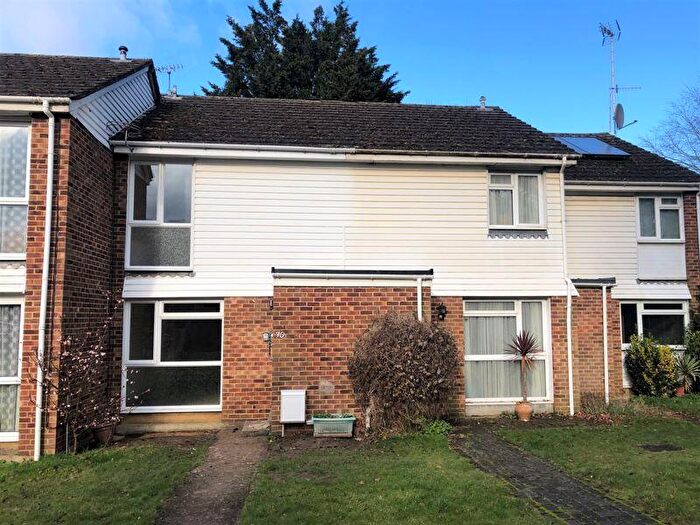
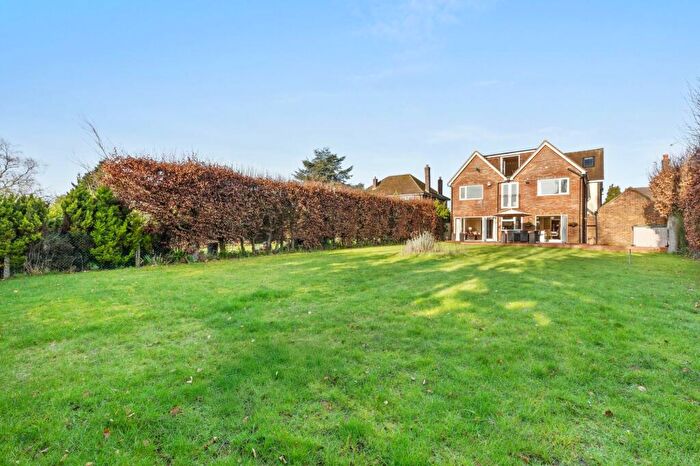
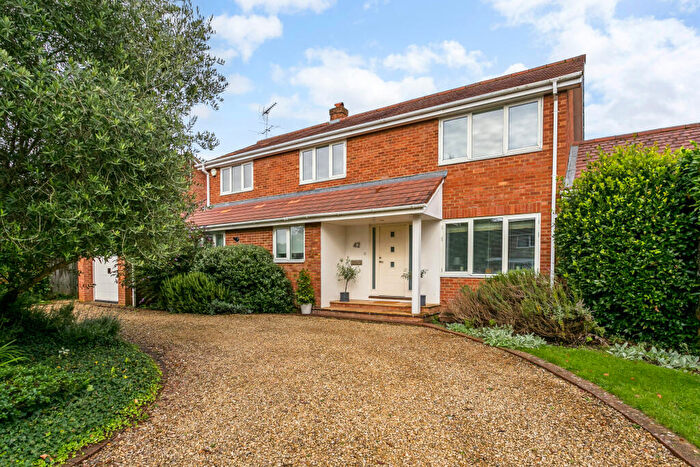
Properties for sale in Greater Marlow
Roads and Postcodes in Greater Marlow
Navigate through our locations to find the location of your next house in Greater Marlow, Marlow for sale or to rent.
| Streets | Postcodes |
|---|---|
| Andrews Way | SL7 3QJ |
| Badgebury Rise | SL7 3QA |
| Badgers Way | SL7 3QU |
| Beech Tree Avenue | SL7 3NH |
| Beechtree Avenue | SL7 3NJ |
| Bencombe Road | SL7 3NZ |
| Bovingdon Green | SL7 2JH SL7 2JJ SL7 2JL |
| Brucewood Parade | SL7 3PE |
| Burford Close | SL7 3NE SL7 3NF |
| Cedar Drive | SL7 3QB |
| Chalkpit Lane | SL7 2JE |
| Clay Lane | SL7 3DJ |
| Claymoor Park | SL7 3DL |
| Finnamore Wood Camp | SL7 2HU |
| Frieth Road | SL7 2HP SL7 2HT SL7 2JF SL7 2JG SL7 2JQ SL7 2QT SL7 2QU |
| Goodwood Rise | SL7 3QE |
| Harleyford | SL7 2SL SL7 2SN |
| Hazel Close | SL7 3PW |
| Hazlewoode Cotts | SL7 3DU |
| Henley Road | SL7 2EB SL7 2EN |
| High Beeches Close | SL7 3PX |
| High Heavens Wood | SL7 3QQ |
| High View Close | SL7 3QN |
| Highwoods Close | SL7 3PG |
| Highwoods Drive | SL7 3PU SL7 3PY |
| Hill Farm Road | SL7 3LU SL7 3LX |
| Home Wood | SL7 2SW |
| Juniper Road | SL7 3NX |
| Kingsley Drive | SL7 3QR |
| Lea Close | SL7 3PD |
| Marlow Bottom | SL7 3LY SL7 3LZ SL7 3NA SL7 3NB SL7 3NT SL7 3PH SL7 3PS SL7 3PT SL7 3QF SL7 3QG |
| Marlow Bottom Road | SL7 3PJ SL7 3PL SL7 3PP SL7 3PR SL7 3PZ SL7 3QD SL7 3QH |
| Marlow Common | SL7 2QP SL7 2QR |
| Marlow Road | SL7 3DQ |
| Maytree Close | SL7 3YA |
| Meadow View | SL7 3PA |
| Monks Hollow | SL7 3SY |
| Mountain Ash | SL7 3PB |
| Munces Road | SL7 3NY |
| Mundaydean Lane | SL7 3BT SL7 3BU |
| New Road | SL7 3NG SL7 3NN SL7 3NQ SL7 3NW |
| Olivers Paddock | SL7 3NS |
| Pheasants Ridge | SL7 3QT |
| Ragmans Close | SL7 3QW |
| Seymour Court Lane | SL7 3DD |
| Seymour Court Road | SL7 3DB |
| Seymour Plain | SL7 3BY SL7 3BZ SL7 3DA |
| Shillingridge Park | SL7 2QX |
| Squirrel Rise | SL7 3PN |
| Stewarts Way | SL7 3QL |
| Sycamore Drive | SL7 3NL |
| The Lakes | SL7 2DX |
| Uplands | SL7 3NU |
| White Hill Close | SL7 3QP |
| White Lodge Close | SL7 3QY |
| Widmere Lane | SL7 3DF |
| Wittington Green | SL7 2ES |
| Wynnstay Gardens | SL7 3NR |
Transport near Greater Marlow
- FAQ
- Price Paid By Year
- Property Type Price
Frequently asked questions about Greater Marlow
What is the average price for a property for sale in Greater Marlow?
The average price for a property for sale in Greater Marlow is £823,201. This amount is 7% higher than the average price in Marlow. There are 3,069 property listings for sale in Greater Marlow.
What streets have the most expensive properties for sale in Greater Marlow?
The streets with the most expensive properties for sale in Greater Marlow are The Lakes at an average of £2,120,000, Marlow Common at an average of £1,900,000 and Bovingdon Green at an average of £1,815,000.
What streets have the most affordable properties for sale in Greater Marlow?
The streets with the most affordable properties for sale in Greater Marlow are Brucewood Parade at an average of £192,500, Kingsley Drive at an average of £435,833 and Maytree Close at an average of £472,500.
Which train stations are available in or near Greater Marlow?
Some of the train stations available in or near Greater Marlow are Marlow, High Wycombe and Bourne End.
Property Price Paid in Greater Marlow by Year
The average sold property price by year was:
| Year | Average Sold Price | Price Change |
Sold Properties
|
|---|---|---|---|
| 2025 | £684,371 | -30% |
39 Properties |
| 2024 | £889,866 | 3% |
58 Properties |
| 2023 | £863,932 | 6% |
38 Properties |
| 2022 | £808,333 | 5% |
58 Properties |
| 2021 | £767,476 | 13% |
88 Properties |
| 2020 | £666,558 | -3% |
51 Properties |
| 2019 | £685,647 | -20% |
47 Properties |
| 2018 | £823,094 | 11% |
42 Properties |
| 2017 | £735,933 | 13% |
54 Properties |
| 2016 | £637,266 | 9% |
62 Properties |
| 2015 | £580,889 | 7% |
55 Properties |
| 2014 | £542,299 | 2% |
51 Properties |
| 2013 | £528,987 | 9% |
65 Properties |
| 2012 | £483,944 | -11% |
45 Properties |
| 2011 | £536,126 | -7% |
51 Properties |
| 2010 | £575,990 | 27% |
53 Properties |
| 2009 | £420,141 | -13% |
39 Properties |
| 2008 | £472,812 | -4% |
32 Properties |
| 2007 | £490,895 | 14% |
85 Properties |
| 2006 | £421,768 | 8% |
92 Properties |
| 2005 | £388,663 | 0,3% |
72 Properties |
| 2004 | £387,498 | 11% |
70 Properties |
| 2003 | £344,594 | 11% |
76 Properties |
| 2002 | £306,861 | 7% |
84 Properties |
| 2001 | £285,076 | 6% |
86 Properties |
| 2000 | £267,758 | 14% |
77 Properties |
| 1999 | £229,280 | 13% |
88 Properties |
| 1998 | £199,338 | 5% |
84 Properties |
| 1997 | £190,203 | 28% |
96 Properties |
| 1996 | £137,496 | -4% |
93 Properties |
| 1995 | £142,807 | - |
59 Properties |
Property Price per Property Type in Greater Marlow
Here you can find historic sold price data in order to help with your property search.
The average Property Paid Price for specific property types in the last three years are:
| Property Type | Average Sold Price | Sold Properties |
|---|---|---|
| Semi Detached House | £581,375.00 | 20 Semi Detached Houses |
| Detached House | £892,910.00 | 107 Detached Houses |
| Flat | £263,333.00 | 3 Flats |
| Terraced House | £634,650.00 | 5 Terraced Houses |

