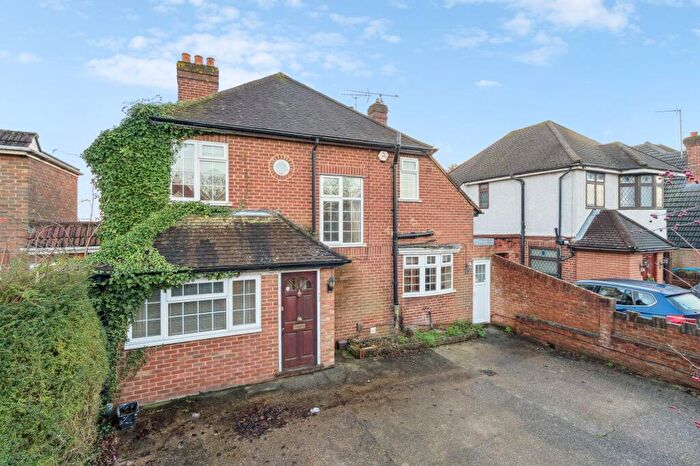
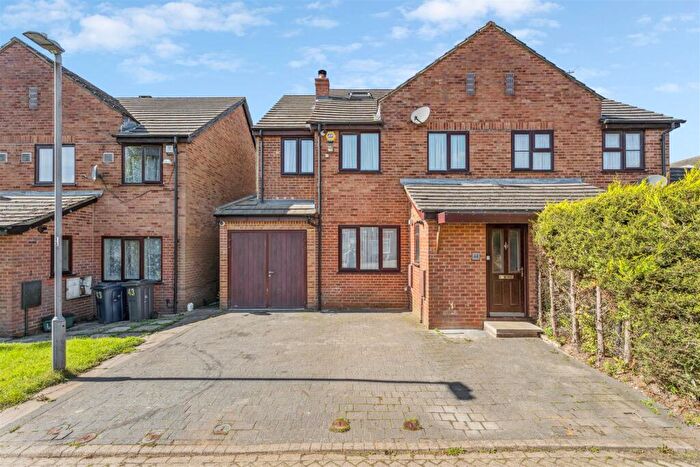
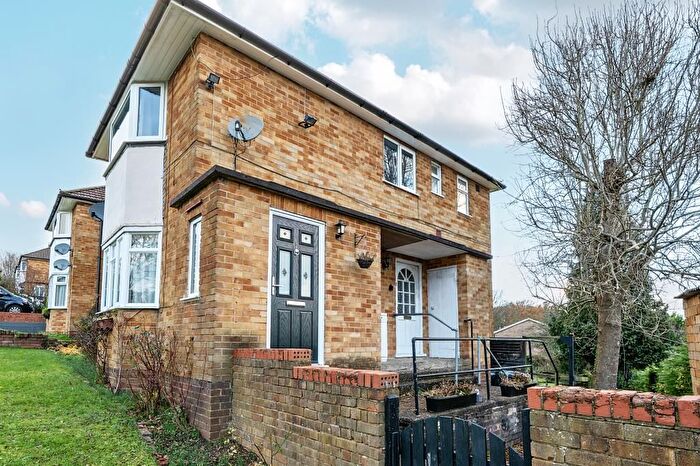
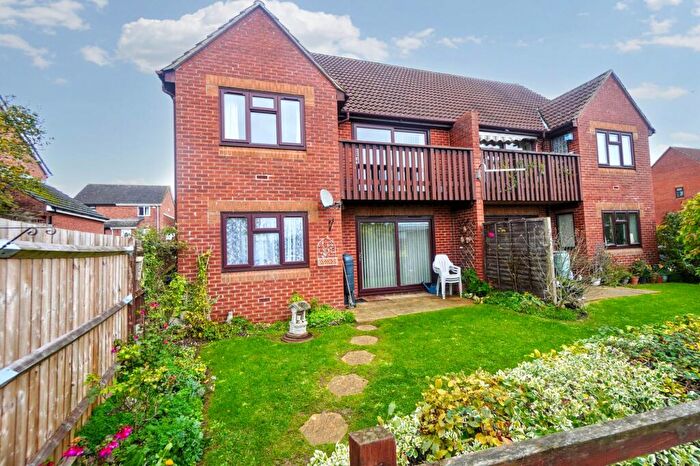
Houses for sale & to rent in Booker And Cressex, High Wycombe
House Prices in Booker And Cressex
Properties in Booker And Cressex have an average house price of £400,684.00 and had 204 Property Transactions within the last 3 years¹.
Booker And Cressex is an area in High Wycombe, Buckinghamshire with 1,927 households², where the most expensive property was sold for £932,500.00.
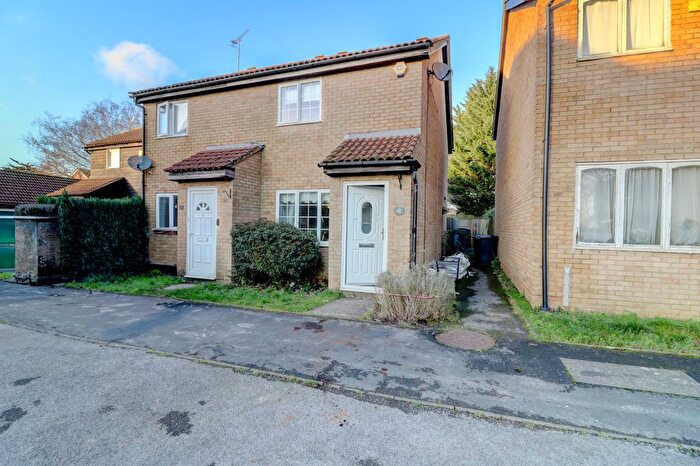
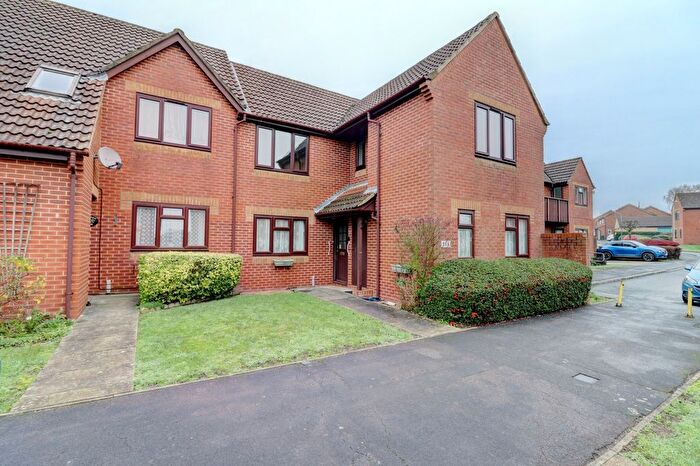
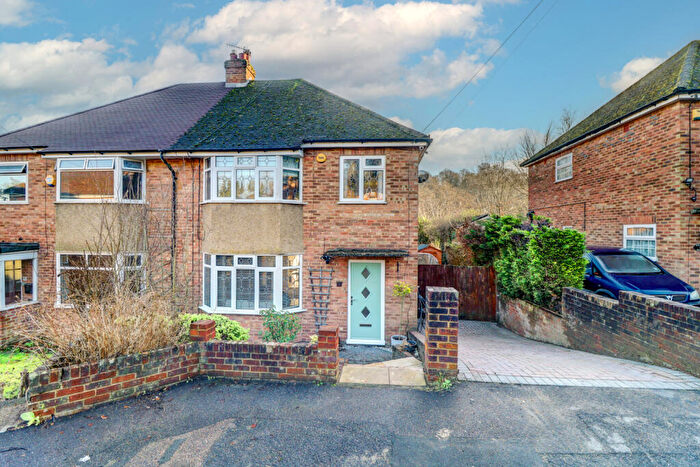
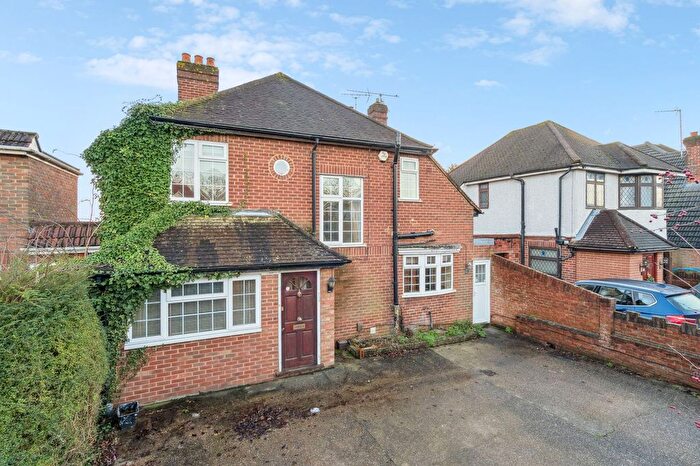
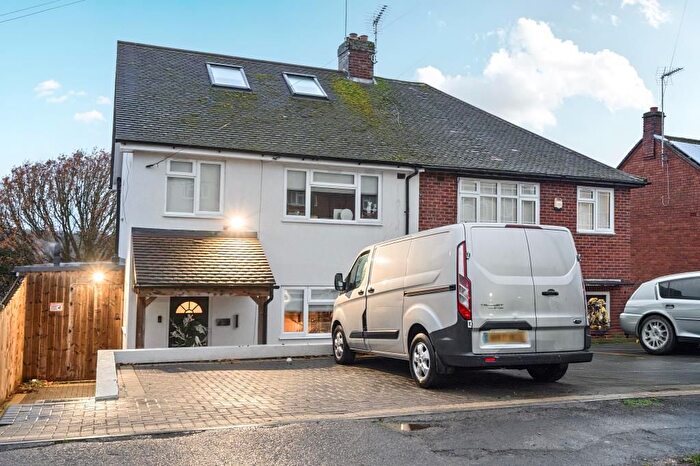
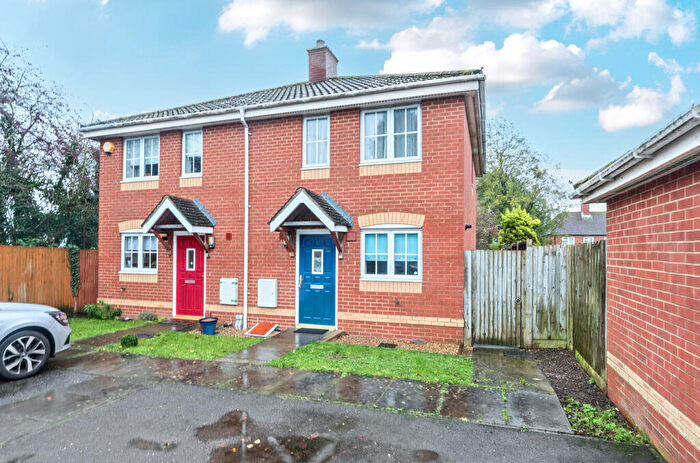
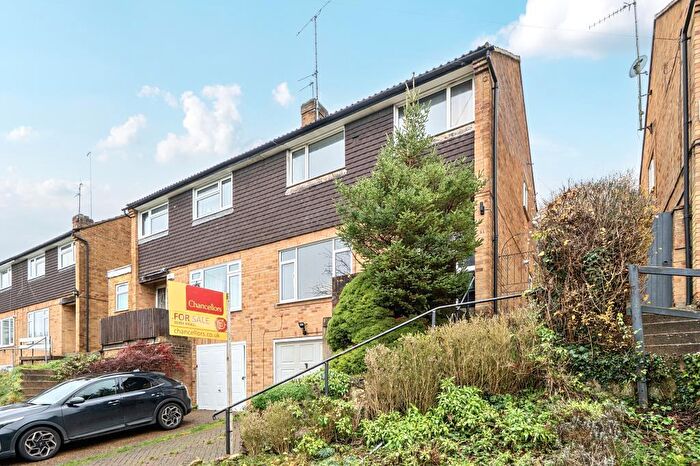
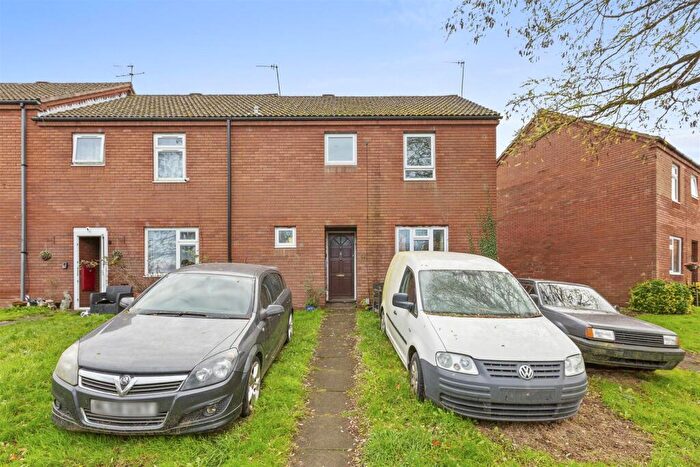
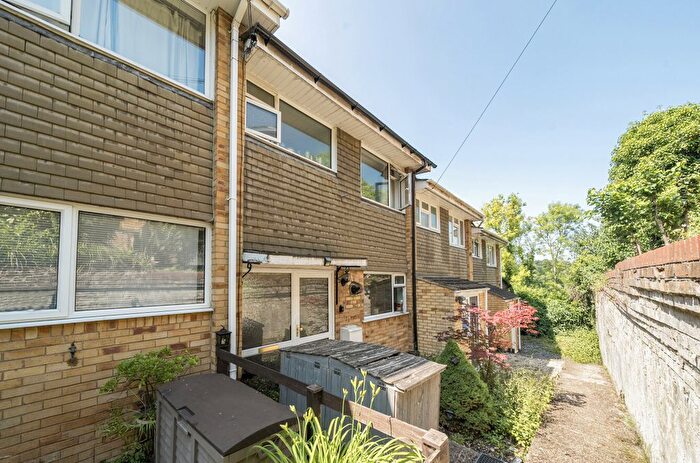
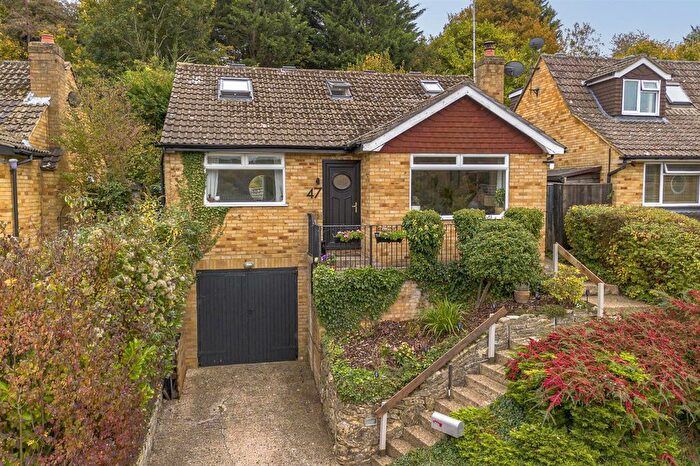
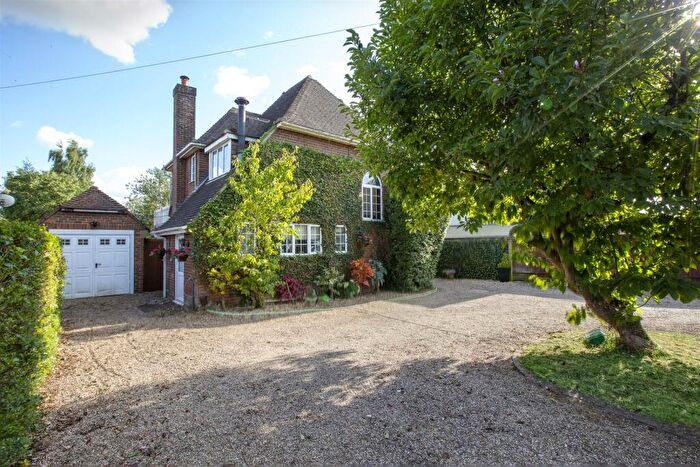
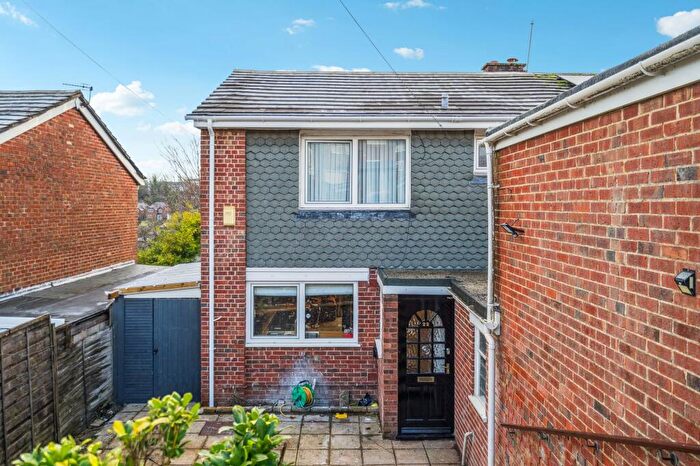
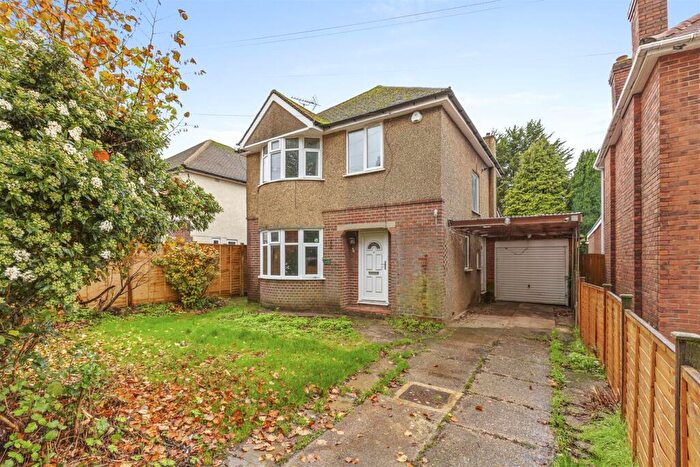
Properties for sale in Booker And Cressex
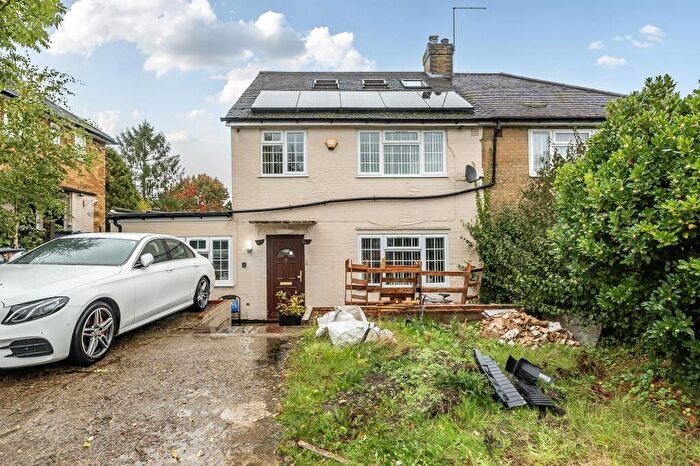
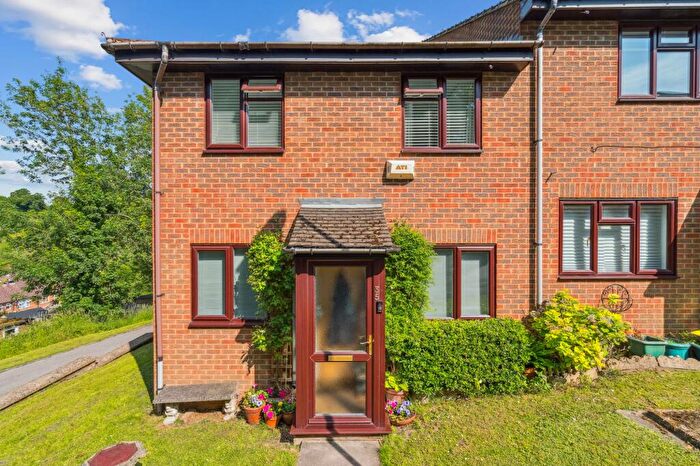
Previously listed properties in Booker And Cressex
Roads and Postcodes in Booker And Cressex
Navigate through our locations to find the location of your next house in Booker And Cressex, High Wycombe for sale or to rent.
| Streets | Postcodes |
|---|---|
| Abbots Way | HP12 4NR |
| Alford Road | HP12 4PP HP12 4PT |
| Ash Road | HP12 4SR HP12 4SW |
| Barbers Wood Close | HP12 4EW |
| Barbers Wood Road | HP12 4EP |
| Beacham Road | HP12 4PF |
| Bedder Road | HP12 4PB |
| Beech Trees Road | HP12 4AW |
| Booker Common | HP12 4QS HP12 4RA |
| Booker Place | HP12 4QX |
| Brandon Road | HP12 4PJ |
| Buckmaster Road | HP12 4PE |
| Catkin Close | HP12 4UZ |
| Challener Road | HP12 4PW |
| Cressex Road | HP12 4EE HP12 4QE HP12 4QF HP12 4UB HP12 4UD HP12 4UF HP12 4UH |
| Crossways | HP12 4SU |
| Cullyn Road | HP12 4PN |
| Deacon Close | HP12 4RB |
| Elm Road | HP12 4TA HP12 4TB |
| Fernie Fields | HP12 4SL HP12 4SN HP12 4SP |
| Gibson Road | HP12 4QP HP12 4QW |
| Gillfield Close | HP11 1TS |
| Glade View | HP12 4UN |
| Glenister Road | HP12 4RD |
| Graham Drive | HP12 4DX |
| Harman Walk | HP12 4PD |
| Havenfield Road | HP12 4ST HP12 4SX HP12 4SY HP12 4TE |
| Highfield Avenue | HP12 4DY HP12 4EA HP12 4ET |
| Holmer Lane | HP12 4QA |
| Holmers Court | HP12 4TS |
| Hornes Lane | HP12 4QT |
| Lansdell Avenue | HP12 4UQ |
| Lansdowne Way | HP11 1TN HP11 1TR HP11 1TW HP11 1UB |
| Limmer Lane | HP12 4QL HP12 4QR |
| Linnet Close | HP12 4QJ |
| Marlow Road | HP11 1TH |
| Miersfield | HP11 1TX HP11 1TY |
| Neale Close | HP12 4NX |
| New Road | HP12 4RG HP12 4RH HP12 4RQ |
| Newmer Road | HP12 4QN |
| Oak Crescent | HP12 4SS |
| Oldhouse Close | HP11 1TP |
| Pine Chase | HP12 4UG |
| Pinels Way | HP11 1TU |
| Redhouse Close | HP11 1TT |
| Redman Road | HP12 4PH |
| Robins Close | HP12 4NY |
| Robins Drive | HP12 4EQ |
| Rosewood Gardens | HP12 4RU |
| Sheridan Court | HP12 4SF HP12 4SQ |
| Shrimpton Road | HP12 4PL |
| Skyline Mews | HP12 4FE |
| Spring Coppice | HP14 3NU |
| Squirrel Lane | HP12 4RS HP12 4RX HP12 4RY |
| Sunningdale Close | HP12 4EN |
| Sunters Wood Close | HP12 4DZ |
| Sycamore Road | HP12 4TH HP12 4TJ HP12 4TL |
| The Coppice | HP12 4SA |
| The Homestead | HP12 4NP |
| The Laurels | HP12 4SB |
| The Paddocks | HP12 4QQ |
| Thrush Close | HP12 4RJ |
| Willow Avenue | HP12 4QU HP12 4QZ |
Transport near Booker And Cressex
- FAQ
- Price Paid By Year
- Property Type Price
Frequently asked questions about Booker And Cressex
What is the average price for a property for sale in Booker And Cressex?
The average price for a property for sale in Booker And Cressex is £400,684. This amount is 13% lower than the average price in High Wycombe. There are 548 property listings for sale in Booker And Cressex.
What streets have the most expensive properties for sale in Booker And Cressex?
The streets with the most expensive properties for sale in Booker And Cressex are Cressex Road at an average of £576,111, Willow Avenue at an average of £572,500 and Sunters Wood Close at an average of £558,571.
What streets have the most affordable properties for sale in Booker And Cressex?
The streets with the most affordable properties for sale in Booker And Cressex are Rosewood Gardens at an average of £133,600, Lansdowne Way at an average of £251,958 and Sheridan Court at an average of £257,428.
Which train stations are available in or near Booker And Cressex?
Some of the train stations available in or near Booker And Cressex are High Wycombe, Marlow and Bourne End.
Property Price Paid in Booker And Cressex by Year
The average sold property price by year was:
| Year | Average Sold Price | Price Change |
Sold Properties
|
|---|---|---|---|
| 2025 | £421,161 | 6% |
34 Properties |
| 2024 | £395,288 | -4% |
52 Properties |
| 2023 | £410,950 | 6% |
51 Properties |
| 2022 | £386,667 | 4% |
67 Properties |
| 2021 | £371,158 | 7% |
75 Properties |
| 2020 | £344,003 | 4% |
66 Properties |
| 2019 | £329,625 | -12% |
61 Properties |
| 2018 | £368,164 | 5% |
60 Properties |
| 2017 | £350,277 | 1% |
64 Properties |
| 2016 | £345,772 | 16% |
64 Properties |
| 2015 | £292,058 | 3% |
80 Properties |
| 2014 | £283,685 | 13% |
84 Properties |
| 2013 | £247,308 | 0,1% |
55 Properties |
| 2012 | £247,011 | 8% |
71 Properties |
| 2011 | £226,096 | -4% |
41 Properties |
| 2010 | £234,063 | 5% |
66 Properties |
| 2009 | £222,661 | 4% |
68 Properties |
| 2008 | £214,714 | -17% |
61 Properties |
| 2007 | £251,329 | 14% |
112 Properties |
| 2006 | £215,910 | 5% |
115 Properties |
| 2005 | £204,351 | 6% |
75 Properties |
| 2004 | £191,296 | 8% |
109 Properties |
| 2003 | £175,073 | 10% |
84 Properties |
| 2002 | £157,779 | 10% |
107 Properties |
| 2001 | £142,224 | 4% |
122 Properties |
| 2000 | £136,962 | 20% |
110 Properties |
| 1999 | £110,045 | 17% |
108 Properties |
| 1998 | £91,622 | 3% |
107 Properties |
| 1997 | £88,774 | 14% |
101 Properties |
| 1996 | £76,701 | 13% |
121 Properties |
| 1995 | £66,510 | - |
83 Properties |
Property Price per Property Type in Booker And Cressex
Here you can find historic sold price data in order to help with your property search.
The average Property Paid Price for specific property types in the last three years are:
| Property Type | Average Sold Price | Sold Properties |
|---|---|---|
| Semi Detached House | £423,209.00 | 50 Semi Detached Houses |
| Detached House | £528,116.00 | 60 Detached Houses |
| Terraced House | £358,944.00 | 67 Terraced Houses |
| Flat | £179,370.00 | 27 Flats |

