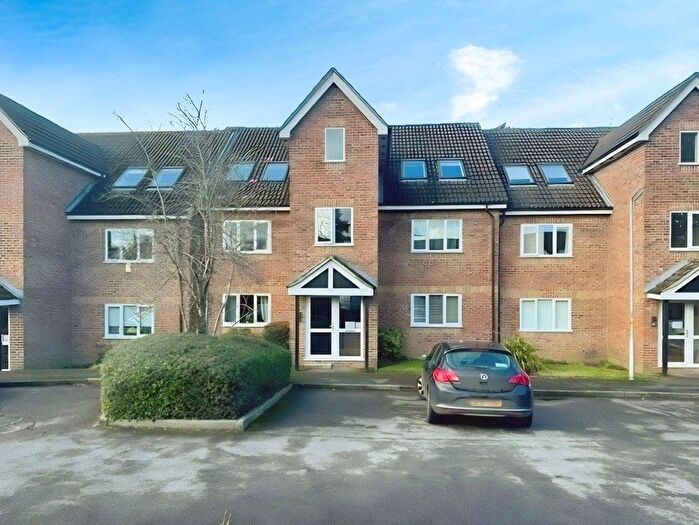
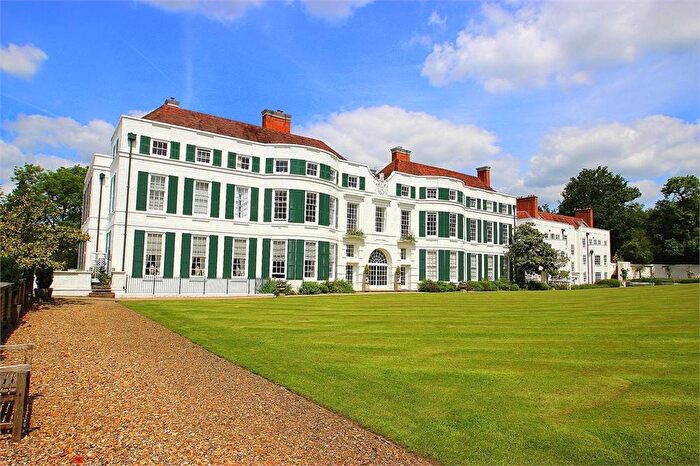
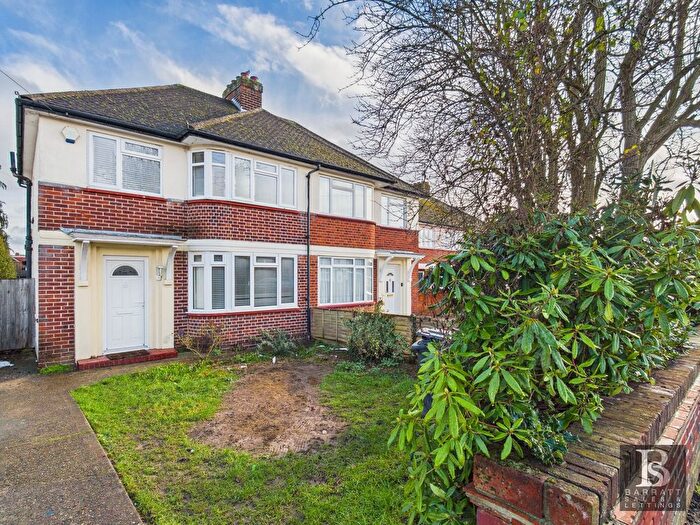
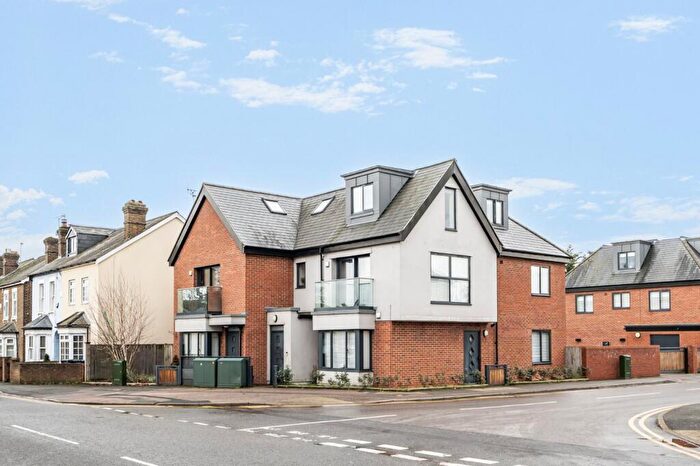
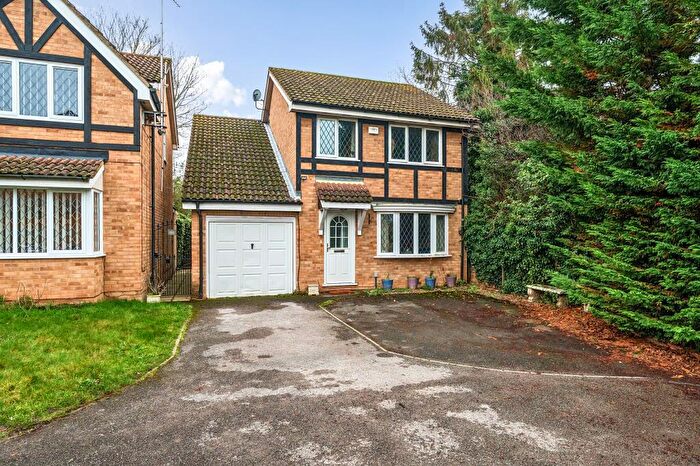
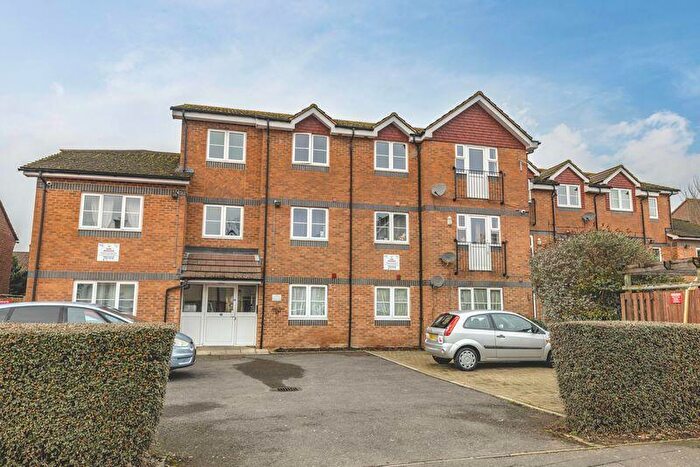
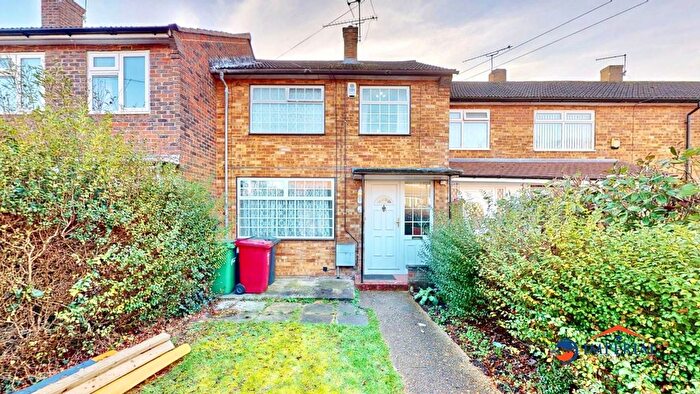
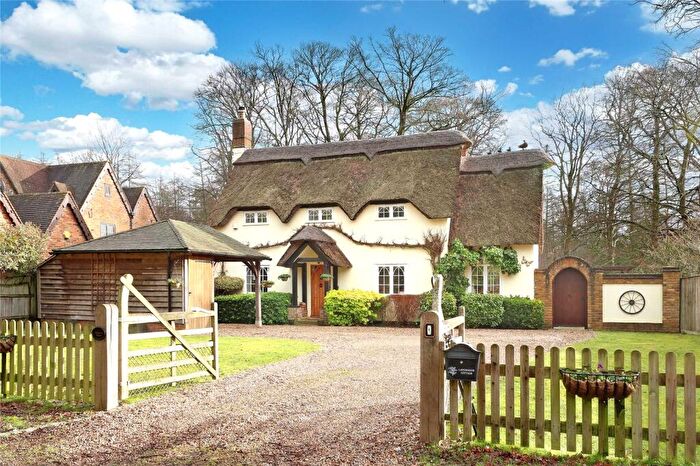
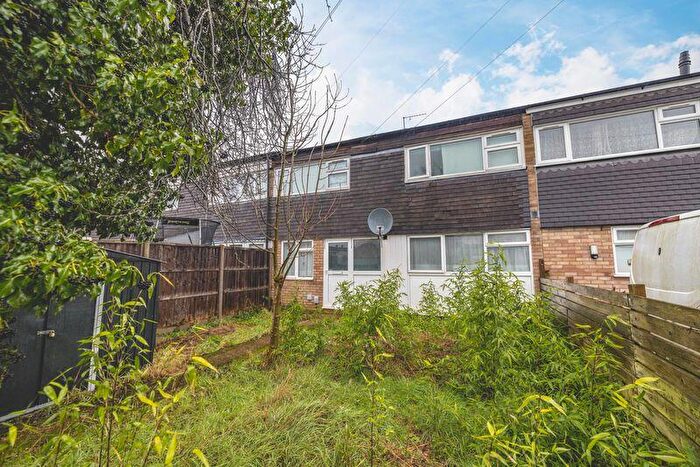
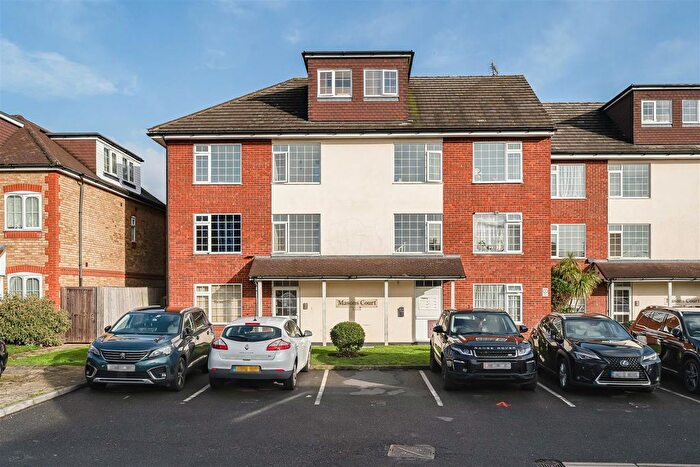
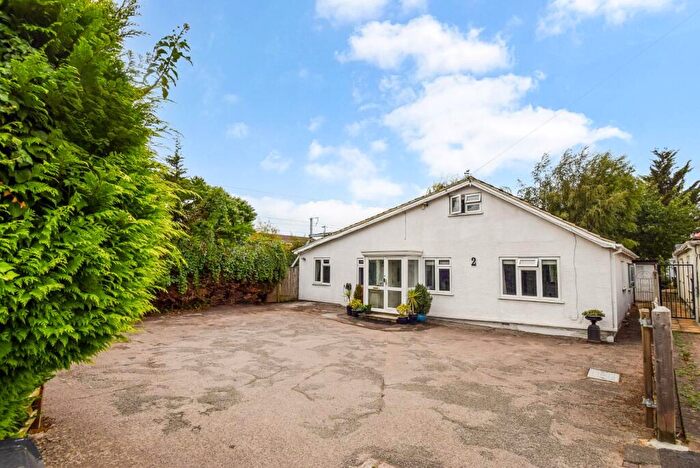
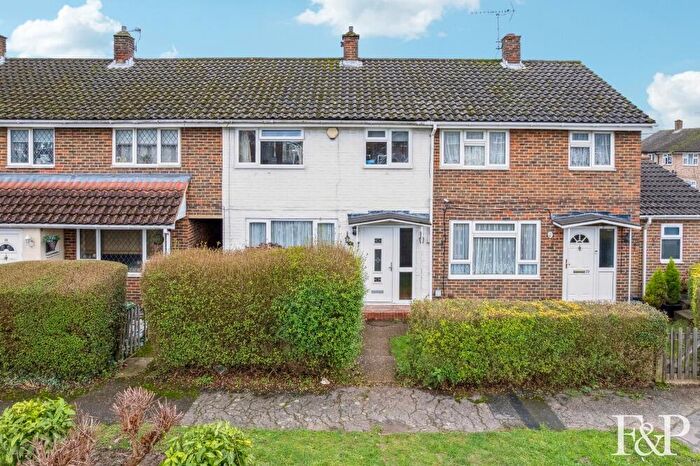
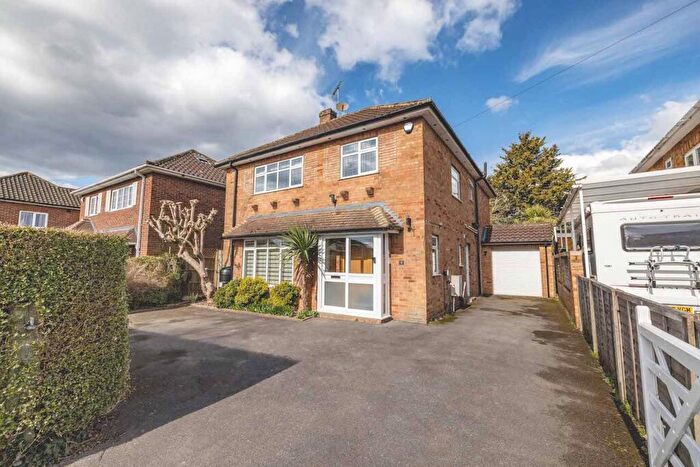
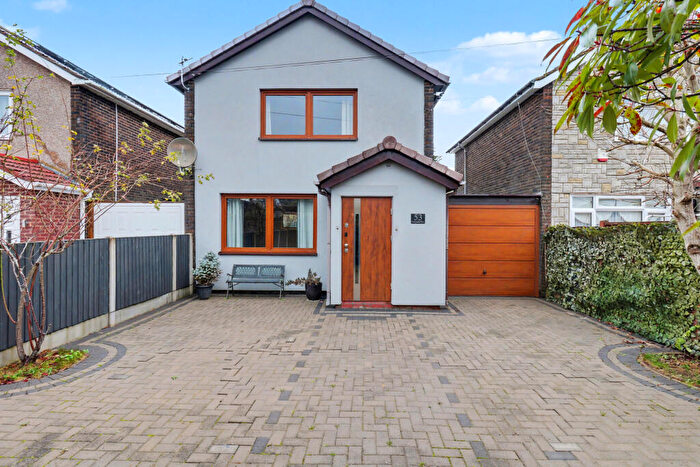
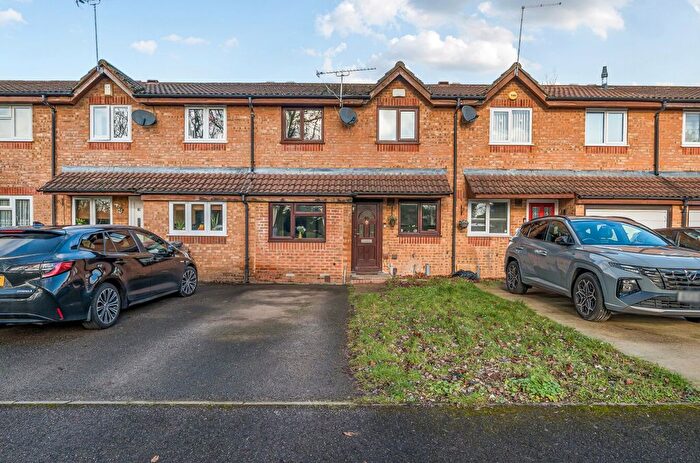
Houses for sale & to rent in Burnham Beeches, Slough
House Prices in Burnham Beeches
Properties in Burnham Beeches have an average house price of £994,639.00 and had 38 Property Transactions within the last 3 years¹.
Burnham Beeches is an area in Slough, Buckinghamshire with 430 households², where the most expensive property was sold for £1,875,000.00.
Properties for sale in Burnham Beeches
Roads and Postcodes in Burnham Beeches
Navigate through our locations to find the location of your next house in Burnham Beeches, Slough for sale or to rent.
| Streets | Postcodes |
|---|---|
| Abbey Park Lane | SL1 8PJ |
| Allerds Road | SL2 3TJ |
| Bentley Park | SL1 8EA |
| Brickfield Lane | SL1 8LF SL1 8LG |
| Britwell Gardens | SL1 8DG |
| Britwell Road | SL1 8DE SL1 8DH |
| Chalk Pit Lane | SL1 8NH SL1 8QG |
| Common Lane | SL1 8PP |
| Court Lane | SL1 8DN |
| Crown Lane | SL2 3SG |
| Crowpiece Lane | SL2 3TG |
| Dorney Wood Road | SL1 8EH SL1 8EJ SL1 8EQ SL1 8PT SL1 8PU SL1 8PX |
| Dropmore Road | SL1 8NB SL1 8ND SL1 8NF |
| East Burnham Cottages | SL2 3TN |
| East Burnham Lane | SL2 3TL SL2 3TW |
| Foxley Grove | SL1 8ET |
| Green Lane | SL1 8BZ SL1 8DA SL1 8DR SL1 8DX SL1 8DZ SL1 8EB SL1 8EG SL1 8QA |
| Grove Road | SL1 8DW |
| Hawthorn Lane | SL2 3TA SL2 3TE |
| Hazelhurst Road | SL1 8ED SL1 8EE |
| Horseshoe Hill | SL1 8QE |
| Kimbers Drive | SL1 8JE |
| Littleworth Road | SL1 8PF |
| Lower Britwell Road | SL2 2NQ |
| Nashdom Lane | SL1 8NJ |
| Nightingale Park | SL2 3SN |
| Rose Hill | SL1 8LW SL1 8NN |
| The Fairway | SL1 8DS SL1 8DU SL1 8DY |
| The Grange | SL1 8EN |
| Thompkins Lane | SL2 3TD SL2 3TP SL2 3TR |
Transport near Burnham Beeches
- FAQ
- Price Paid By Year
- Property Type Price
Frequently asked questions about Burnham Beeches
What is the average price for a property for sale in Burnham Beeches?
The average price for a property for sale in Burnham Beeches is £994,639. This amount is 44% higher than the average price in Slough. There are 2,420 property listings for sale in Burnham Beeches.
What streets have the most expensive properties for sale in Burnham Beeches?
The streets with the most expensive properties for sale in Burnham Beeches are Rose Hill at an average of £1,875,000, Kimbers Drive at an average of £1,343,300 and Foxley Grove at an average of £1,175,000.
What streets have the most affordable properties for sale in Burnham Beeches?
The streets with the most affordable properties for sale in Burnham Beeches are Horseshoe Hill at an average of £500,000, Nashdom Lane at an average of £600,625 and Britwell Road at an average of £720,000.
Which train stations are available in or near Burnham Beeches?
Some of the train stations available in or near Burnham Beeches are Burnham and Taplow.
Property Price Paid in Burnham Beeches by Year
The average sold property price by year was:
| Year | Average Sold Price | Price Change |
Sold Properties
|
|---|---|---|---|
| 2025 | £1,112,860 | 26% |
9 Properties |
| 2024 | £825,270 | -33% |
15 Properties |
| 2023 | £1,100,107 | 0,5% |
14 Properties |
| 2022 | £1,094,929 | -5% |
17 Properties |
| 2021 | £1,150,129 | 5% |
20 Properties |
| 2020 | £1,098,163 | 10% |
15 Properties |
| 2019 | £992,532 | -9% |
11 Properties |
| 2018 | £1,085,500 | 5% |
10 Properties |
| 2017 | £1,035,138 | 15% |
18 Properties |
| 2016 | £878,956 | 16% |
23 Properties |
| 2015 | £737,250 | -23% |
12 Properties |
| 2014 | £910,477 | 7% |
22 Properties |
| 2013 | £844,730 | 24% |
13 Properties |
| 2012 | £646,156 | 18% |
16 Properties |
| 2011 | £530,375 | -51% |
8 Properties |
| 2010 | £801,631 | 36% |
19 Properties |
| 2009 | £509,966 | -115% |
15 Properties |
| 2008 | £1,096,833 | 1% |
9 Properties |
| 2007 | £1,088,750 | 45% |
24 Properties |
| 2006 | £602,951 | -6% |
32 Properties |
| 2005 | £641,605 | 2% |
18 Properties |
| 2004 | £629,338 | -1% |
22 Properties |
| 2003 | £636,214 | 26% |
27 Properties |
| 2002 | £468,032 | 1% |
29 Properties |
| 2001 | £461,061 | 17% |
20 Properties |
| 2000 | £383,952 | 1% |
21 Properties |
| 1999 | £381,264 | -6% |
31 Properties |
| 1998 | £402,774 | 33% |
36 Properties |
| 1997 | £269,055 | 12% |
27 Properties |
| 1996 | £235,987 | -2% |
20 Properties |
| 1995 | £240,144 | - |
9 Properties |
Property Price per Property Type in Burnham Beeches
Here you can find historic sold price data in order to help with your property search.
The average Property Paid Price for specific property types in the last three years are:
| Property Type | Average Sold Price | Sold Properties |
|---|---|---|
| Semi Detached House | £800,177.00 | 7 Semi Detached Houses |
| Detached House | £1,178,742.00 | 25 Detached Houses |
| Terraced House | £464,500.00 | 2 Terraced Houses |
| Flat | £449,375.00 | 4 Flats |

