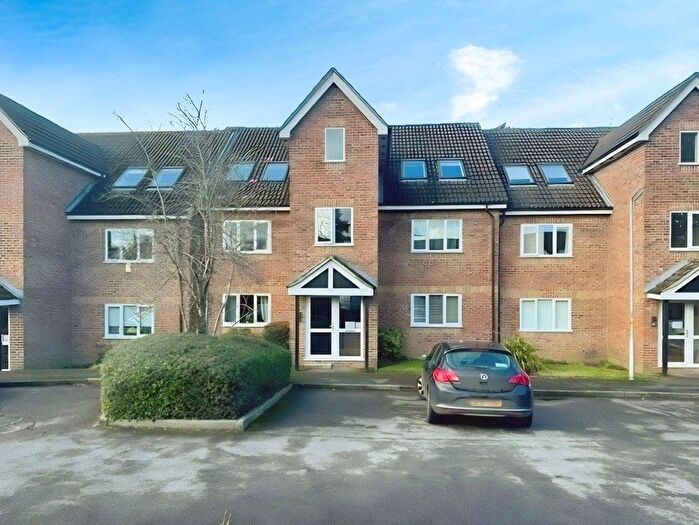
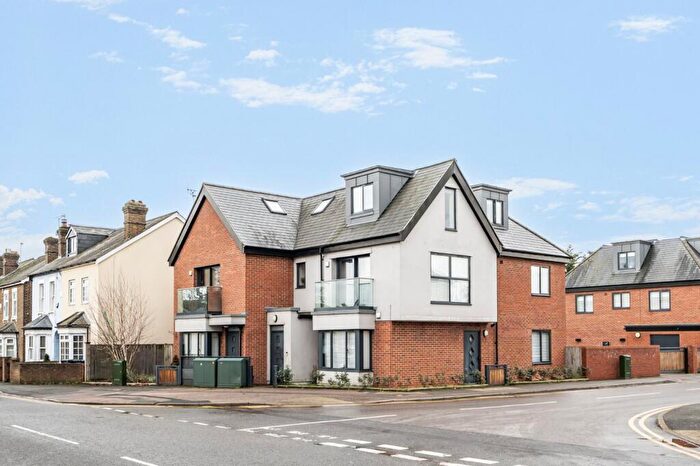
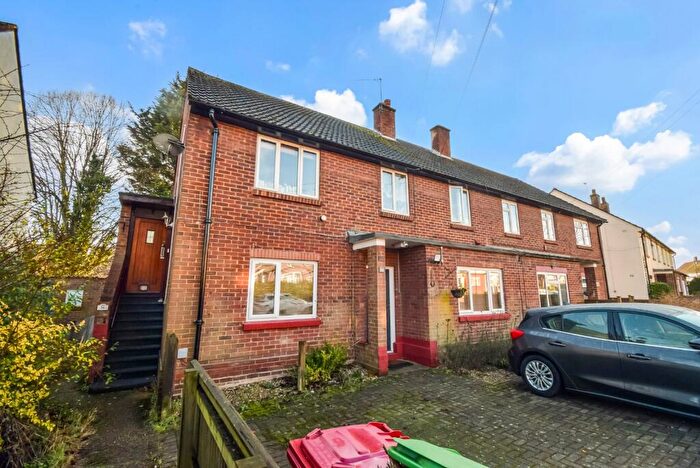
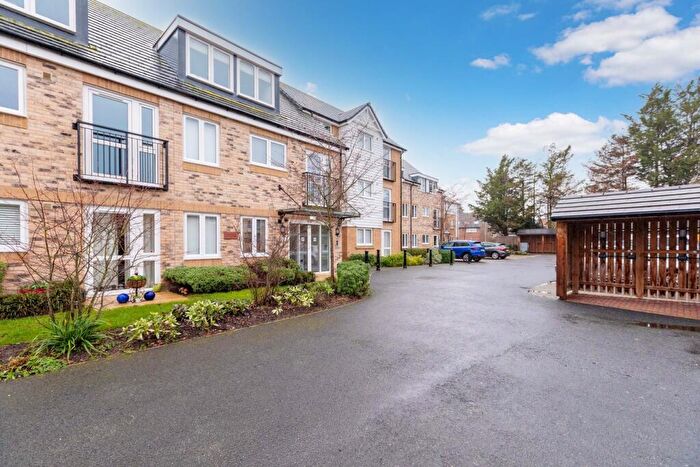
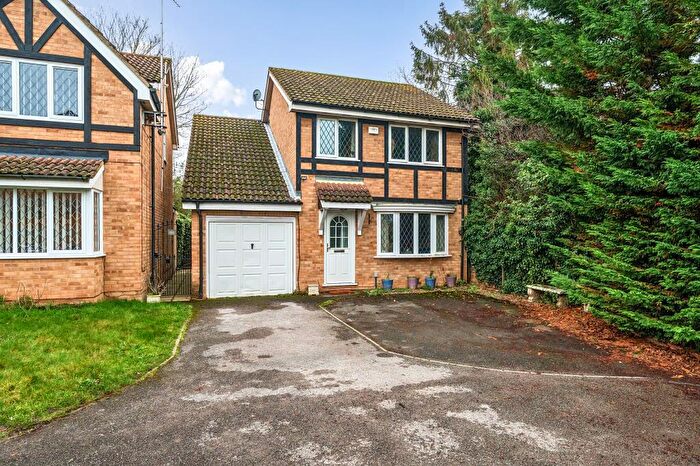
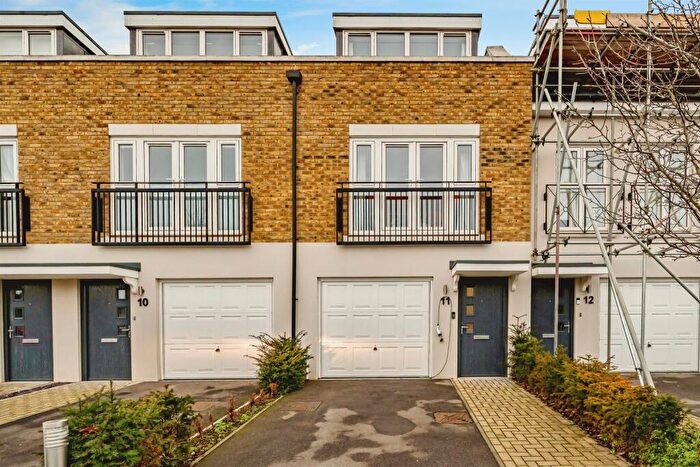
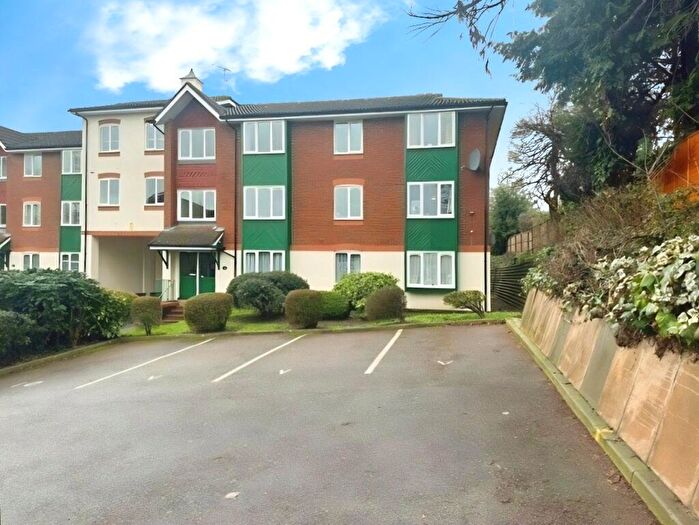
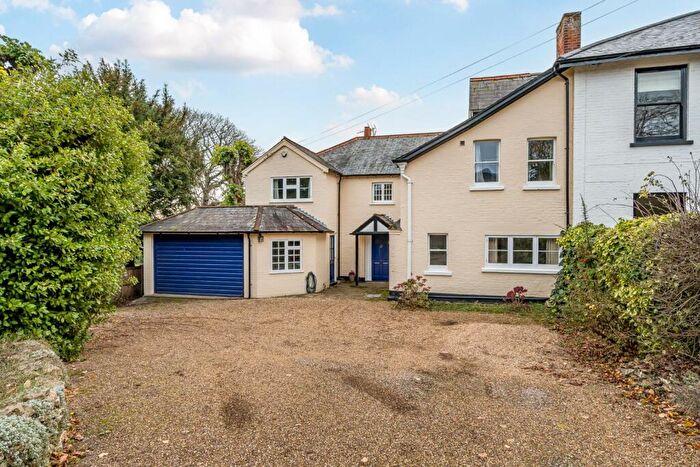
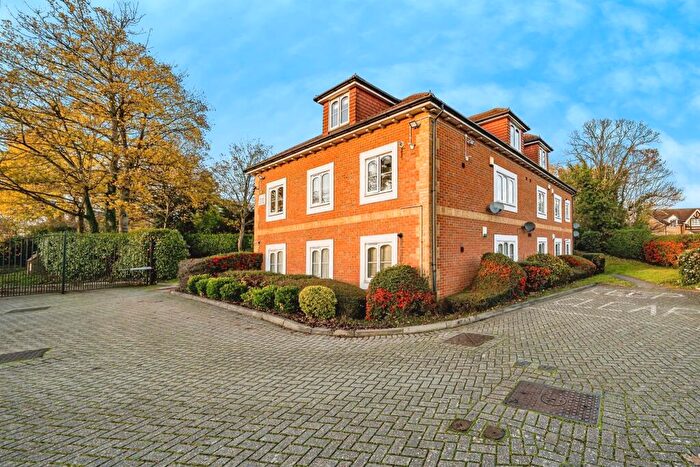
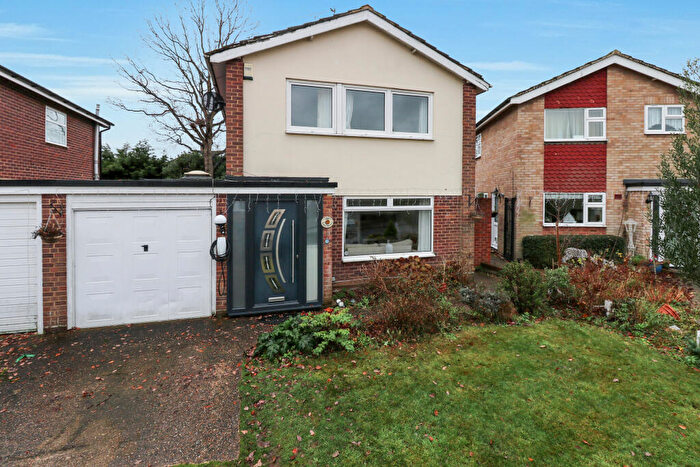
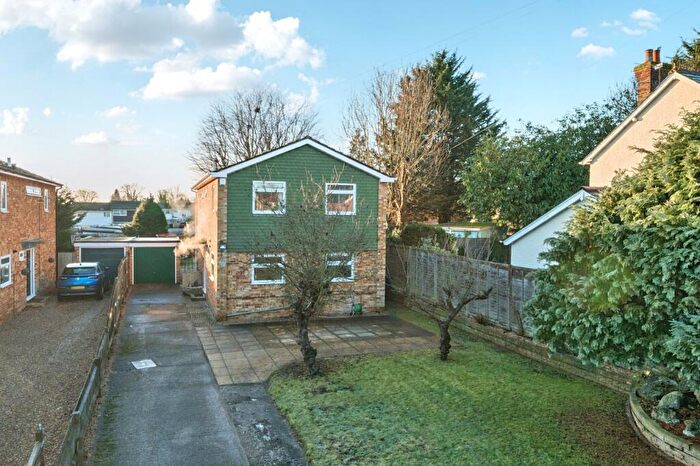
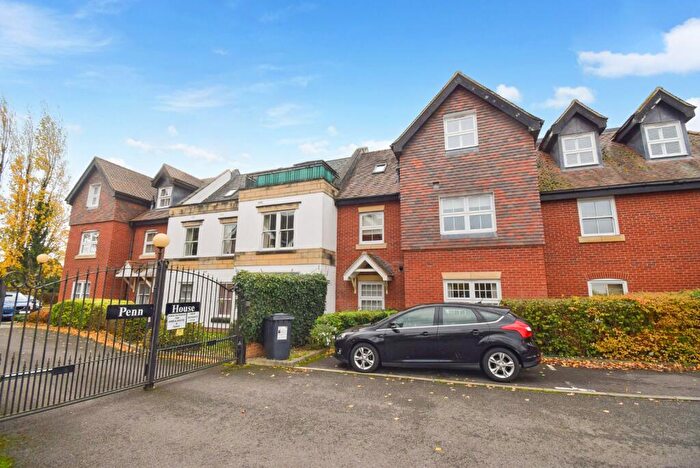
Houses for sale & to rent in Burnham Church, Slough
House Prices in Burnham Church
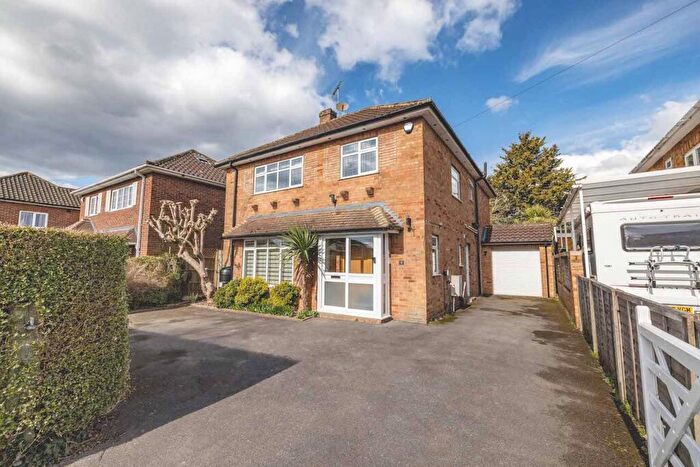
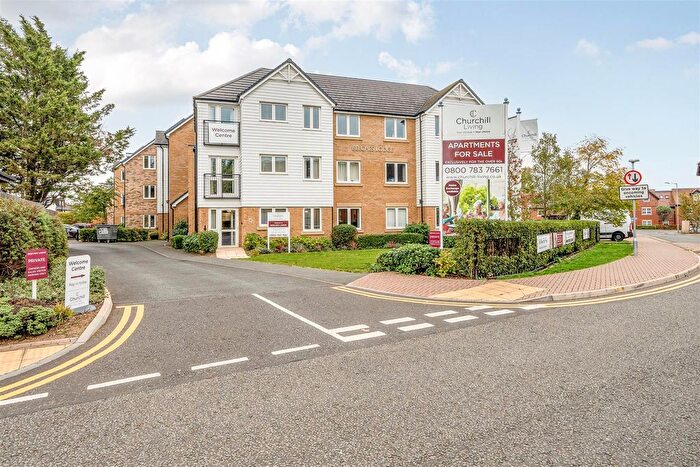
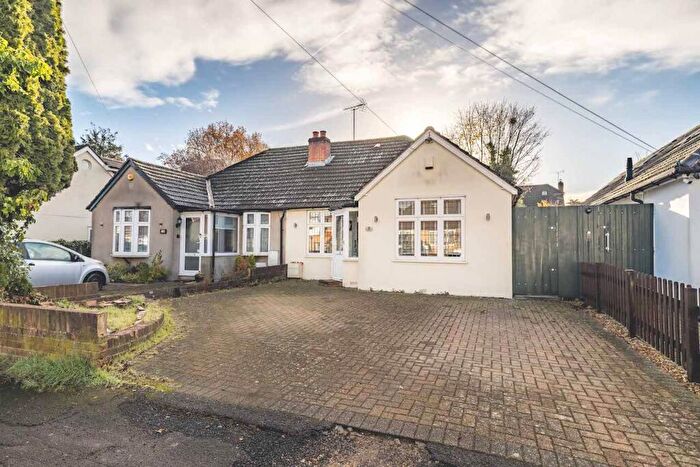
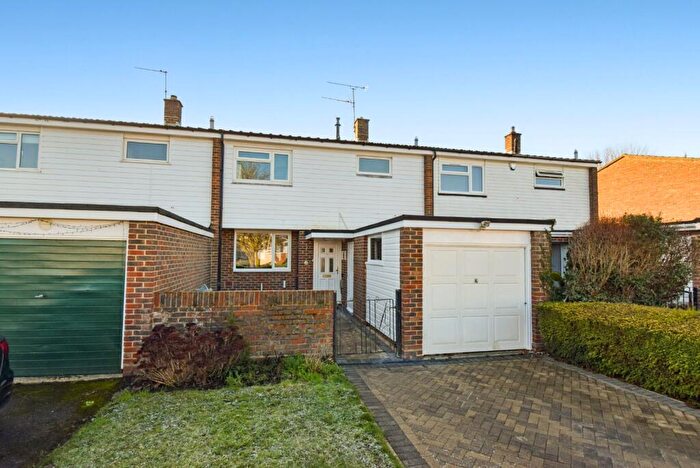
Properties in Burnham Church have an average house price of £551,779.00 and had 168 Property Transactions within the last 3 years¹.
Burnham Church is an area in Slough, Buckinghamshire with 1,954 households², where the most expensive property was sold for £1,499,950.00.
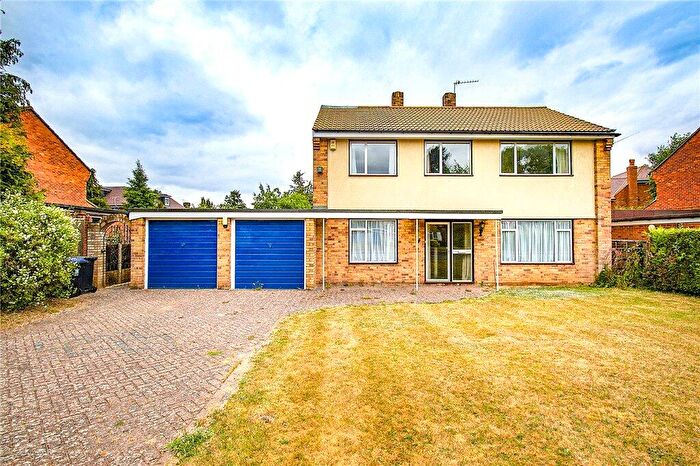
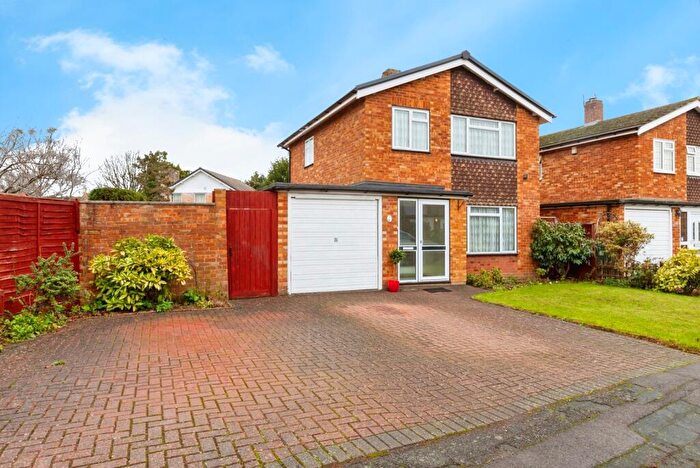
Properties for sale in Burnham Church
Roads and Postcodes in Burnham Church
Navigate through our locations to find the location of your next house in Burnham Church, Slough for sale or to rent.
| Streets | Postcodes |
|---|---|
| Alice Lane | SL1 7AY SL1 7AZ |
| Almond Road | SL1 8HA SL1 8HD SL1 8HF SL1 8HH SL1 8HX |
| Ashcroft Court | SL1 8JT |
| Baldwin Road | SL1 8HB |
| Bay Tree Court | SL1 8BH |
| Bowmans Close | SL1 8LH |
| Bredward Close | SL1 7DL |
| Britwell Road | SL1 8AF SL1 8AG SL1 8AQ |
| Burn Walk | SL1 7EW |
| Cambridge Avenue | SL1 8HP |
| Cedar Close | SL1 7HH |
| Cheveley Gardens | SL1 8AX |
| Church Street | SL1 7HX SL1 7HZ |
| Church Walk | SL1 7AN SL1 7AR |
| Clonmel Way | SL1 7DA SL1 7DB |
| Dawes East Road | SL1 8BT |
| Dropmore Road | SL1 8AN SL1 8AR SL1 8AU SL1 8AY SL1 8BA SL1 8BQ |
| Dropmore View | SL1 8JY |
| Eight Acres | SL1 7AF SL1 7AG |
| Fairfield Road | SL1 8AH |
| Gable Mews | SL1 7AQ |
| Gore Road | SL1 7DD SL1 7DF SL1 7DG SL1 7DJ SL1 8AB SL1 8AD SL1 8AE |
| Greenway | SL1 8HN SL1 8HW |
| Grenville Close | SL1 8HG SL1 8HQ |
| Hall Meadow | SL1 8HE |
| Hamilton Gardens | SL1 7AA |
| Hatchgate Gardens | SL1 8DD |
| High Street | SL1 7JB SL1 7JD SL1 7JH SL1 7JP SL1 7JT SL1 7JZ |
| Hitcham Lane | SL1 7DN SL1 7DP SL1 7DU |
| Hogfair Lane | SL1 7HQ SL1 8BU SL1 8BY |
| Jennery Lane | SL1 8BN SL1 8BX |
| Lambourne Close | SL1 8BF |
| Lent Green | SL1 7AL |
| Lent Green Lane | SL1 7AP SL1 7AS SL1 7AW |
| Lent Rise Road | SL1 7AB SL1 7AH SL1 7AU SL1 7AX |
| Lincoln Hatch Lane | SL1 7HA SL1 7HD |
| Linkswood Road | SL1 8AS SL1 8AT |
| Long Drive | SL1 8AJ SL1 8AL |
| Mallard Close | SL1 7DT |
| Middle Walk | SL1 7ER |
| Minniecroft Road | SL1 7DE |
| Norelands Drive | SL1 8AZ |
| North Burnham Close | SL1 8HT |
| Old Fives Court | SL1 7ET |
| Oxford Avenue | SL1 8HR |
| Parkgate | SL1 7HP |
| Pepler Way | SL1 7DS |
| Pink Lane | SL1 8JP SL1 8JU SL1 8JW SL1 8JX |
| Pipers Close | SL1 8AW |
| Poyle Lane | SL1 8JZ SL1 8LA SL1 8LB SL1 8LE SL1 8LQ |
| Redwood | SL1 8JN |
| Sands Farm Drive | SL1 7LD |
| Shenstone Drive | SL1 7HJ |
| Shoreham Rise | SL2 2LG |
| St Peters Close | SL1 7HS SL1 7HT |
| Stomp Road | SL1 7LR SL1 7LW |
| Summers Road | SL1 7EP |
| Taplow Common Road | SL1 8JF SL1 8LP |
| The Gore | SL1 8LT |
| The Pound | SL1 7HE |
| The Precincts | SL1 7HU |
| Tockley Road | SL1 7DH SL1 7DQ |
| Willow Wood Close | SL1 8JD |
| Wilmot Road | SL1 7EN |
| Winch's Meadow | SL1 8FA |
| Windsor Close | SL1 7HL |
| Windsor Lane | SL1 7DW SL1 7HN |
| Wymers Close | SL1 8JR |
| Wymers Wood Road | SL1 8JG SL1 8JH SL1 8JJ SL1 8JQ SL1 8LJ |
| Wyndham Crescent | SL1 8HJ SL1 8HS |
Transport near Burnham Church
- FAQ
- Price Paid By Year
- Property Type Price
Frequently asked questions about Burnham Church
What is the average price for a property for sale in Burnham Church?
The average price for a property for sale in Burnham Church is £551,779. This amount is 20% lower than the average price in Slough. There are 955 property listings for sale in Burnham Church.
What streets have the most expensive properties for sale in Burnham Church?
The streets with the most expensive properties for sale in Burnham Church are Wymers Wood Road at an average of £1,347,475, Bredward Close at an average of £1,210,000 and Hitcham Lane at an average of £1,185,000.
What streets have the most affordable properties for sale in Burnham Church?
The streets with the most affordable properties for sale in Burnham Church are Hall Meadow at an average of £208,000, Parkgate at an average of £240,125 and Winch's Meadow at an average of £275,500.
Which train stations are available in or near Burnham Church?
Some of the train stations available in or near Burnham Church are Burnham, Taplow and Furze Platt.
Property Price Paid in Burnham Church by Year
The average sold property price by year was:
| Year | Average Sold Price | Price Change |
Sold Properties
|
|---|---|---|---|
| 2025 | £563,459 | 2% |
62 Properties |
| 2024 | £554,039 | 4% |
62 Properties |
| 2023 | £532,136 | -12% |
44 Properties |
| 2022 | £595,177 | 20% |
78 Properties |
| 2021 | £476,350 | -5% |
111 Properties |
| 2020 | £502,381 | 7% |
72 Properties |
| 2019 | £465,204 | -10% |
63 Properties |
| 2018 | £513,690 | 8% |
47 Properties |
| 2017 | £472,422 | 0,1% |
59 Properties |
| 2016 | £471,927 | 10% |
71 Properties |
| 2015 | £423,290 | 6% |
83 Properties |
| 2014 | £395,959 | 10% |
68 Properties |
| 2013 | £354,963 | 4% |
72 Properties |
| 2012 | £340,429 | -10% |
68 Properties |
| 2011 | £375,941 | 7% |
98 Properties |
| 2010 | £351,206 | 8% |
54 Properties |
| 2009 | £323,508 | -14% |
46 Properties |
| 2008 | £367,492 | 9% |
57 Properties |
| 2007 | £333,772 | 13% |
94 Properties |
| 2006 | £290,600 | -3% |
101 Properties |
| 2005 | £299,432 | 8% |
85 Properties |
| 2004 | £274,049 | 2% |
103 Properties |
| 2003 | £268,239 | 12% |
100 Properties |
| 2002 | £237,111 | 11% |
99 Properties |
| 2001 | £210,683 | 0,3% |
89 Properties |
| 2000 | £210,125 | 10% |
97 Properties |
| 1999 | £189,688 | 24% |
114 Properties |
| 1998 | £144,992 | 4% |
89 Properties |
| 1997 | £138,597 | 23% |
107 Properties |
| 1996 | £107,070 | -8% |
72 Properties |
| 1995 | £115,808 | - |
78 Properties |
Property Price per Property Type in Burnham Church
Here you can find historic sold price data in order to help with your property search.
The average Property Paid Price for specific property types in the last three years are:
| Property Type | Average Sold Price | Sold Properties |
|---|---|---|
| Semi Detached House | £511,347.00 | 46 Semi Detached Houses |
| Detached House | £805,836.00 | 59 Detached Houses |
| Terraced House | £405,958.00 | 35 Terraced Houses |
| Flat | £265,142.00 | 28 Flats |

