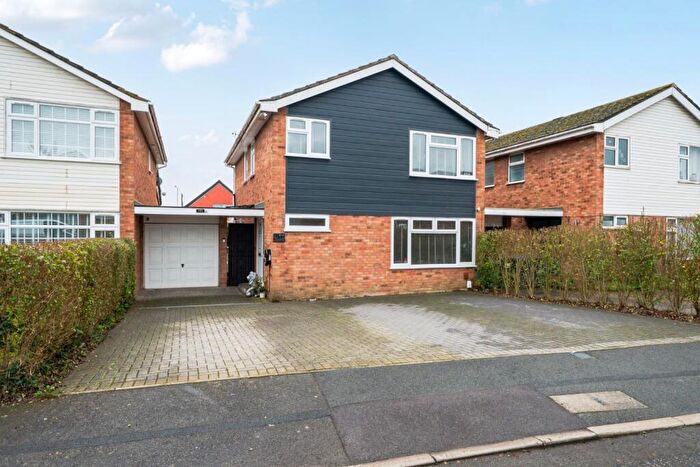
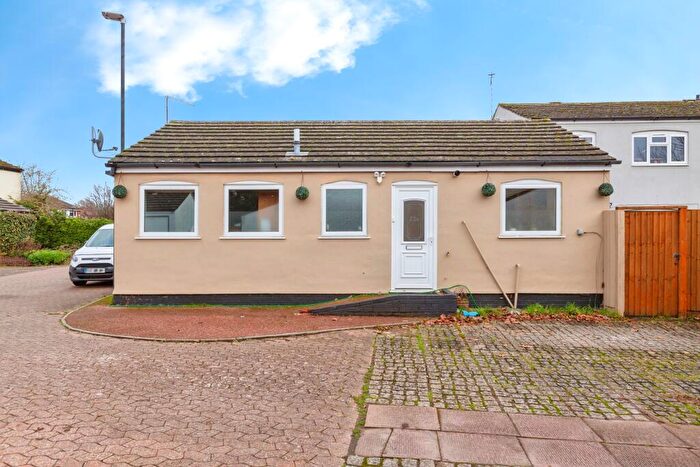
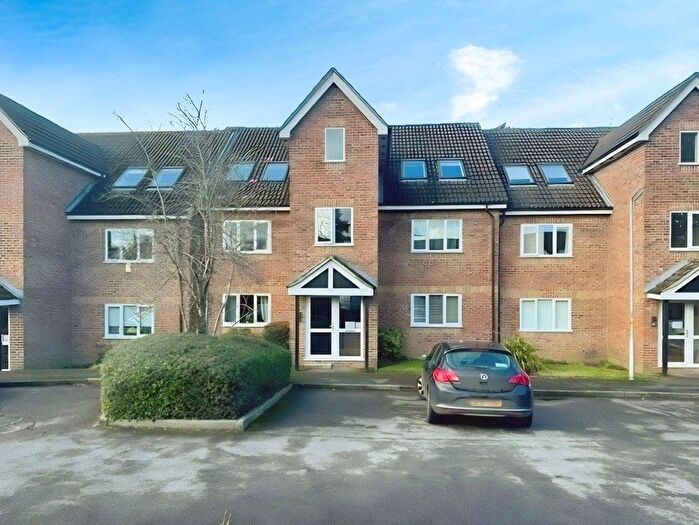
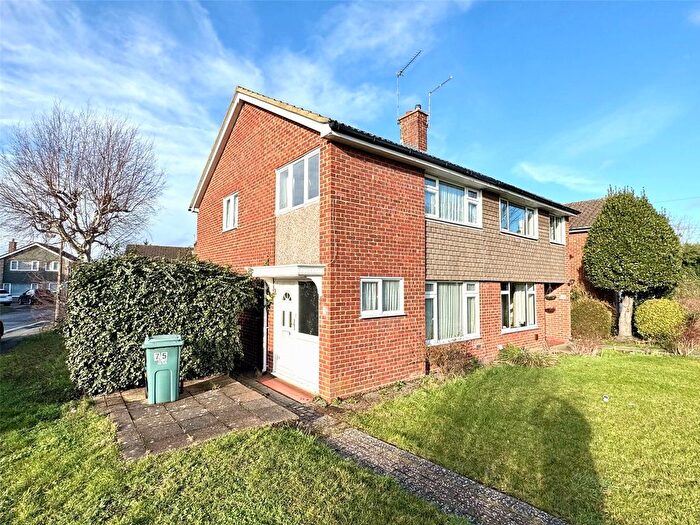
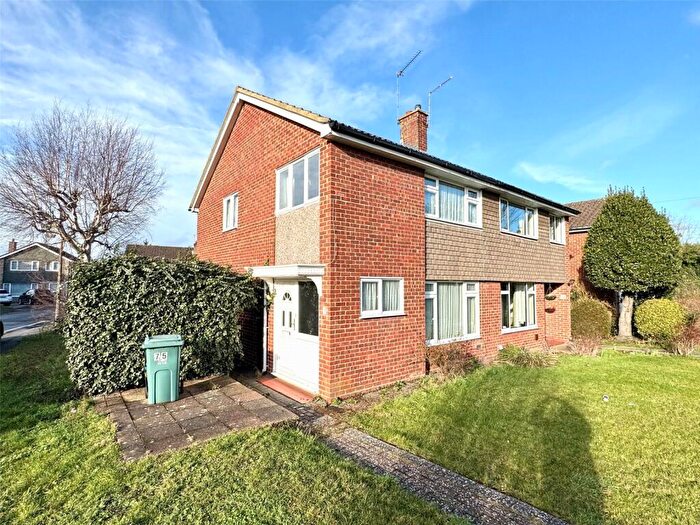
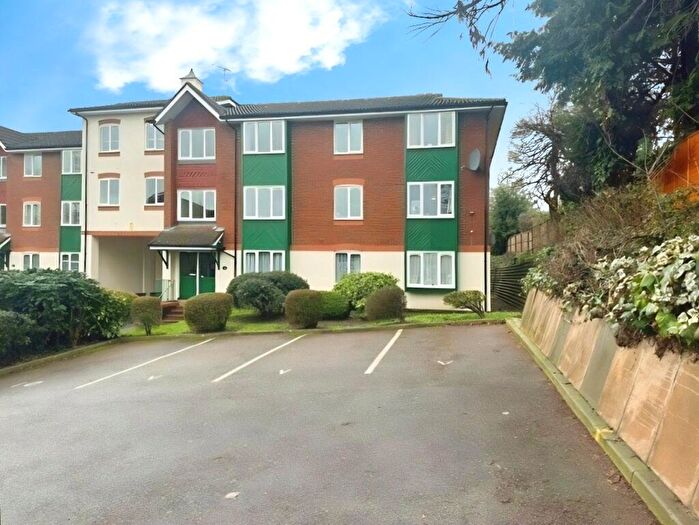
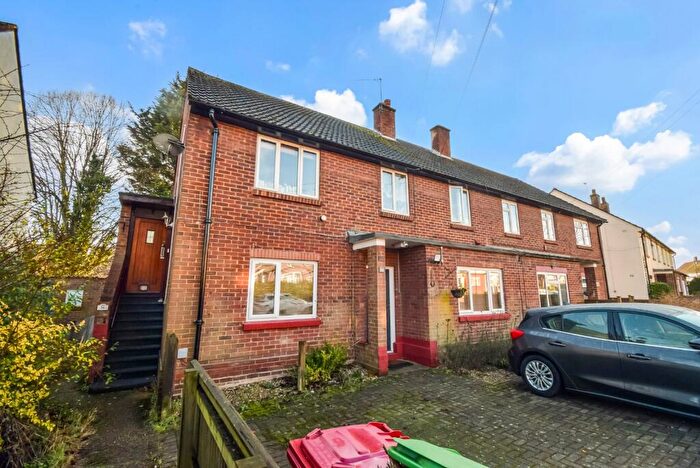
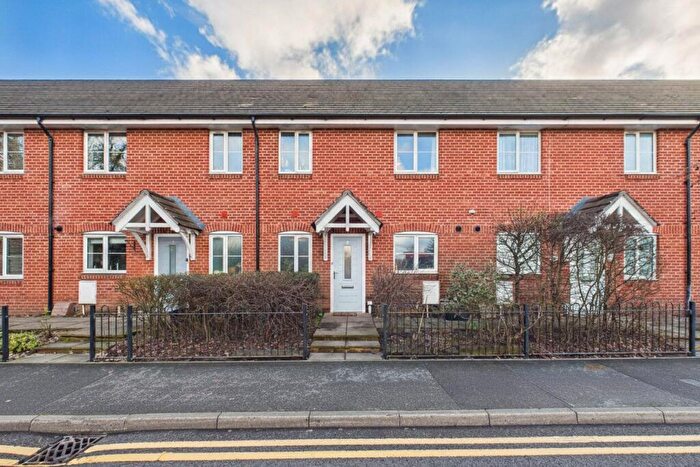
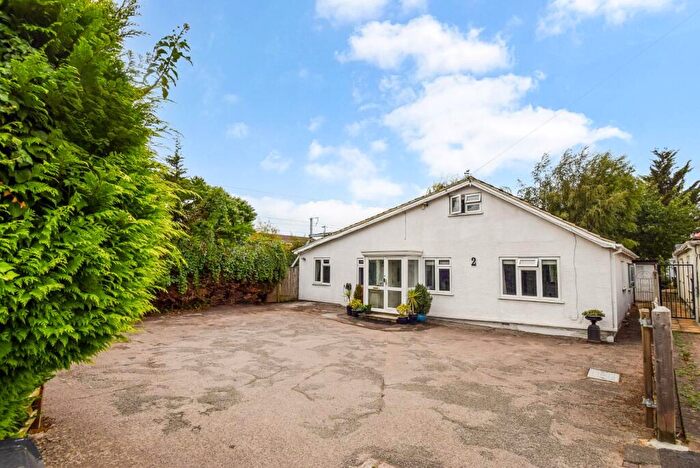
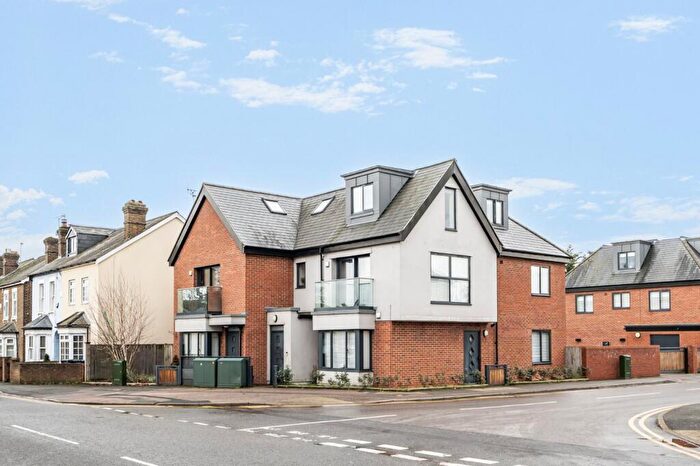
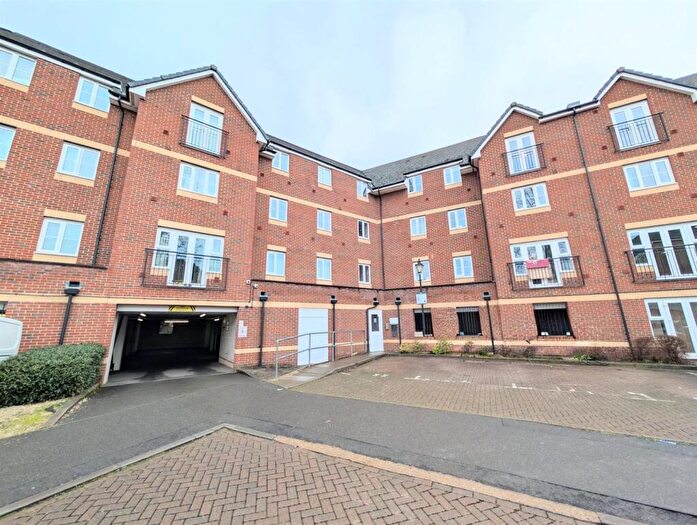
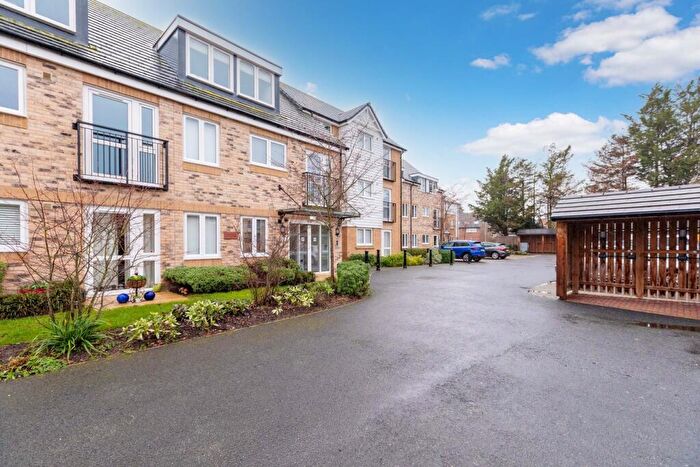
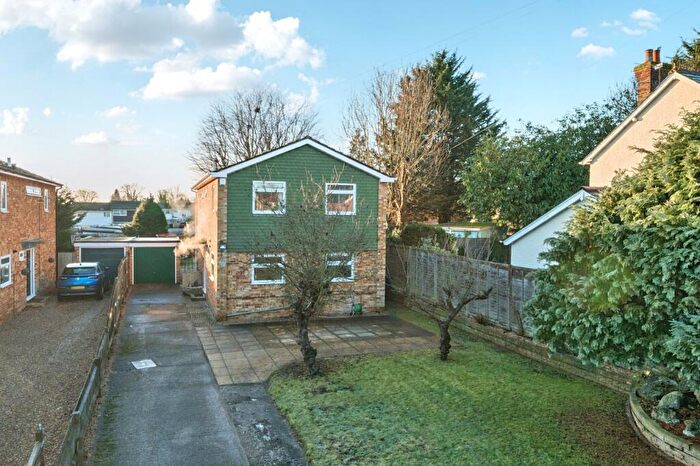
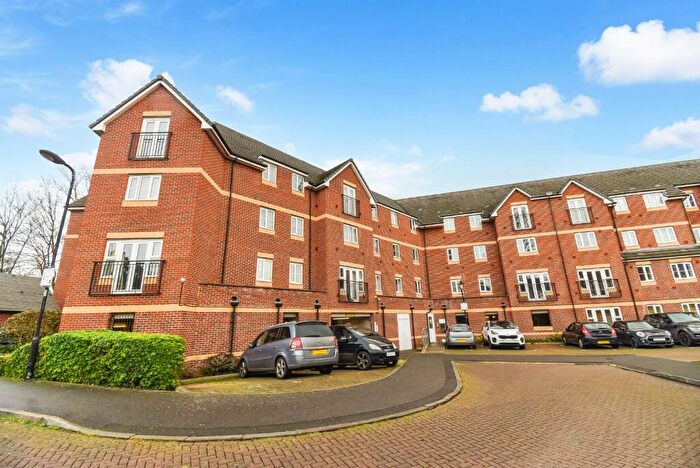
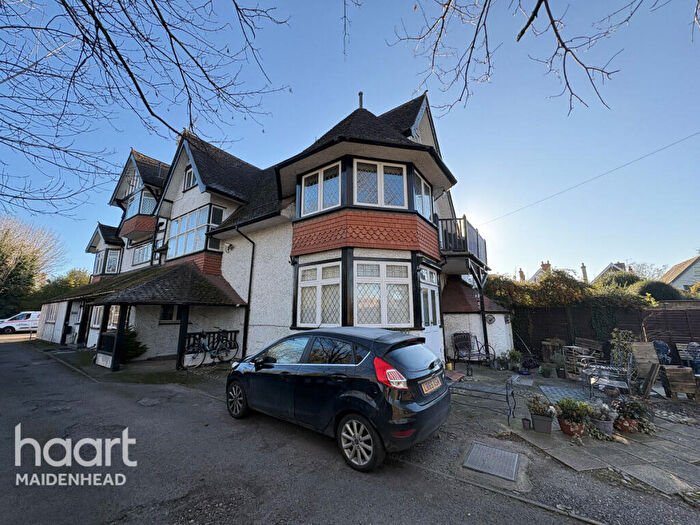
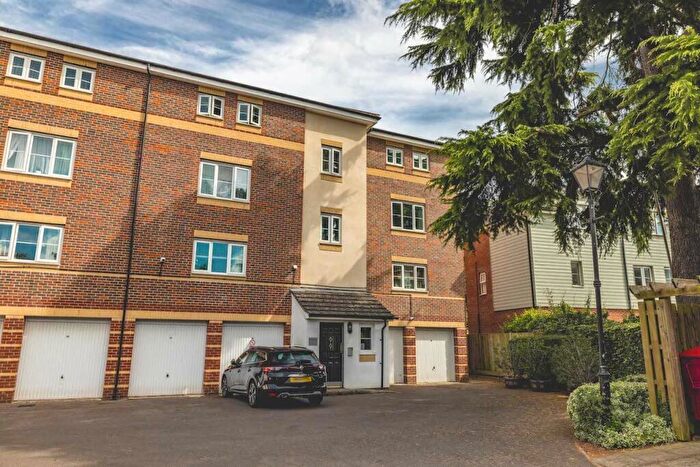
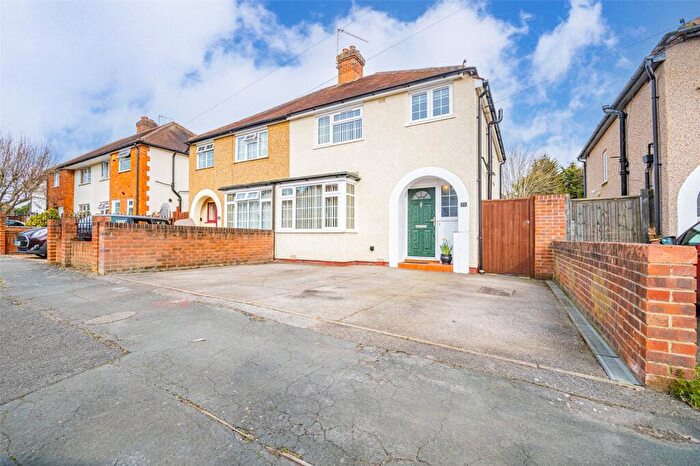
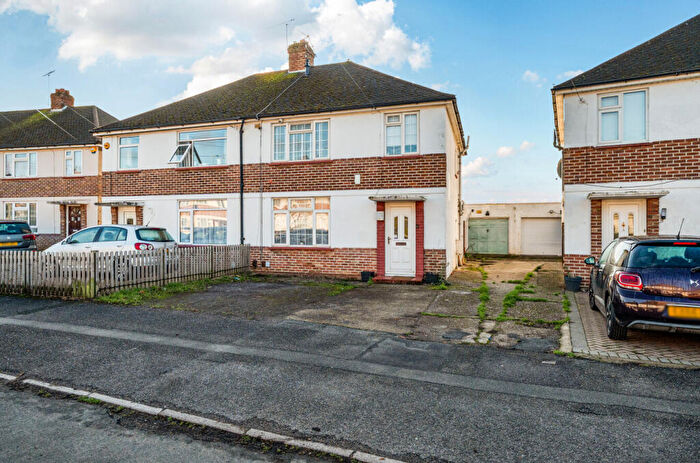
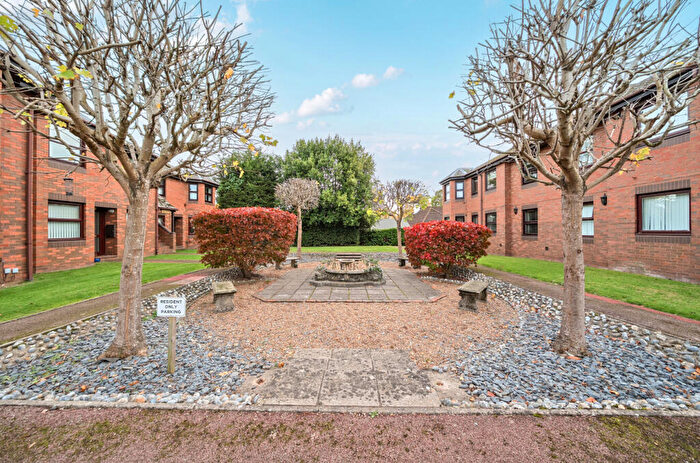
Houses for sale & to rent in Burnham Lent Rise, Slough
House Prices in Burnham Lent Rise
Properties in Burnham Lent Rise have an average house price of £464,580.00 and had 63 Property Transactions within the last 3 years¹.
Burnham Lent Rise is an area in Slough, Buckinghamshire with 1,039 households², where the most expensive property was sold for £800,000.00.
Properties for sale in Burnham Lent Rise
Roads and Postcodes in Burnham Lent Rise
Navigate through our locations to find the location of your next house in Burnham Lent Rise, Slough for sale or to rent.
| Streets | Postcodes |
|---|---|
| Aldbourne Road | SL1 7NJ |
| Bayley Crescent | SL1 7EF |
| Bingham Road | SL1 7ED SL1 7EE |
| Burlington Road | SL1 7BQ |
| By Ways | SL1 7EB |
| Chiltern Road | SL1 7NB SL1 7NF SL1 7NH SL1 7NQ |
| Coalmans Way | SL1 7NU SL1 7NX |
| Coulson Way | SL1 7PL SL1 7PN SL1 7PW |
| Eastfield Road | SL1 7EH SL1 7EL SL1 7NZ SL1 7PE SL1 7PF |
| Hanbury Close | SL1 7EA |
| Harkness Road | SL1 7BL |
| Hitcham Road | SL1 7DY SL1 7DZ SL1 7EG SL1 7EQ |
| Huntercombe Lane North | SL1 6DT SL1 6DX |
| Lent Rise Road | SL1 7BB SL1 7BH SL1 7BN SL1 7NY SL1 7PH |
| Milner Road | SL1 7PA SL1 7PB |
| Missenden Gardens | SL1 6LB |
| Opendale Road | SL1 7LY |
| Orchardville | SL1 7BD SL1 7BE |
| Penhale Place | SL1 6FA |
| Southfield Gardens | SL1 7NE |
| Stomp Road | SL1 7LT SL1 7LX SL1 7NA SL1 7NN SL1 7NW |
| The Green | SL1 7BG |
| Wendover Road | SL1 7ND |
| Wethered Drive | SL1 7NG |
| Winters Acre | SL1 7BF |
Transport near Burnham Lent Rise
- FAQ
- Price Paid By Year
- Property Type Price
Frequently asked questions about Burnham Lent Rise
What is the average price for a property for sale in Burnham Lent Rise?
The average price for a property for sale in Burnham Lent Rise is £464,580. This amount is 33% lower than the average price in Slough. There are 1,279 property listings for sale in Burnham Lent Rise.
What streets have the most expensive properties for sale in Burnham Lent Rise?
The streets with the most expensive properties for sale in Burnham Lent Rise are Penhale Place at an average of £777,500, Stomp Road at an average of £607,500 and Wendover Road at an average of £591,000.
What streets have the most affordable properties for sale in Burnham Lent Rise?
The streets with the most affordable properties for sale in Burnham Lent Rise are Missenden Gardens at an average of £191,250, Coulson Way at an average of £209,416 and Coalmans Way at an average of £371,666.
Which train stations are available in or near Burnham Lent Rise?
Some of the train stations available in or near Burnham Lent Rise are Taplow, Burnham and Maidenhead.
Property Price Paid in Burnham Lent Rise by Year
The average sold property price by year was:
| Year | Average Sold Price | Price Change |
Sold Properties
|
|---|---|---|---|
| 2025 | £497,777 | 9% |
18 Properties |
| 2024 | £454,611 | 1% |
18 Properties |
| 2023 | £449,094 | -4% |
27 Properties |
| 2022 | £469,201 | 1% |
42 Properties |
| 2021 | £465,732 | 18% |
58 Properties |
| 2020 | £383,148 | -3% |
37 Properties |
| 2019 | £394,350 | -12% |
32 Properties |
| 2018 | £440,439 | 10% |
33 Properties |
| 2017 | £394,676 | 3% |
32 Properties |
| 2016 | £381,708 | 6% |
31 Properties |
| 2015 | £357,398 | 14% |
54 Properties |
| 2014 | £305,672 | 8% |
43 Properties |
| 2013 | £280,085 | 13% |
34 Properties |
| 2012 | £243,756 | -15% |
32 Properties |
| 2011 | £280,830 | 1% |
41 Properties |
| 2010 | £277,909 | 21% |
46 Properties |
| 2009 | £219,198 | -20% |
25 Properties |
| 2008 | £262,377 | 8% |
28 Properties |
| 2007 | £241,759 | 4% |
60 Properties |
| 2006 | £233,029 | 11% |
64 Properties |
| 2005 | £207,452 | 3% |
42 Properties |
| 2004 | £201,533 | 2% |
83 Properties |
| 2003 | £198,382 | 14% |
74 Properties |
| 2002 | £170,391 | 4% |
74 Properties |
| 2001 | £162,813 | 11% |
64 Properties |
| 2000 | £144,109 | 18% |
85 Properties |
| 1999 | £118,657 | 14% |
85 Properties |
| 1998 | £102,372 | 13% |
50 Properties |
| 1997 | £89,339 | 14% |
51 Properties |
| 1996 | £76,892 | 1% |
45 Properties |
| 1995 | £76,403 | - |
50 Properties |
Property Price per Property Type in Burnham Lent Rise
Here you can find historic sold price data in order to help with your property search.
The average Property Paid Price for specific property types in the last three years are:
| Property Type | Average Sold Price | Sold Properties |
|---|---|---|
| Semi Detached House | £502,737.00 | 35 Semi Detached Houses |
| Detached House | £622,600.00 | 10 Detached Houses |
| Terraced House | £426,312.00 | 8 Terraced Houses |
| Flat | £203,625.00 | 10 Flats |

