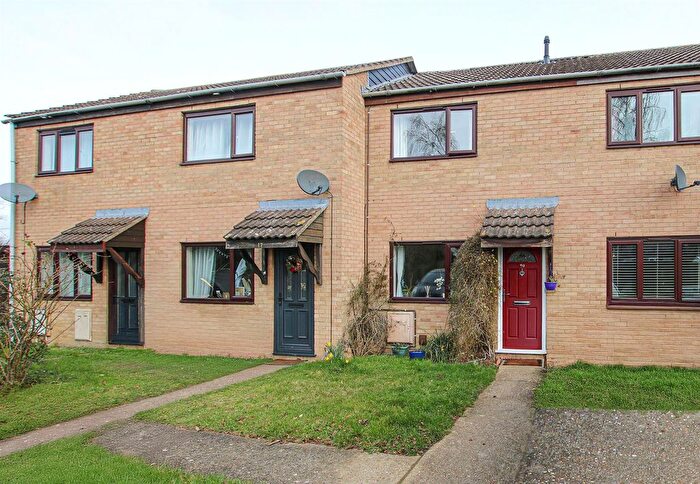
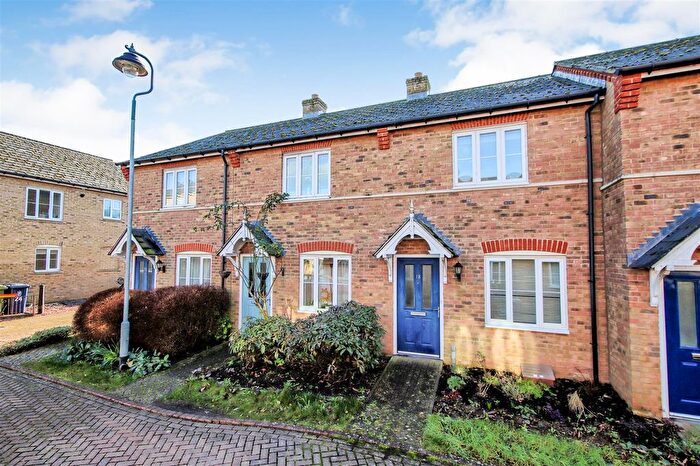
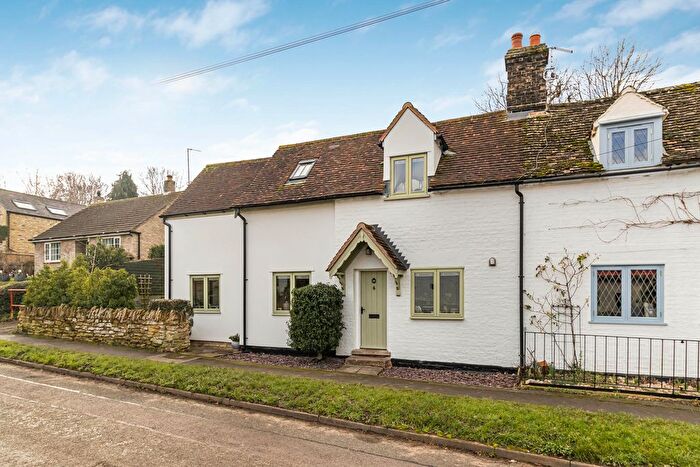
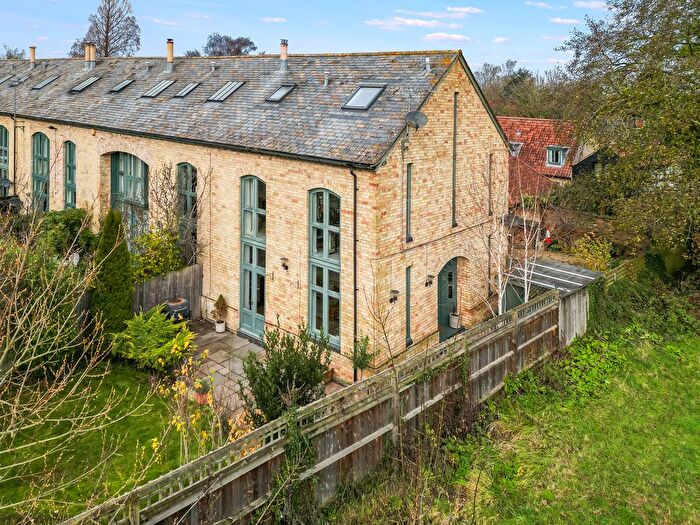
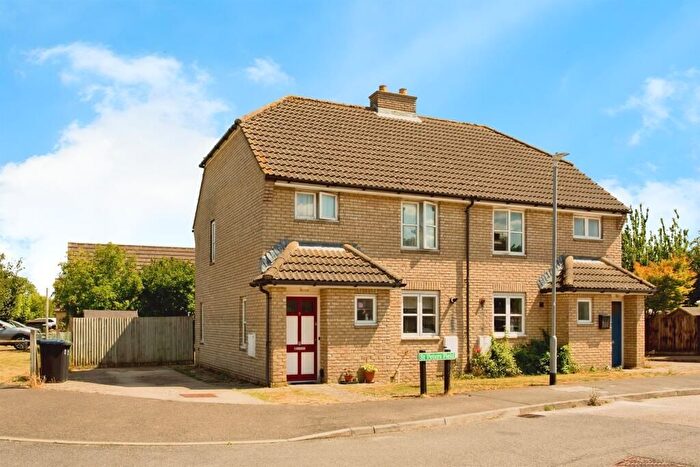
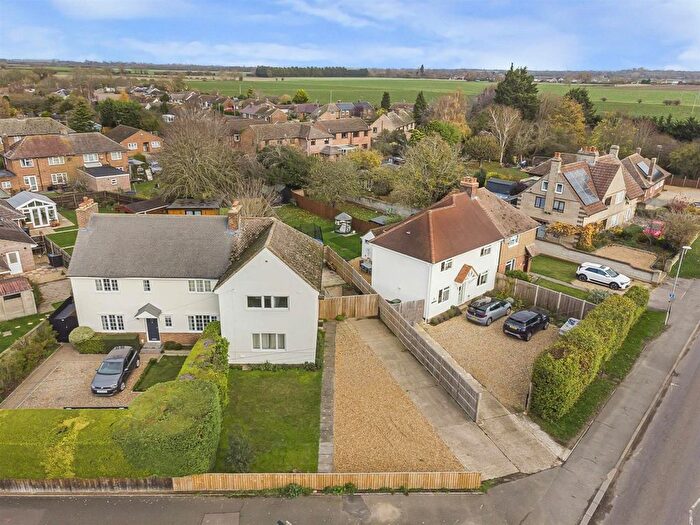
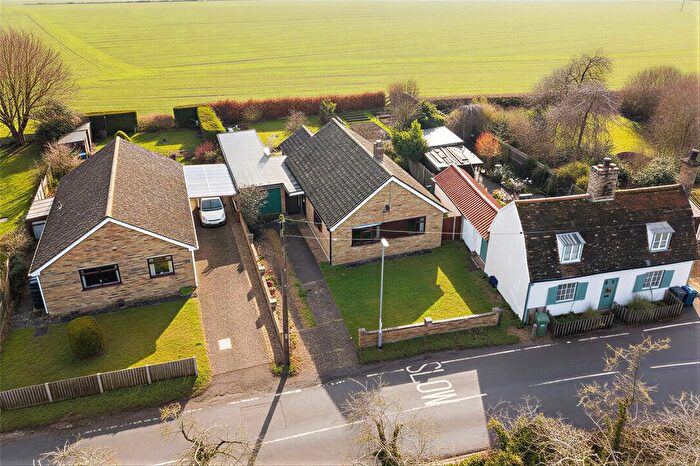
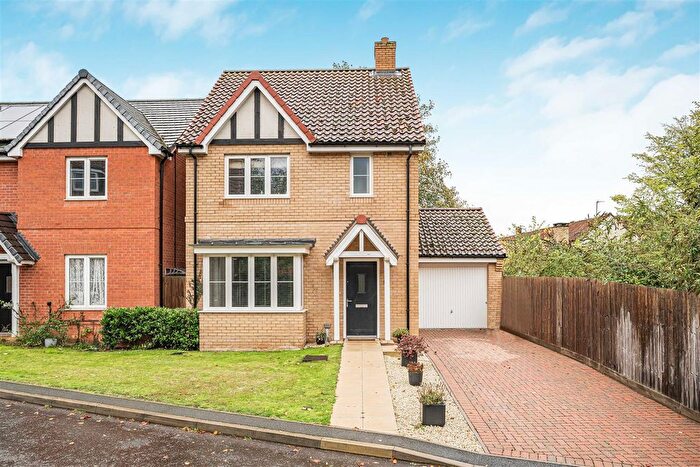
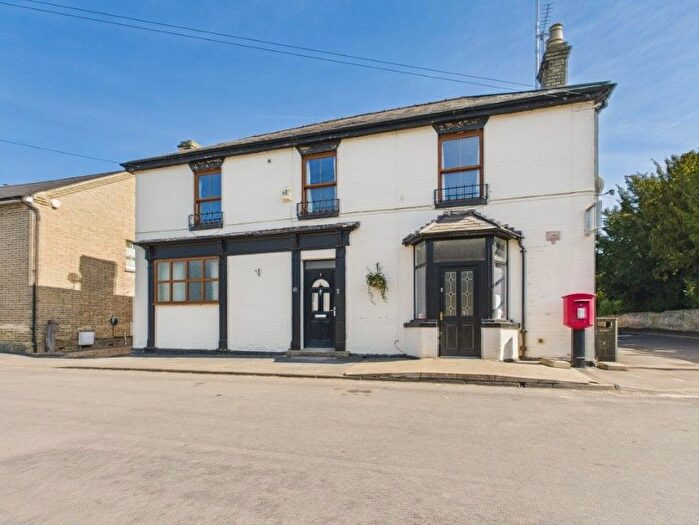
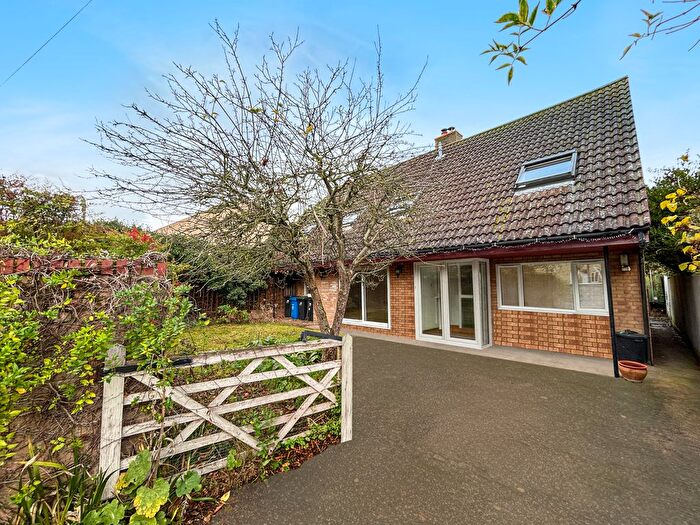
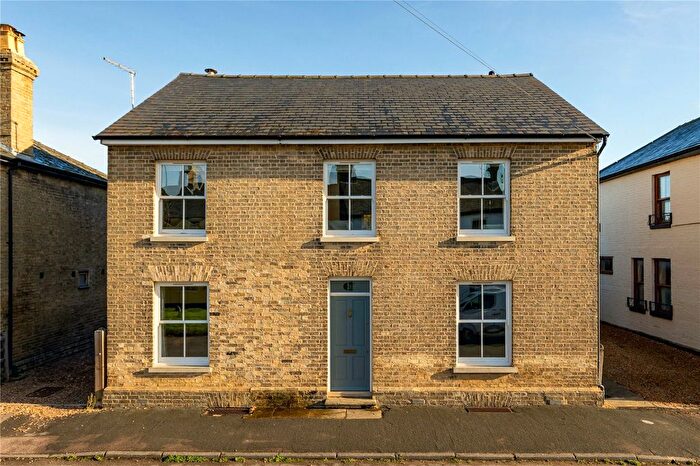
Houses for sale & to rent in Bottisham, Cambridge
House Prices in Bottisham
Properties in Bottisham have an average house price of £482,131.00 and had 105 Property Transactions within the last 3 years¹.
Bottisham is an area in Cambridge, Cambridgeshire with 1,212 households², where the most expensive property was sold for £1,545,000.00.
Properties for sale in Bottisham
Previously listed properties in Bottisham
Roads and Postcodes in Bottisham
Navigate through our locations to find the location of your next house in Bottisham, Cambridge for sale or to rent.
| Streets | Postcodes |
|---|---|
| Abbey Lane | CB25 9EP |
| Allix Grove | CB25 0FH |
| Ancient Meadows | CB25 9AX |
| Arber Close | CB25 9DR |
| Beechwood Avenue | CB25 9BE CB25 9BG CB25 9DB |
| Bell Road | CB25 9DF CB25 9GX |
| Bendish Lane | CB25 9FP |
| Bottisham Park | CB25 9ED |
| Bradfords Close | CB25 9DW |
| Cedar Walk | CB25 9BJ |
| Church Walk | CB25 9EX |
| College Close | CB25 9DP |
| Downing Close | CB25 9DD |
| Fairhaven Close | CB25 9HG CB25 9HH |
| Fassage Close | CB25 9EH |
| Fen Lane | CB25 0NH |
| Field View | CB25 0FQ |
| Foster Lane | CB25 0FA |
| High Street | CB25 9BA CB25 9BB CB25 9DA CB25 9DQ CB25 9EW CB25 9FW CB25 0LE |
| Howlett Way | CB25 9EQ |
| Jenyns Close | CB25 9DS |
| Lode Fen | CB25 9HD CB25 9HF CB25 9HE |
| Lode Road | CB25 9DJ CB25 9ER CB25 9ET CB25 9DL CB25 9DN |
| Longmeadow | CB25 9HA |
| Lysander Close | CB25 9GH |
| Maple Close | CB25 9BQ |
| Mill Road | CB25 9EN |
| Millards Lane | CB25 9ES |
| Mulberry Close | CB25 9BW |
| Newmarket Road | CB25 9BD |
| Northfields | CB25 9EU |
| Ox Meadow | CB25 9FL |
| Parsonage Barns | CB25 9EG |
| Peacock Drive | CB25 9EF |
| Pound Close | CB25 9DT |
| Prior Fen | CB7 5YJ |
| Quarry Lane | CB25 0FG |
| Quy Road | CB25 9EY CB25 9EJ |
| Rowan Close | CB25 9BN |
| Rowley Gardens | CB25 9TA |
| Spring Lane | CB25 9BL |
| St Peters Field | CB25 9DH |
| Station Road | CB25 9HB CB25 0NW |
| Stocks Close | CB25 9BY |
| Swaffham Road | CB25 9EZ |
| The Beeches | CB25 0HU |
| The Pightle | CB25 9DG |
| Thomas Christian Way | CB25 9DX |
| Trinity Close | CB25 9DE |
| Tunbridge Close | CB25 9EB |
| Tunbridge Lane | CB25 9DU CB25 9TU |
| Vineyard Walk | CB25 9BP |
| West Walk | CB25 9BH |
| Wilbraham Road | CB25 9BU |
| Willow Grove | CB25 9EL |
| Willow Way | CB25 9BS |
| Wisbeach Close | CB25 9DY |
| Woodward Drive | CB25 9EE |
| CB25 9BX CB25 9QY CB25 9WH CB25 9WJ CB25 9XF |
Transport near Bottisham
-
Waterbeach Station
-
Cambridge North Station
-
Dullingham Station
-
Cambridge Station
-
Newmarket Station
-
Shelford Station
-
Whittlesford Station
- FAQ
- Price Paid By Year
- Property Type Price
Frequently asked questions about Bottisham
What is the average price for a property for sale in Bottisham?
The average price for a property for sale in Bottisham is £482,131. This amount is 6% lower than the average price in Cambridge. There are 198 property listings for sale in Bottisham.
What streets have the most expensive properties for sale in Bottisham?
The streets with the most expensive properties for sale in Bottisham are Allix Grove at an average of £815,000, Rowley Gardens at an average of £715,000 and Stocks Close at an average of £683,750.
What streets have the most affordable properties for sale in Bottisham?
The streets with the most affordable properties for sale in Bottisham are Arber Close at an average of £159,000, Fairhaven Close at an average of £271,166 and Longmeadow at an average of £301,666.
Which train stations are available in or near Bottisham?
Some of the train stations available in or near Bottisham are Waterbeach, Cambridge North and Dullingham.
Property Price Paid in Bottisham by Year
The average sold property price by year was:
| Year | Average Sold Price | Price Change |
Sold Properties
|
|---|---|---|---|
| 2025 | £475,718 | -5% |
32 Properties |
| 2024 | £500,943 | 8% |
44 Properties |
| 2023 | £460,667 | -16% |
29 Properties |
| 2022 | £534,034 | 19% |
45 Properties |
| 2021 | £432,942 | 7% |
40 Properties |
| 2020 | £404,358 | 15% |
30 Properties |
| 2019 | £342,093 | -18% |
32 Properties |
| 2018 | £403,260 | 2% |
40 Properties |
| 2017 | £395,224 | -7% |
58 Properties |
| 2016 | £421,801 | 12% |
53 Properties |
| 2015 | £371,455 | 6% |
41 Properties |
| 2014 | £348,294 | 13% |
50 Properties |
| 2013 | £304,646 | 4% |
39 Properties |
| 2012 | £293,069 | 7% |
42 Properties |
| 2011 | £271,141 | 1% |
57 Properties |
| 2010 | £269,509 | 14% |
36 Properties |
| 2009 | £232,351 | -9% |
37 Properties |
| 2008 | £254,200 | -11% |
41 Properties |
| 2007 | £282,866 | 24% |
50 Properties |
| 2006 | £216,101 | -3% |
33 Properties |
| 2005 | £223,488 | 8% |
43 Properties |
| 2004 | £205,242 | -4% |
41 Properties |
| 2003 | £214,392 | 27% |
33 Properties |
| 2002 | £156,593 | -5% |
48 Properties |
| 2001 | £164,762 | 8% |
46 Properties |
| 2000 | £151,463 | 4% |
39 Properties |
| 1999 | £145,467 | 23% |
66 Properties |
| 1998 | £112,118 | - |
50 Properties |
| 1997 | £112,147 | 18% |
49 Properties |
| 1996 | £92,411 | 11% |
46 Properties |
| 1995 | £82,031 | - |
29 Properties |
Property Price per Property Type in Bottisham
Here you can find historic sold price data in order to help with your property search.
The average Property Paid Price for specific property types in the last three years are:
| Property Type | Average Sold Price | Sold Properties |
|---|---|---|
| Semi Detached House | £416,875.00 | 28 Semi Detached Houses |
| Detached House | £603,366.00 | 52 Detached Houses |
| Terraced House | £312,578.00 | 23 Terraced Houses |
| Flat | £193,500.00 | 2 Flats |

