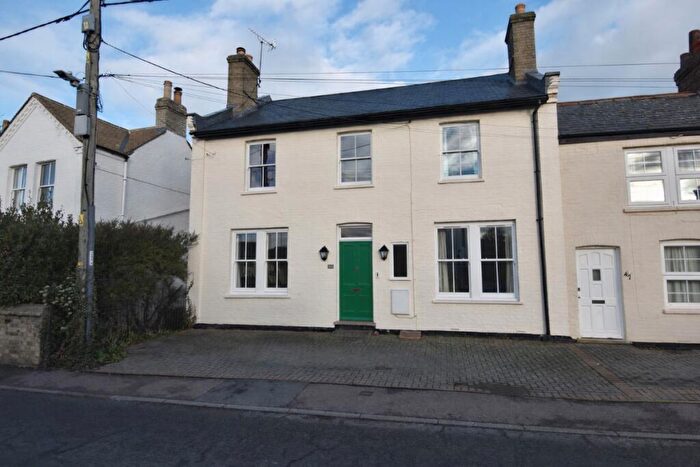
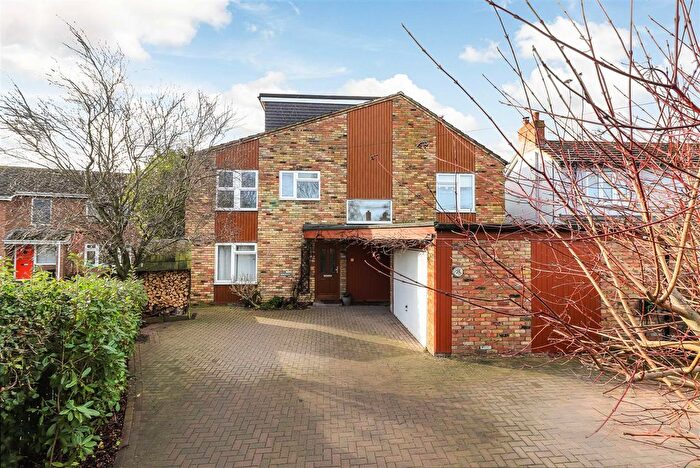
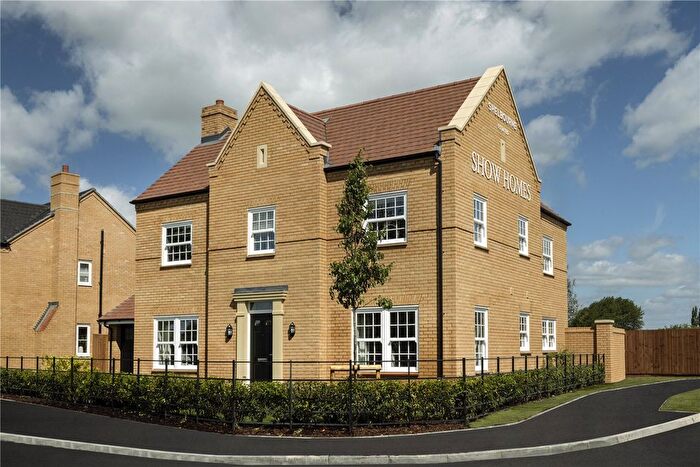
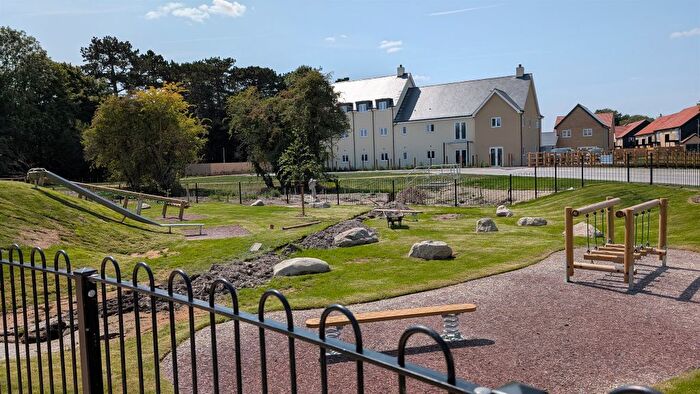
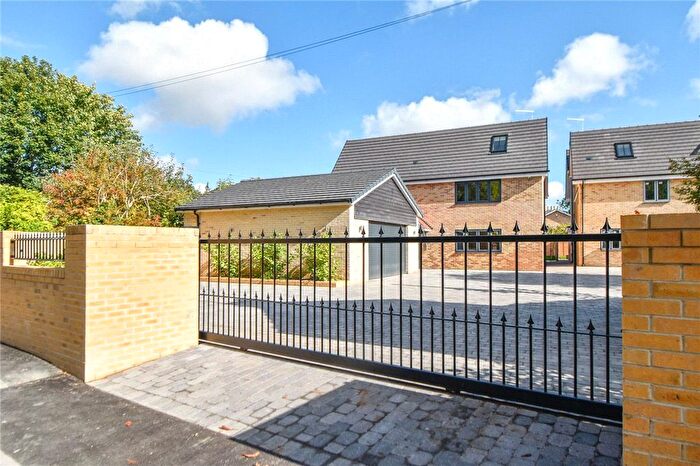
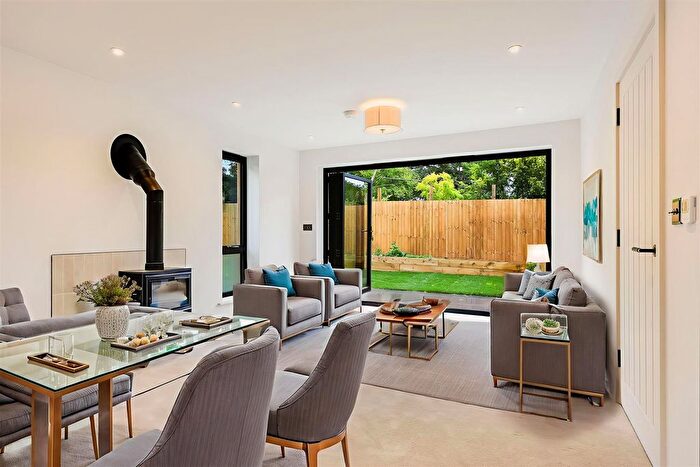
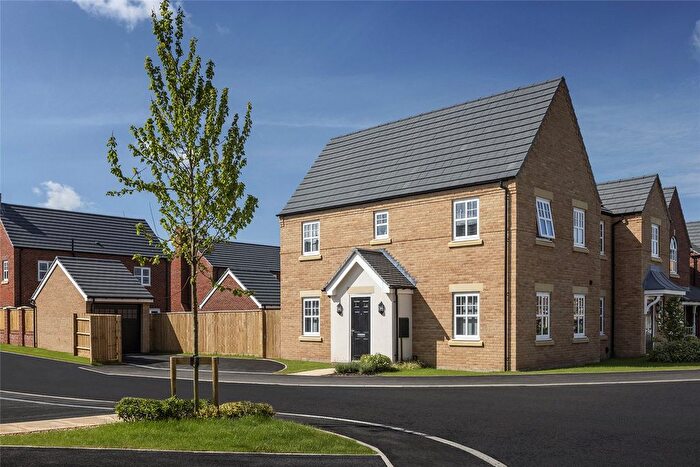
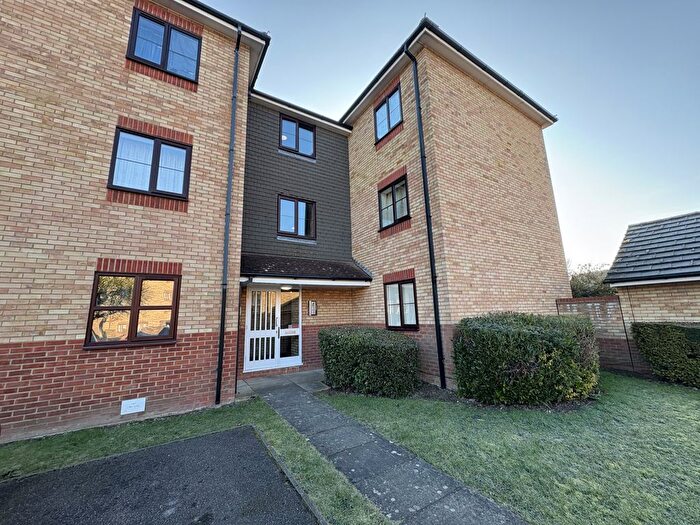
Houses for sale & to rent in Fulbourn, Cambridge
House Prices in Fulbourn
Properties in Fulbourn have an average house price of £520,240.00 and had 167 Property Transactions within the last 3 years¹.
Fulbourn is an area in Cambridge, Cambridgeshire with 1,771 households², where the most expensive property was sold for £1,400,000.00.
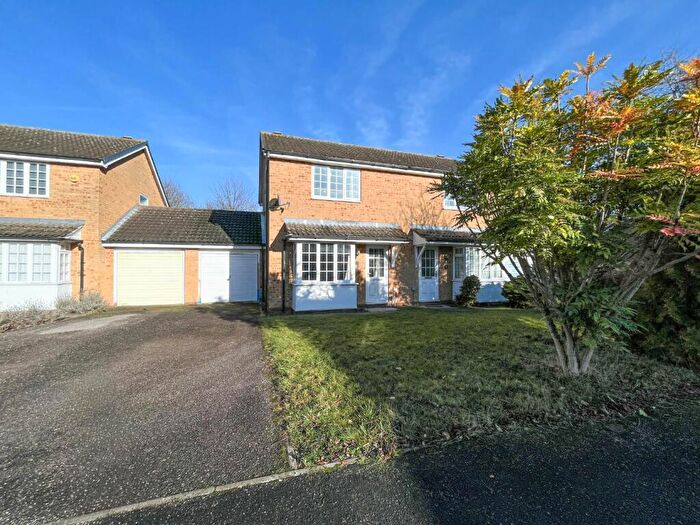
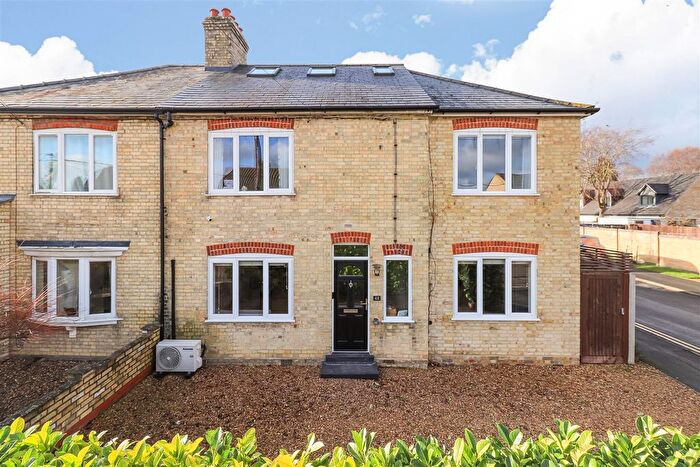
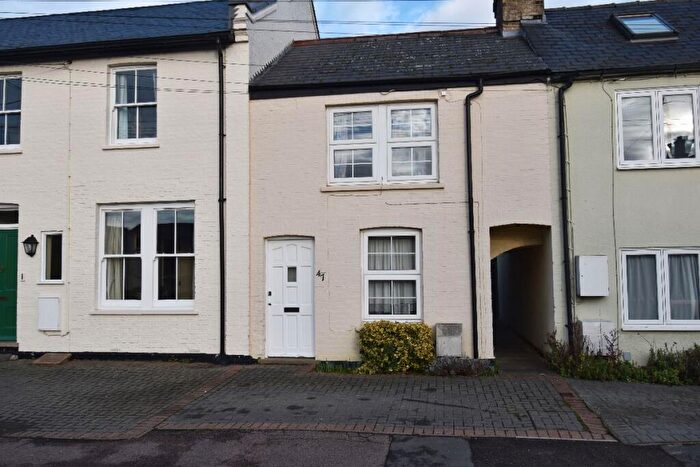
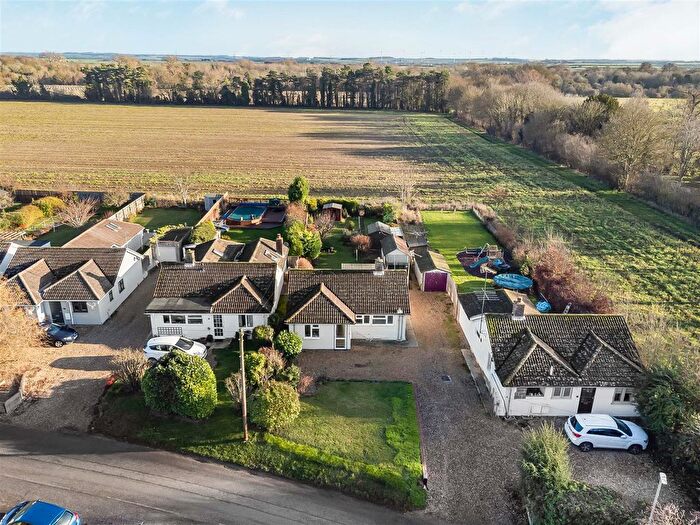
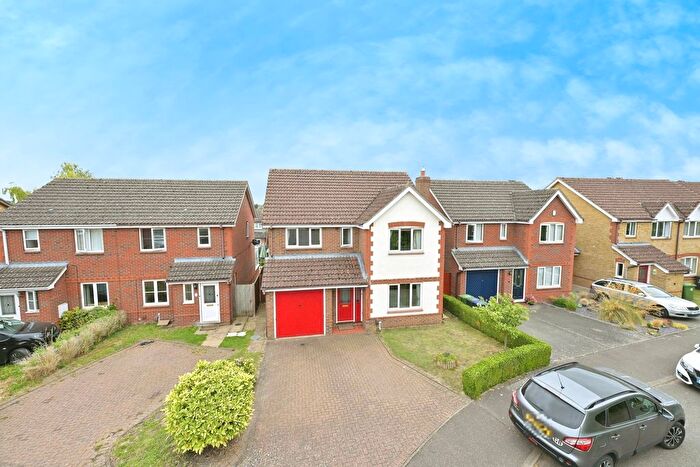
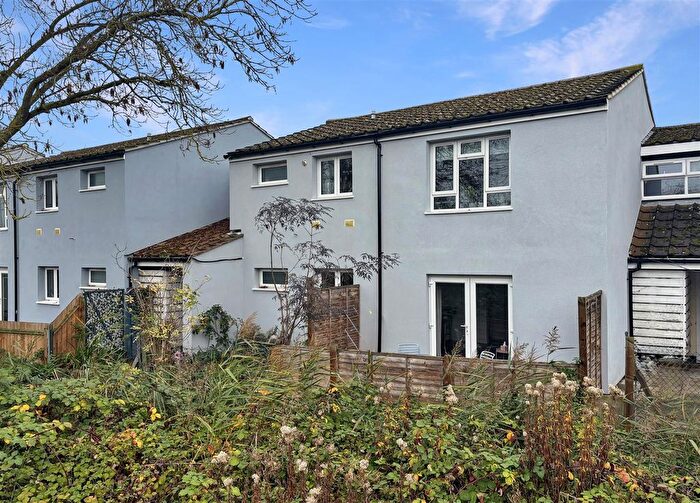
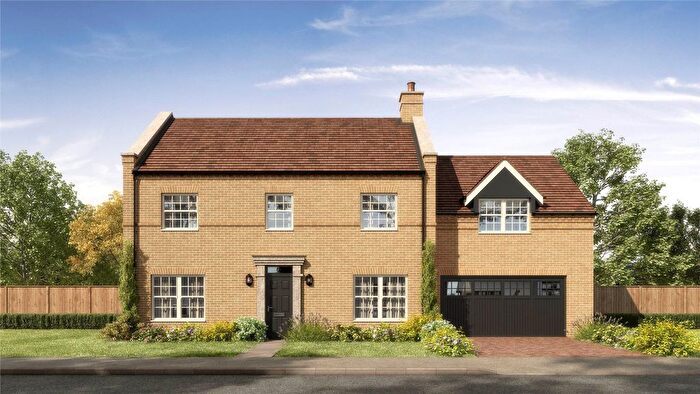
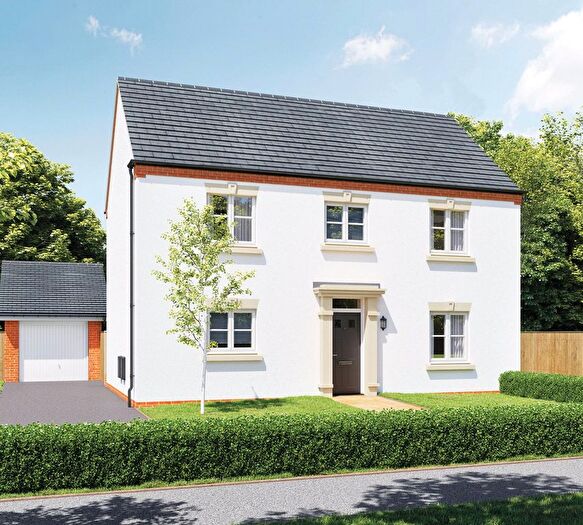
Properties for sale in Fulbourn
Previously listed properties in Fulbourn
Roads and Postcodes in Fulbourn
Navigate through our locations to find the location of your next house in Fulbourn, Cambridge for sale or to rent.
| Streets | Postcodes |
|---|---|
| All Saints Road | CB21 5HF |
| Apthorpe Street | CB21 5EY |
| Balsham Road | CB21 5BZ CB21 5DA |
| Barnsfield | CB21 5DD |
| Bird Farm Road | CB21 5DP |
| Brunswick Court | CB21 5XN |
| Cambridge Road | CB21 5EG CB21 5HH CB21 5HQ |
| Caraway Road | CB21 5DU |
| Chaplins Close | CB21 5HU |
| Cherry Orchard | CB21 5EH |
| Church Lane | CB21 5EP |
| Clover Court | CB1 9YN |
| Coltsfoot Close | CB1 9YH |
| Comfrey Court | CB1 9YJ |
| Cow Lane | CB21 5HB |
| Coxs Drove | CB21 5HE |
| Doggets Lane | CB21 5BT |
| Dunmowe Way | CB21 5HW |
| Farmers Row | CB21 5HL |
| Fromont Close | CB21 5HS |
| Fulbourn Old Drift | CB1 9LT |
| Geoffrey Bishop Avenue | CB21 5BU |
| Grandridge Close | CB21 5HN |
| Greater Foxes | CB21 5EZ |
| Haggis Gap | CB21 5HD |
| Harebell Close | CB1 9YL |
| High Street | CB21 5DH |
| Highfield Gate | CB21 5HA |
| Hinton Road | CB21 5DZ |
| Hollmans Close | CB21 5HT |
| Home End | CB21 5BS |
| Huntsmill | CB21 5RH |
| Impetts Lane | CB21 5BY |
| Jeeves Acre | CB21 5DB |
| Lanthorn Stile | CB21 5AB |
| Lucerne Close | CB1 9YR |
| Ludlow Lane | CB21 5BL |
| Manor Walk | CB21 5BN |
| Marchs Close | CB21 5DX |
| Northfield | CB21 5EW |
| Oslars Way | CB21 5DS |
| Pettits Close | CB21 5BJ |
| Pierce Lane | CB21 5DJ CB21 5DL |
| Roberts Way | CB21 5AA |
| Rushden Close | CB21 5AF |
| Sanders Lane | CB21 5BX |
| School Lane | CB21 5BH |
| Shelford Road | CB21 5HJ |
| Speedwell Close | CB1 9YS CB1 9YZ |
| St Vigors Road | CB21 5HG |
| Stack Yard Court | CB21 5AD |
| Stansfield Gardens | CB21 5HX |
| Station Road | CB21 5ER CB21 5ES |
| Stonebridge Lane | CB21 5BW |
| Swifts Corner | CB21 5AE |
| Teasel Way | CB1 9YT |
| Teversham Road | CB1 9AN CB21 5EB |
| The Bourns | CB21 5BF |
| The Chantry | CB21 5EJ |
| The Cornway | CB21 5DF |
| The Croft | CB21 5DR |
| The Haven | CB21 5BG |
| The Maples | CB21 5DW |
| The Pines | CB21 5HZ |
| Town Close | CB21 5DN |
| Valerian Court | CB1 9YP |
| Violet Close | CB1 9YW |
| Weston Grove | CB21 5DY |
| Wilbraham Road | CB21 5GT |
| Windmill Lane | CB21 5DT |
| Wrights Grove | CB21 5HY |
Transport near Fulbourn
- FAQ
- Price Paid By Year
- Property Type Price
Frequently asked questions about Fulbourn
What is the average price for a property for sale in Fulbourn?
The average price for a property for sale in Fulbourn is £520,240. This amount is 1% higher than the average price in Cambridge. There are 288 property listings for sale in Fulbourn.
What streets have the most expensive properties for sale in Fulbourn?
The streets with the most expensive properties for sale in Fulbourn are Balsham Road at an average of £1,008,333, Ludlow Lane at an average of £895,000 and Station Road at an average of £869,583.
What streets have the most affordable properties for sale in Fulbourn?
The streets with the most affordable properties for sale in Fulbourn are Dunmowe Way at an average of £255,583, Speedwell Close at an average of £280,136 and Swifts Corner at an average of £287,000.
Which train stations are available in or near Fulbourn?
Some of the train stations available in or near Fulbourn are Cambridge, Cambridge North and Shelford.
Property Price Paid in Fulbourn by Year
The average sold property price by year was:
| Year | Average Sold Price | Price Change |
Sold Properties
|
|---|---|---|---|
| 2025 | £473,079 | -17% |
51 Properties |
| 2024 | £553,699 | 6% |
73 Properties |
| 2023 | £519,372 | -8% |
43 Properties |
| 2022 | £560,199 | 14% |
65 Properties |
| 2021 | £483,904 | 11% |
72 Properties |
| 2020 | £431,856 | 2% |
52 Properties |
| 2019 | £424,807 | 2% |
54 Properties |
| 2018 | £414,639 | 2% |
70 Properties |
| 2017 | £408,246 | 0,5% |
47 Properties |
| 2016 | £406,246 | -8% |
54 Properties |
| 2015 | £437,408 | 25% |
66 Properties |
| 2014 | £326,342 | 13% |
77 Properties |
| 2013 | £284,588 | 1% |
67 Properties |
| 2012 | £280,685 | 9% |
64 Properties |
| 2011 | £255,630 | -23% |
86 Properties |
| 2010 | £314,790 | 25% |
74 Properties |
| 2009 | £236,143 | -12% |
88 Properties |
| 2008 | £265,498 | -12% |
48 Properties |
| 2007 | £297,068 | 14% |
64 Properties |
| 2006 | £255,760 | 5% |
67 Properties |
| 2005 | £242,945 | 8% |
61 Properties |
| 2004 | £222,663 | 9% |
71 Properties |
| 2003 | £202,933 | 9% |
96 Properties |
| 2002 | £184,307 | 18% |
85 Properties |
| 2001 | £150,600 | 4% |
106 Properties |
| 2000 | £145,313 | 26% |
88 Properties |
| 1999 | £108,240 | -4% |
103 Properties |
| 1998 | £112,755 | 8% |
104 Properties |
| 1997 | £103,614 | 21% |
137 Properties |
| 1996 | £81,905 | -6% |
91 Properties |
| 1995 | £86,953 | - |
134 Properties |
Property Price per Property Type in Fulbourn
Here you can find historic sold price data in order to help with your property search.
The average Property Paid Price for specific property types in the last three years are:
| Property Type | Average Sold Price | Sold Properties |
|---|---|---|
| Semi Detached House | £452,349.00 | 58 Semi Detached Houses |
| Detached House | £721,483.00 | 60 Detached Houses |
| Terraced House | £403,852.00 | 35 Terraced Houses |
| Flat | £230,000.00 | 14 Flats |

