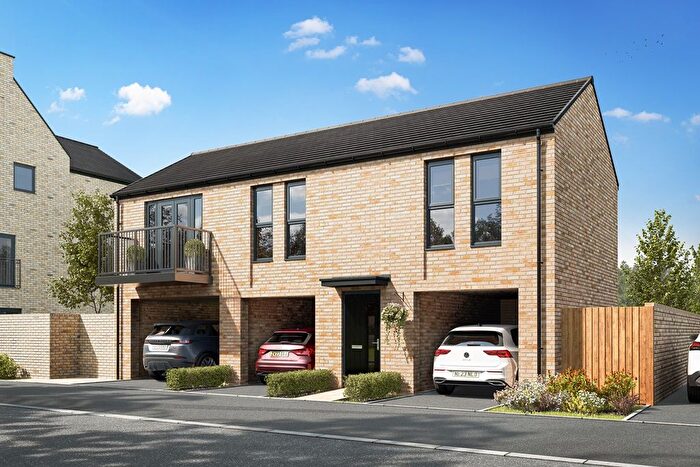
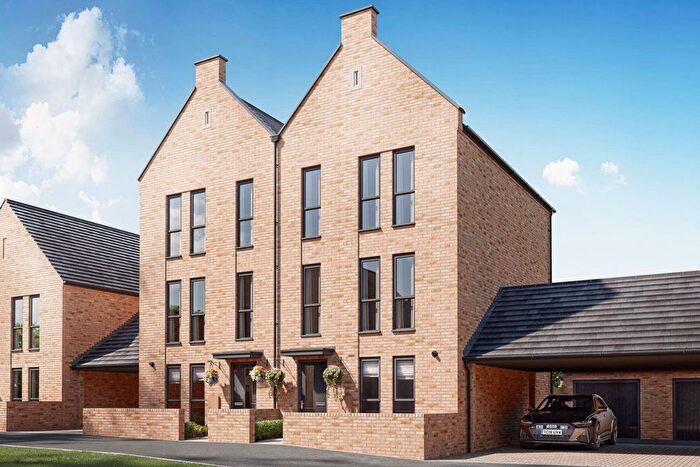
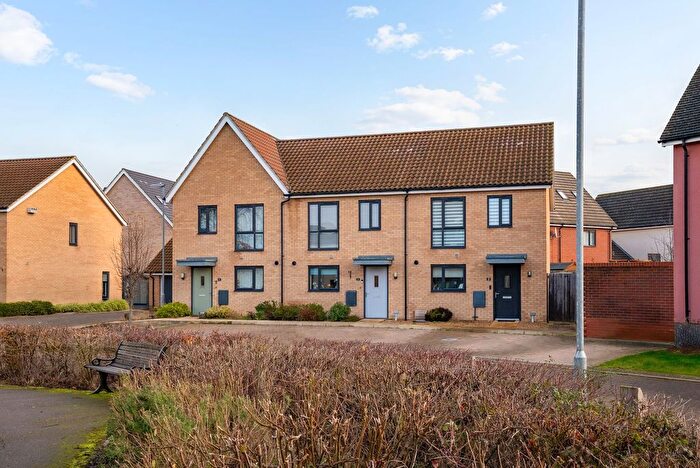
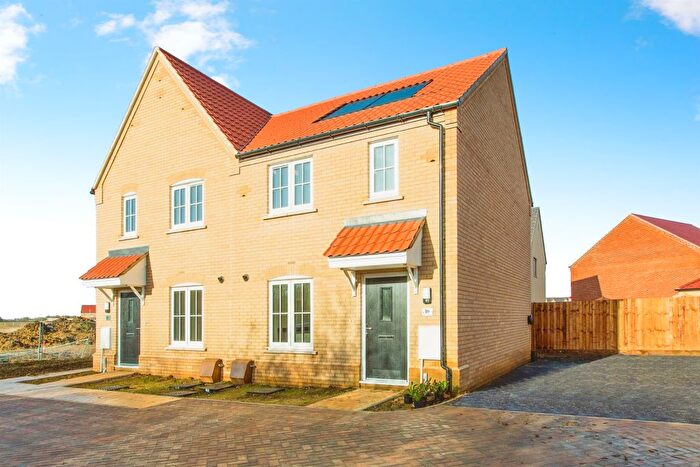
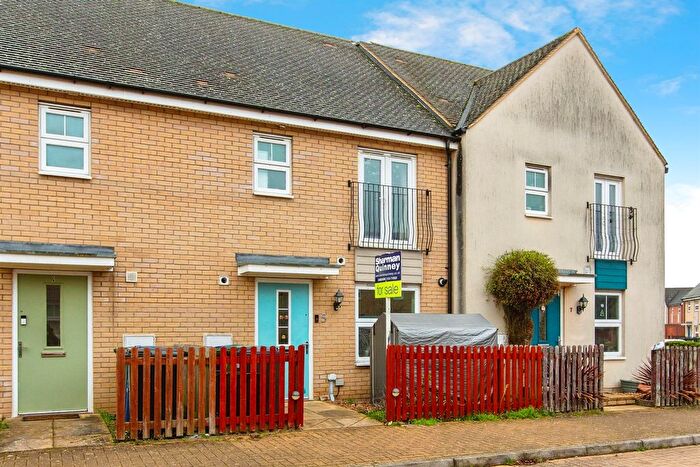
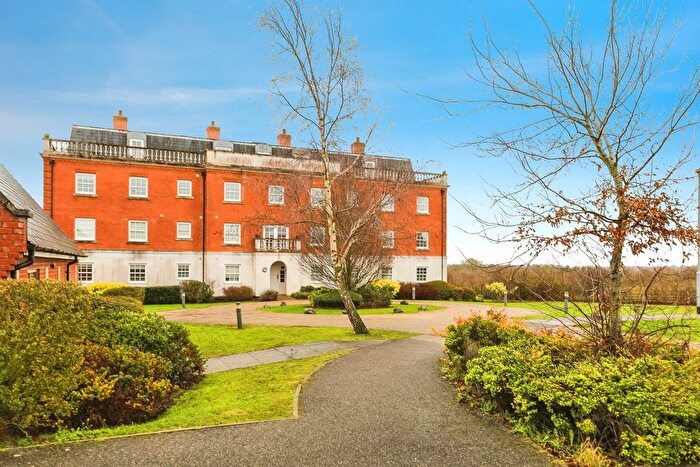
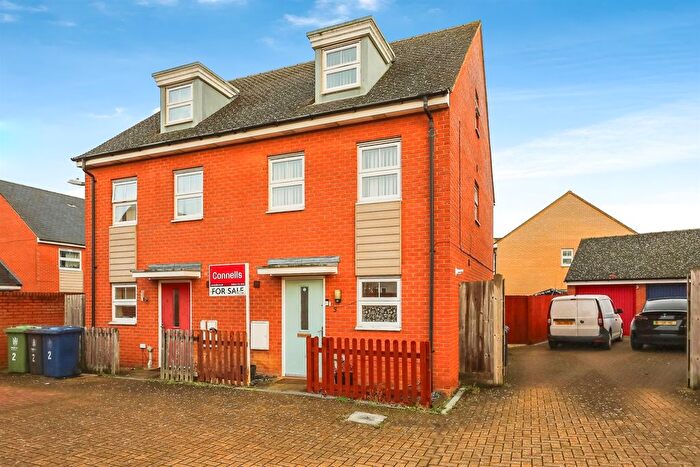
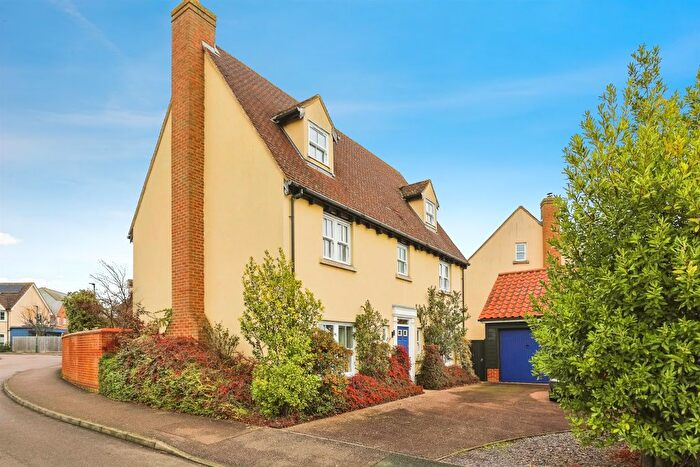
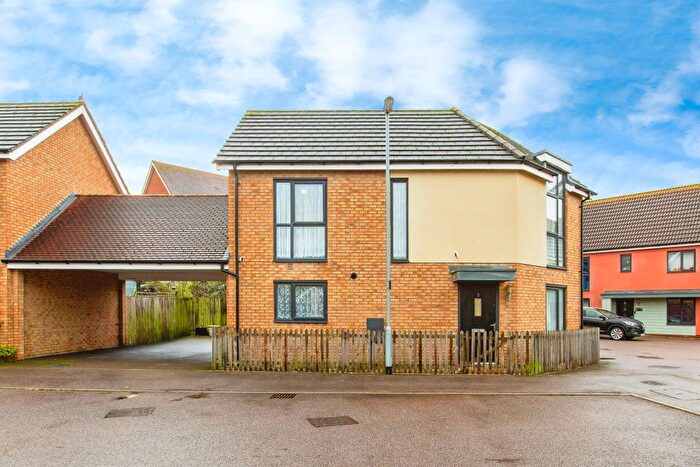
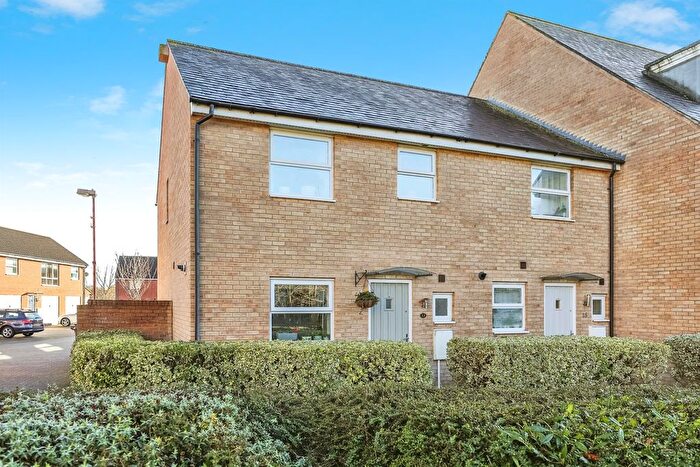
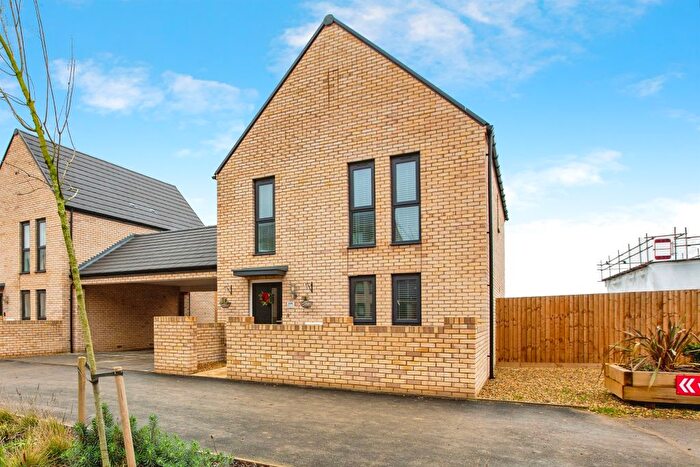
Houses for sale & to rent in Cambourne, Cambridge
House Prices in Cambourne
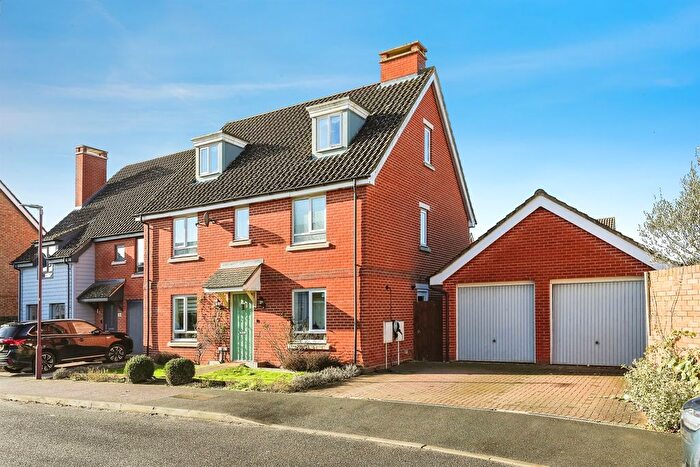
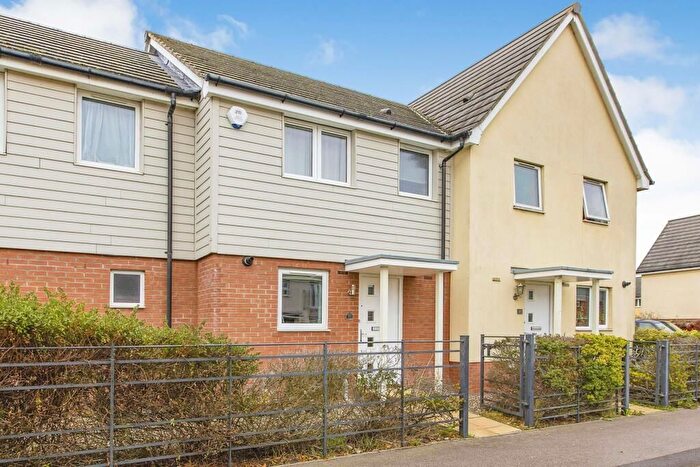
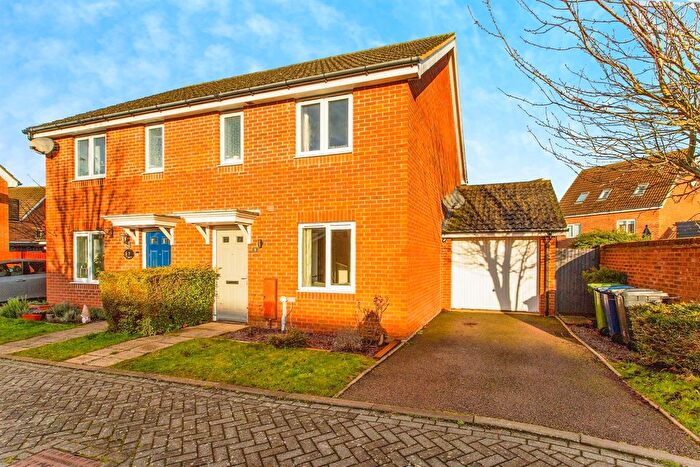
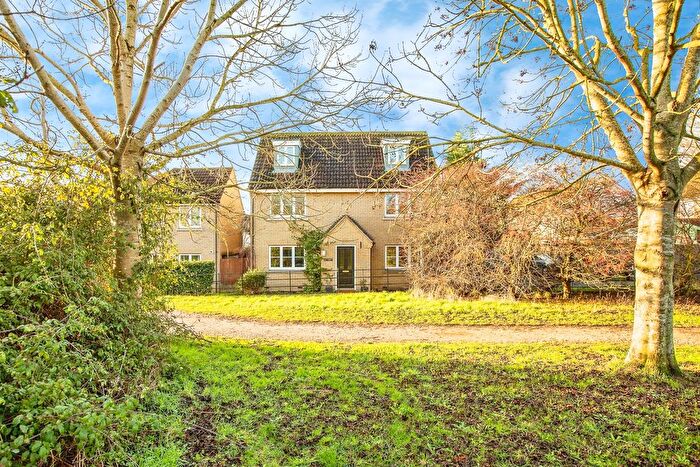
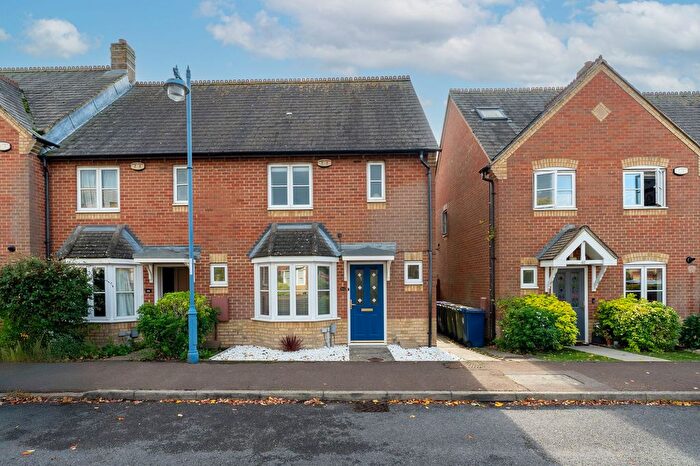
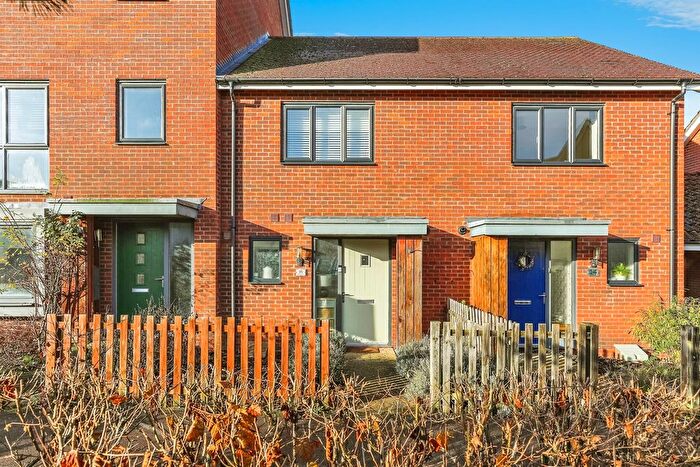
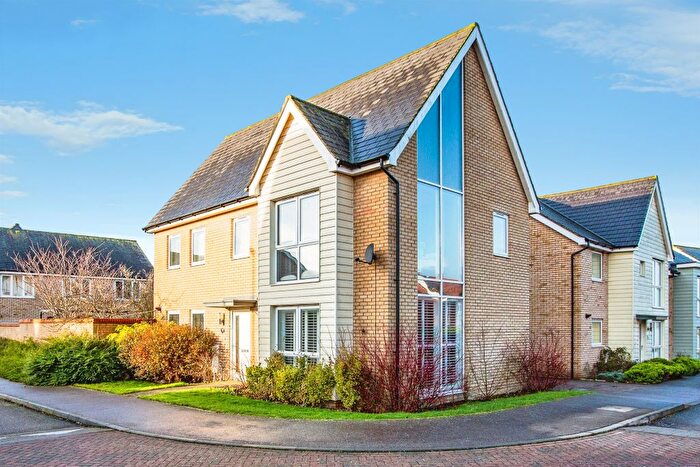
Properties in Cambourne have an average house price of £343,765.00 and had 87 Property Transactions within the last 3 years¹.
Cambourne is an area in Cambridge, Cambridgeshire with 138 households², where the most expensive property was sold for £730,000.00.
Properties for sale in Cambourne
Previously listed properties in Cambourne
Roads and Postcodes in Cambourne
Navigate through our locations to find the location of your next house in Cambourne, Cambridge for sale or to rent.
| Streets | Postcodes |
|---|---|
| Albacore Road | CB23 6JH |
| Back Lane | CB23 6BW CB23 6JL CB23 6LA CB23 6LJ |
| Barker Way | CB23 6LW |
| Battle Close | CB23 6LF |
| Beaufighter Drive | CB23 6JJ |
| Bisley Crescent | CB23 6JA |
| Blackbird Close | CB23 6LD |
| Botha Close | CB23 6HZ |
| Bristol Drive | CB23 6JE |
| Broad Street | CB23 6EY CB23 6JN |
| Butler Walk | CB23 6HP |
| Cambourne Business Park | CB1 0SN CB1 0SW CB1 0SX CB1 0SY CB1 0SZ CB1 0TA CB1 0TB CB1 0TD CB1 0TE CB1 0TF CB1 0TG CB1 0TH CB1 0TJ CB1 0TL CB1 0TN CB1 0TP CB1 0TQ CB1 0TR CB1 0TS CB1 0TT CB1 0TU CB1 0TW CB1 0TX CB1 0TY CB1 0TZ CB1 0UA CB1 0UB CB1 0UD CB1 0UE CB1 0UF CB1 0UG CB1 0UH CB1 0UJ CB1 0UL CB1 0UN CB23 6DP CB23 6DW CB23 6EA CB1 0JN CB1 0UQ |
| Cavell Avenue | CB23 6LN |
| Crowdean Lane | CB23 4LA |
| Damson Way | CB23 5EJ |
| De Havilland Close | CB23 6BN CB23 6BP |
| De La Warr Way | CB23 6DX |
| Dobbins Avenue | CB23 6LL CB23 6LT |
| Eastgate | CB23 6DZ |
| Fairey Close | CB23 6JW |
| Firefly Road | CB23 6FW |
| Gauntlet Drive | CB23 6LE |
| Gladiator Road | CB23 6JQ CB23 6JY CB23 6JZ |
| Gloster Drive | CB23 6FA |
| Handley Drive | CB23 6EN |
| Hawkers Close | CB23 6JT |
| High Street | CB23 6BJ CB23 6JX |
| Hill Drive | CB23 6LU |
| Hind Close | CB23 6JG |
| Hobbs Way | CB23 6LX |
| Hop Gardens | CB23 5FW |
| Hudson Road | CB23 6ED |
| Hurricane Way | CB23 6DG |
| Lysander Close | CB23 6DR |
| Mcluhan Street | CB23 6LQ |
| Monkfield | CB23 2TD |
| Otter Road | CB23 6JD |
| Robson Close | CB23 6LY |
| Roe Walk | CB23 6EJ |
| Sackville Way | CB23 6EG CB23 6HL |
| School Lane | CB23 5AX CB23 5DZ CB23 5FX |
| Sharland Lane | CB23 6LP |
| Sheepfold Lane | CB23 6EF |
| Short Drive | CB23 6JU |
| Smithy Way | CB23 6HR |
| Squire Drive | CB23 6HQ |
| Stable Yard | CB23 5EG |
| Sunderland Close | CB23 6JB |
| Swordfish Drive | CB23 6LG |
| Tempest Road | CB23 6HW |
| The Paddock | CB23 5EH |
| The Vines | CB23 6DY |
| Typhoon Way | CB23 6JR |
| Ventura Avenue | CB23 6HX |
| Wallis Walk | CB23 6EQ |
| Welkin Way | CB23 6FS |
| Whirlwind Close | CB23 6JS |
| Whittle Way | CB23 6LB |
| York Drive | CB23 6JF |
| CB23 6LH |
Transport near Cambourne
-
St.Neots Station
-
Shepreth Station
-
Foxton Station
-
Cambridge Station
-
Huntingdon Station
-
Meldreth Station
-
Cambridge North Station
- FAQ
- Price Paid By Year
- Property Type Price
Frequently asked questions about Cambourne
What is the average price for a property for sale in Cambourne?
The average price for a property for sale in Cambourne is £343,765. This amount is 33% lower than the average price in Cambridge. There are 853 property listings for sale in Cambourne.
What streets have the most expensive properties for sale in Cambourne?
The streets with the most expensive properties for sale in Cambourne are Bristol Drive at an average of £650,000, Whirlwind Close at an average of £565,000 and Ventura Avenue at an average of £535,000.
What streets have the most affordable properties for sale in Cambourne?
The streets with the most affordable properties for sale in Cambourne are Firefly Road at an average of £315,250, Welkin Way at an average of £341,500 and Hudson Road at an average of £355,000.
Which train stations are available in or near Cambourne?
Some of the train stations available in or near Cambourne are St.Neots, Shepreth and Foxton.
Property Price Paid in Cambourne by Year
The average sold property price by year was:
| Year | Average Sold Price | Price Change |
Sold Properties
|
|---|---|---|---|
| 2025 | £370,289 | 7% |
19 Properties |
| 2024 | £342,954 | 3% |
23 Properties |
| 2023 | £332,980 | 12% |
45 Properties |
| 2022 | £291,884 | -5% |
51 Properties |
| 2021 | £307,074 | -14% |
41 Properties |
| 2020 | £348,995 | -24% |
31 Properties |
| 2019 | £433,289 | 22% |
69 Properties |
| 2018 | £338,971 | 1% |
98 Properties |
| 2017 | £335,537 | -1% |
70 Properties |
| 2016 | £340,428 | 2% |
65 Properties |
| 2015 | £332,622 | 21% |
101 Properties |
| 2014 | £261,890 | - |
68 Properties |
Property Price per Property Type in Cambourne
Here you can find historic sold price data in order to help with your property search.
The average Property Paid Price for specific property types in the last three years are:
| Property Type | Average Sold Price | Sold Properties |
|---|---|---|
| Semi Detached House | £333,000.00 | 22 Semi Detached Houses |
| Detached House | £486,556.00 | 25 Detached Houses |
| Terraced House | £298,500.00 | 11 Terraced Houses |
| Flat | £246,004.00 | 29 Flats |

