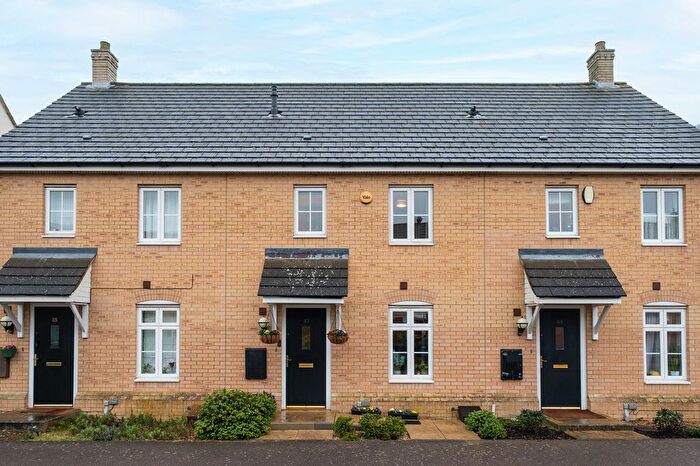
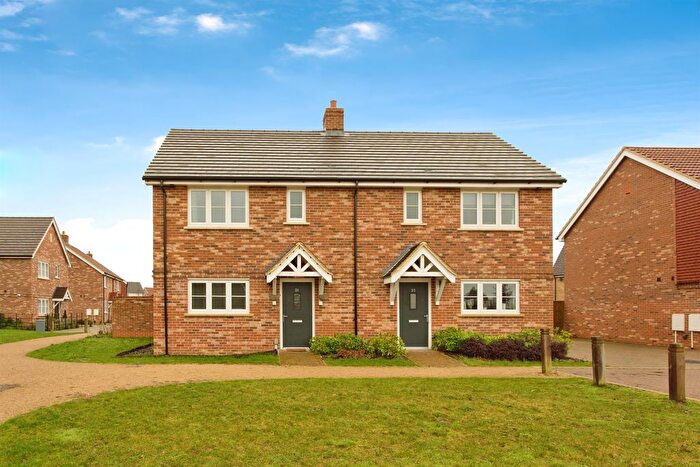
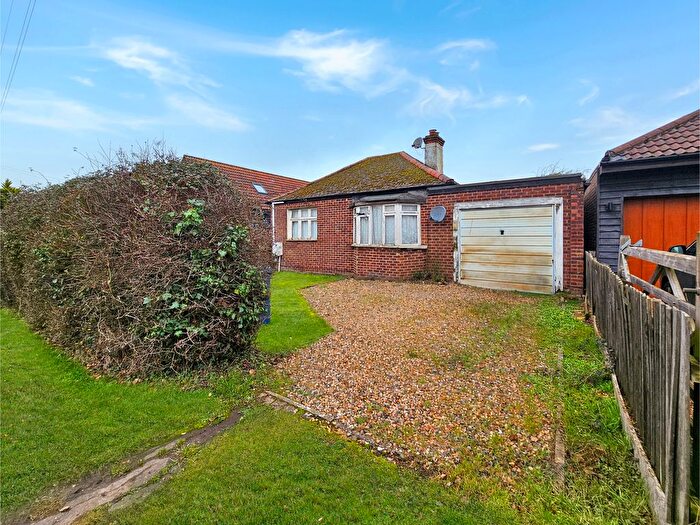
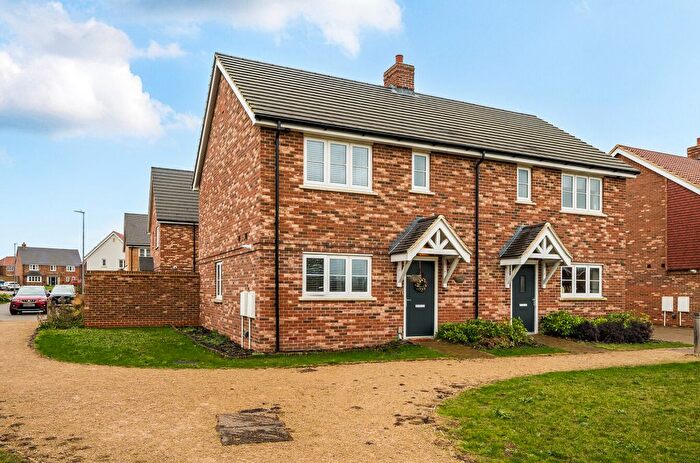
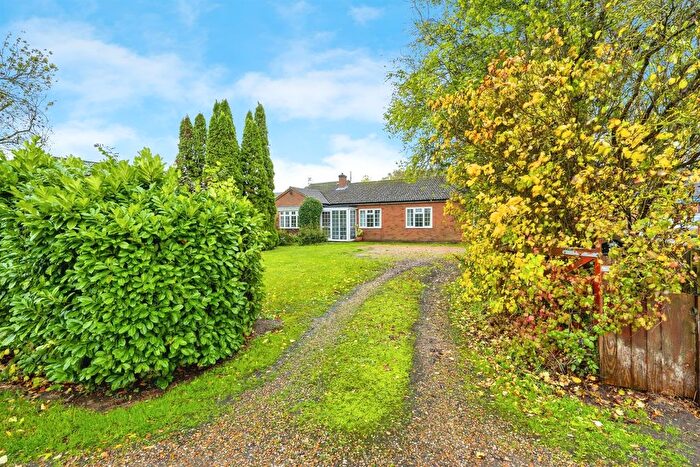
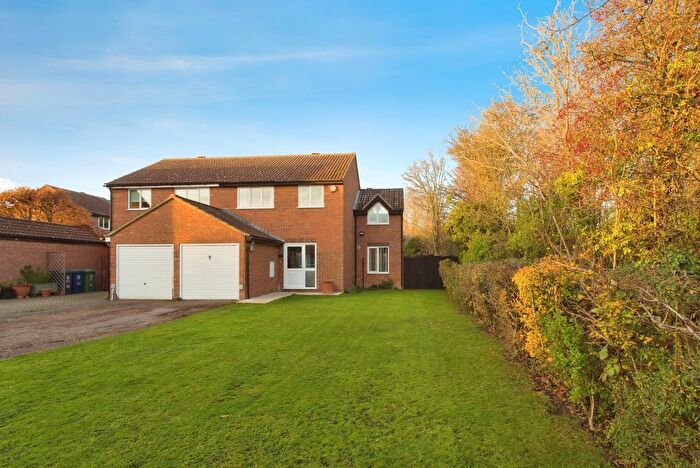
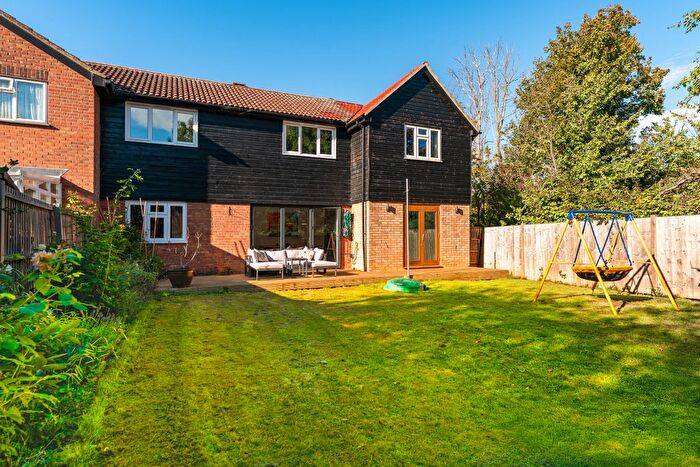
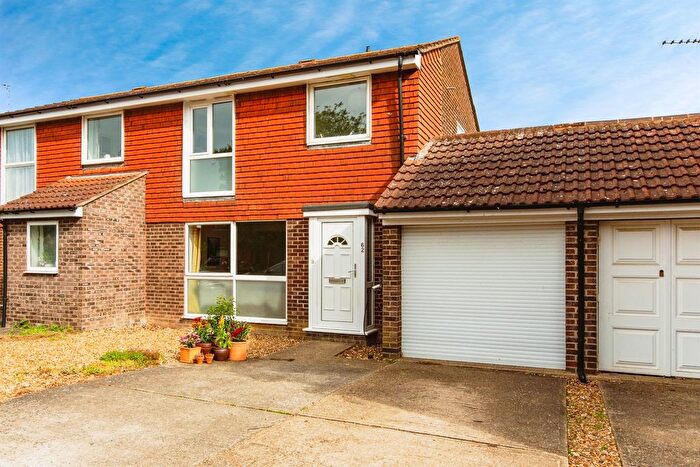
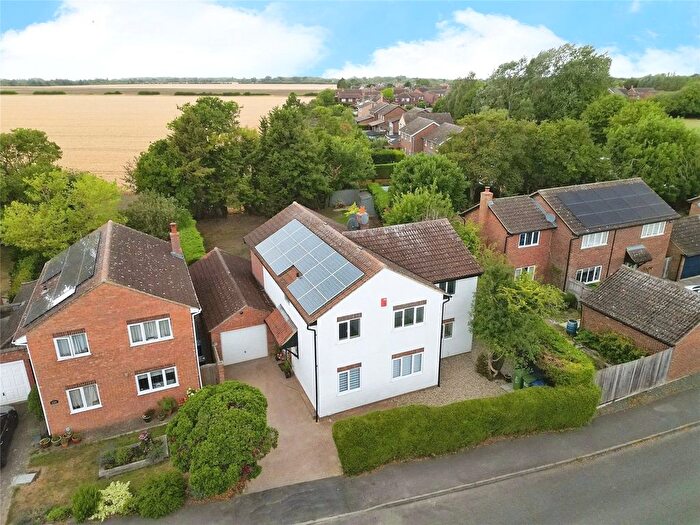
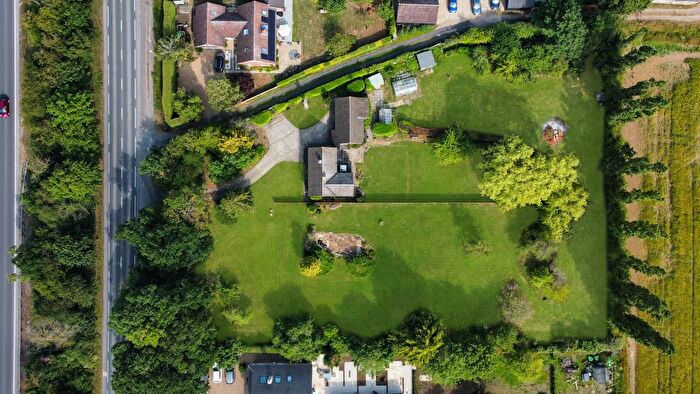
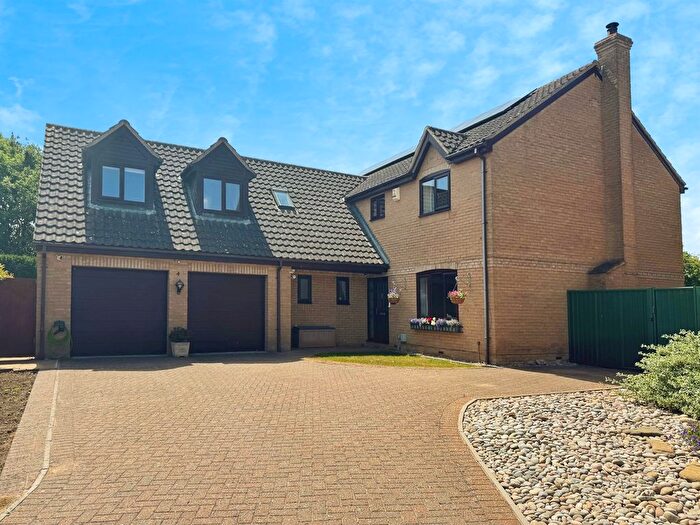
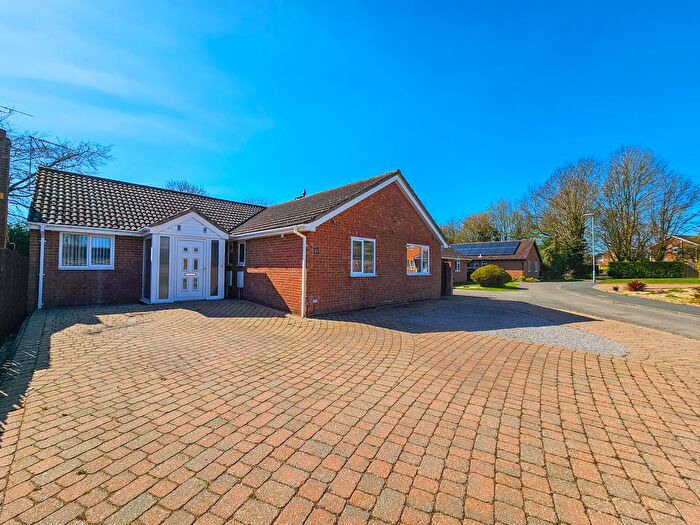
Houses for sale & to rent in Hardwick, Cambridge
House Prices in Hardwick
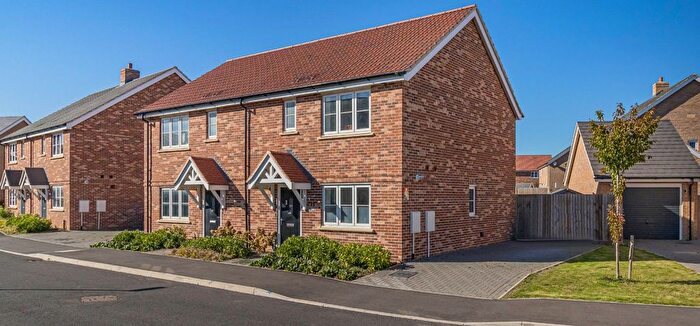
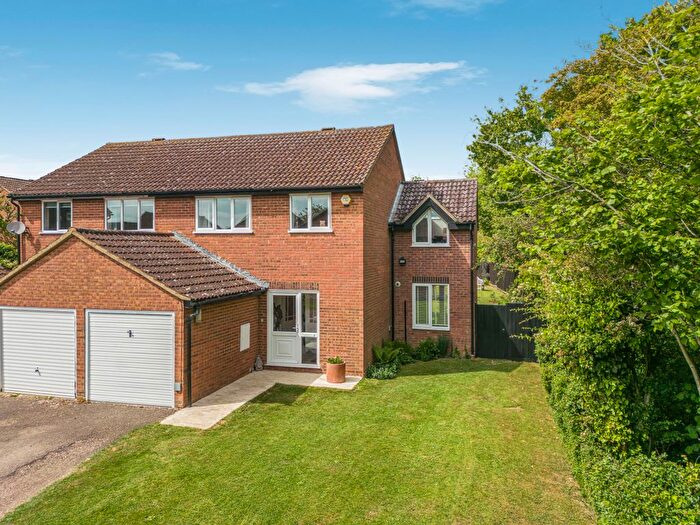
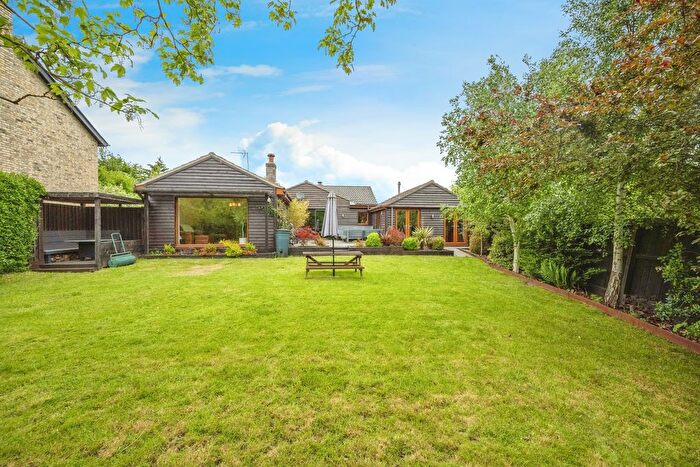
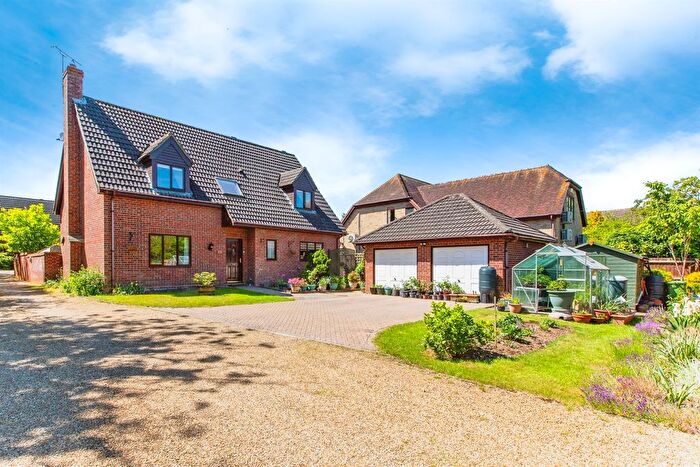
Properties in Hardwick have an average house price of £418,664.00 and had 75 Property Transactions within the last 3 years¹.
Hardwick is an area in Cambridge, Cambridgeshire with 1,028 households², where the most expensive property was sold for £1,450,000.00.
Properties for sale in Hardwick
Previously listed properties in Hardwick
Roads and Postcodes in Hardwick
Navigate through our locations to find the location of your next house in Hardwick, Cambridge for sale or to rent.
| Streets | Postcodes |
|---|---|
| Apple Tree Close | CB23 7WG |
| Ashmead Drive | CB23 7XT |
| Barker Way | CB23 7FS |
| Bhachu Drive | CB23 7FT |
| Blenheim Way | CB23 7XF |
| Bramley Way | CB23 7XD CB23 7XE |
| Burdeley's Way | CB23 7BY |
| Cambridge Road | CB23 7QG CB23 7QQ |
| Church Road | CB23 2RF |
| Coles Way | CB23 7FU |
| Egremont Road | CB23 7XR |
| Ellison Lane | CB23 7QA CB23 7XH |
| Farmers End | CB23 2SB |
| Grace Crescent | CB23 7AH |
| Grenadier Walk | CB23 7XW |
| Hall Drive | CB23 7QN |
| Harris Close | CB23 7EX |
| Howells Way | CB23 7FP |
| Jacklin Close | CB23 7ET |
| Johnson Drive | CB23 7EU |
| Kesters Close | CB23 7QY |
| Kings Road | CB23 7QT |
| Lambourne Road | CB23 7XB |
| Lark Rise | CB23 7XZ |
| Laxton Avenue | CB23 7XL |
| Limes Road | CB23 7QR CB23 7XN CB23 7XU CB23 7XX CB23 7RE |
| Main Street | CB23 7QS CB23 7QU |
| Manor Crescent | CB23 7QE |
| Martins Way | CB23 7ER |
| Meridian Close | CB23 7AN |
| Merton Walk | CB23 7XP |
| Millers Way | CB23 7QP |
| Morris Close | CB23 7FD |
| Pershore Road | CB23 7XQ |
| Pippin Walk | CB23 7QD |
| Portway Road | CB23 7QF |
| Pump Lane | CB23 7QW |
| Quince Road | CB23 7XJ |
| Russet Walk | CB23 7QB |
| Sadlers Close | CB23 7YE |
| St Neots Road | CB23 7QH CB23 7QJ CB23 7QL |
| Sudeley Grove | CB23 7XS |
| The Pastures | CB23 7XA |
| Toft Road | CB23 7QX |
| Webb Close | CB23 7EW |
| West Street | CB23 7DU CB23 7EN |
| Worcester Avenue | CB23 7XG |
| CB23 7FA |
Transport near Hardwick
-
Cambridge Station
-
Cambridge North Station
-
Foxton Station
-
Shepreth Station
-
Shelford Station
-
Meldreth Station
-
Waterbeach Station
- FAQ
- Price Paid By Year
- Property Type Price
Frequently asked questions about Hardwick
What is the average price for a property for sale in Hardwick?
The average price for a property for sale in Hardwick is £418,664. This amount is 19% lower than the average price in Cambridge. There are 258 property listings for sale in Hardwick.
What streets have the most expensive properties for sale in Hardwick?
The streets with the most expensive properties for sale in Hardwick are Sudeley Grove at an average of £588,333, Russet Walk at an average of £567,500 and St Neots Road at an average of £542,121.
What streets have the most affordable properties for sale in Hardwick?
The streets with the most affordable properties for sale in Hardwick are The Pastures at an average of £180,000, Millers Way at an average of £203,333 and Meridian Close at an average of £257,750.
Which train stations are available in or near Hardwick?
Some of the train stations available in or near Hardwick are Cambridge, Cambridge North and Foxton.
Property Price Paid in Hardwick by Year
The average sold property price by year was:
| Year | Average Sold Price | Price Change |
Sold Properties
|
|---|---|---|---|
| 2025 | £442,326 | 16% |
24 Properties |
| 2024 | £371,540 | -19% |
25 Properties |
| 2023 | £442,134 | -2% |
26 Properties |
| 2022 | £452,167 | 1% |
38 Properties |
| 2021 | £447,696 | 14% |
58 Properties |
| 2020 | £386,700 | -7% |
43 Properties |
| 2019 | £412,815 | 10% |
42 Properties |
| 2018 | £372,016 | 15% |
31 Properties |
| 2017 | £316,930 | -1% |
25 Properties |
| 2016 | £319,469 | 1% |
37 Properties |
| 2015 | £315,207 | 10% |
24 Properties |
| 2014 | £284,306 | 0,2% |
39 Properties |
| 2013 | £283,775 | 8% |
31 Properties |
| 2012 | £262,374 | 15% |
32 Properties |
| 2011 | £222,509 | -5% |
36 Properties |
| 2010 | £233,946 | -4% |
29 Properties |
| 2009 | £243,723 | 5% |
43 Properties |
| 2008 | £230,451 | -12% |
31 Properties |
| 2007 | £258,870 | 12% |
55 Properties |
| 2006 | £227,279 | 12% |
75 Properties |
| 2005 | £199,095 | 7% |
43 Properties |
| 2004 | £185,150 | 7% |
43 Properties |
| 2003 | £171,429 | 10% |
40 Properties |
| 2002 | £154,685 | 22% |
44 Properties |
| 2001 | £121,094 | -1% |
52 Properties |
| 2000 | £122,327 | 19% |
38 Properties |
| 1999 | £99,127 | 7% |
55 Properties |
| 1998 | £92,433 | 18% |
59 Properties |
| 1997 | £76,095 | -24% |
65 Properties |
| 1996 | £94,412 | 15% |
58 Properties |
| 1995 | £80,088 | - |
44 Properties |
Property Price per Property Type in Hardwick
Here you can find historic sold price data in order to help with your property search.
The average Property Paid Price for specific property types in the last three years are:
| Property Type | Average Sold Price | Sold Properties |
|---|---|---|
| Semi Detached House | £364,293.00 | 29 Semi Detached Houses |
| Detached House | £570,804.00 | 27 Detached Houses |
| Terraced House | £285,452.00 | 19 Terraced Houses |

