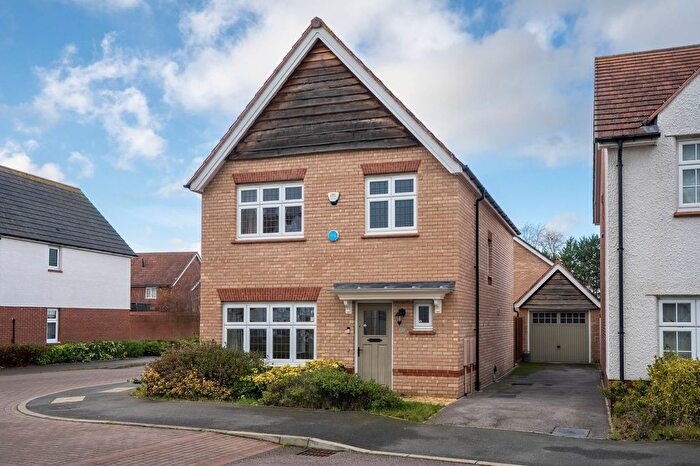
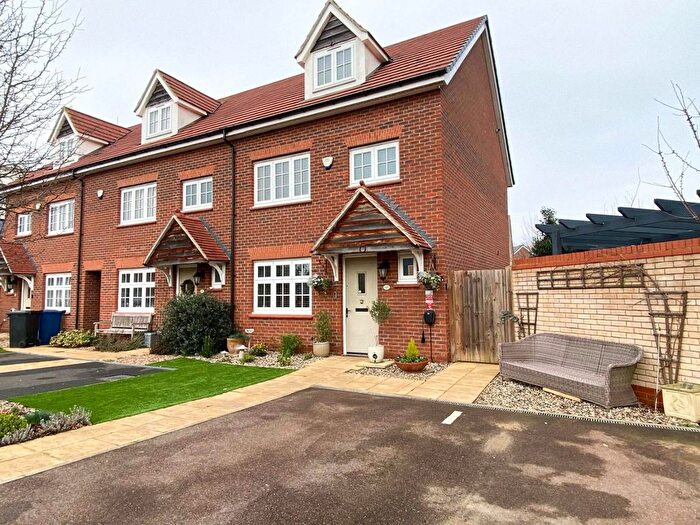
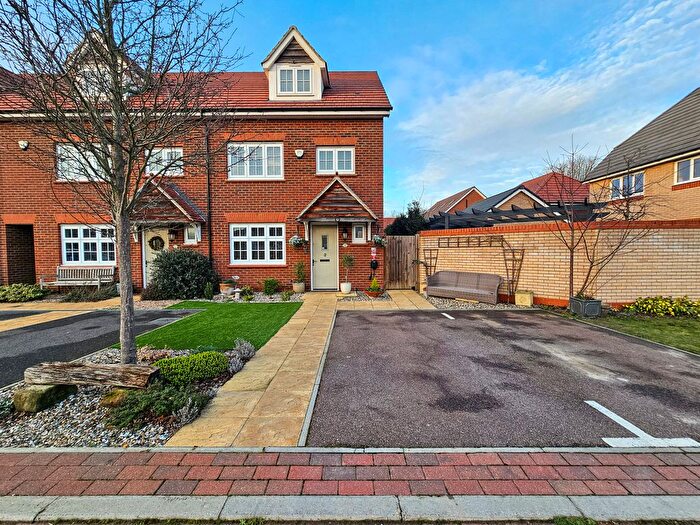
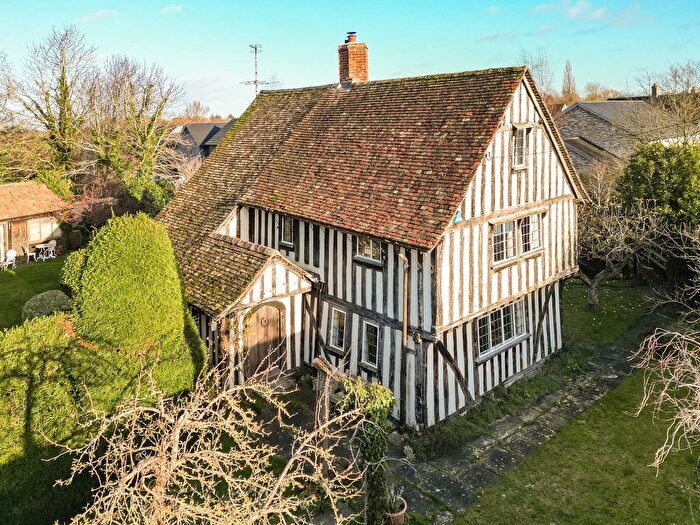
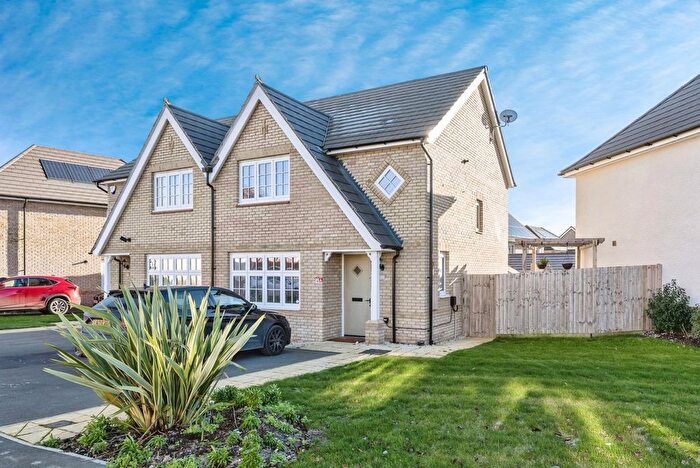
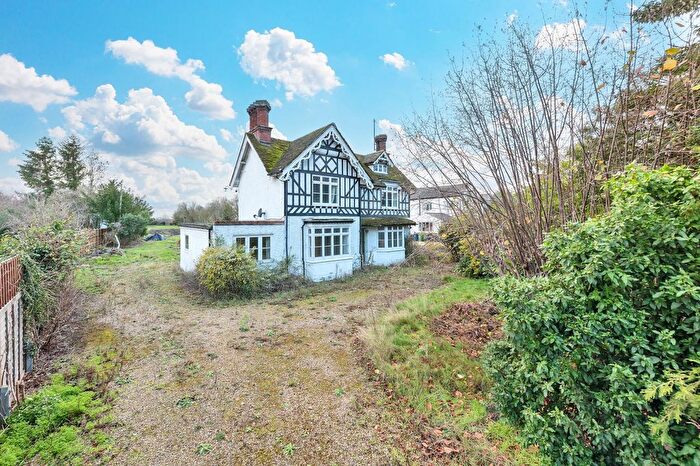
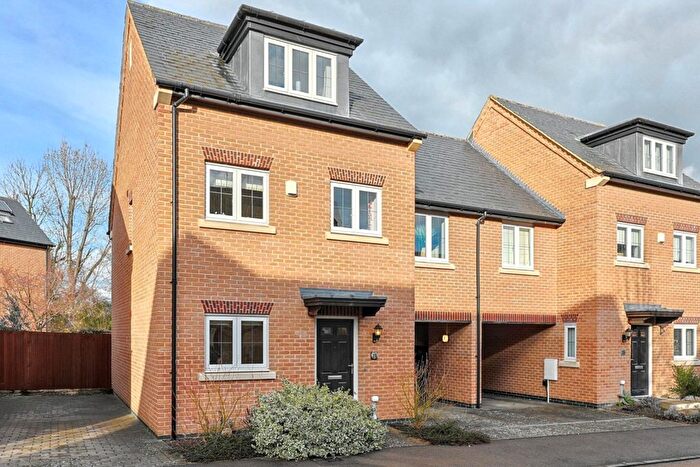
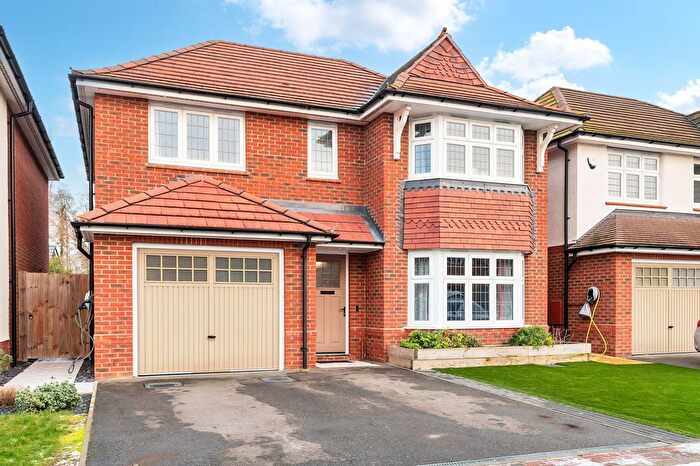
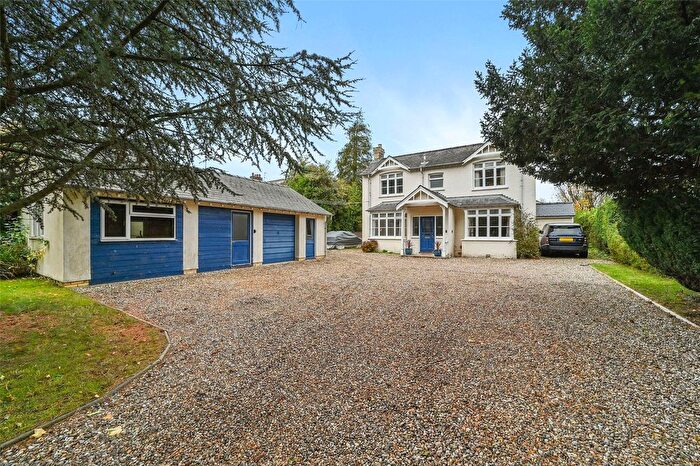
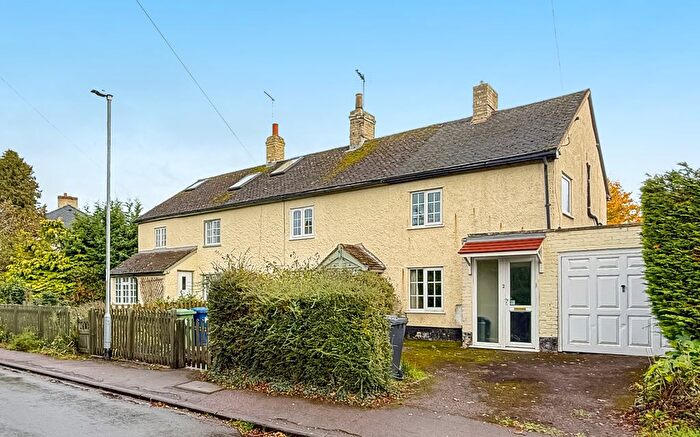
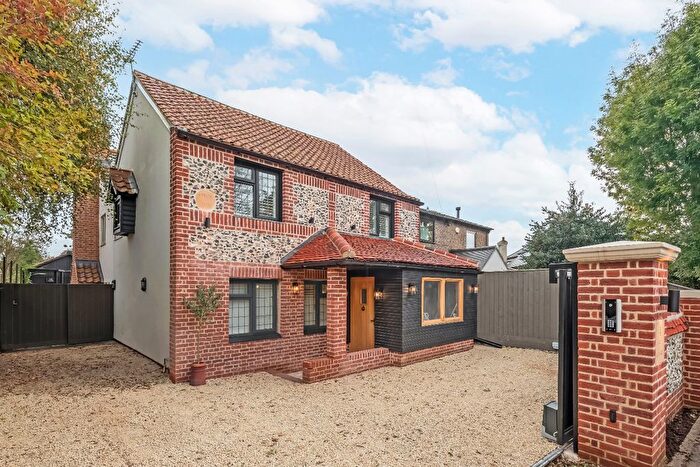
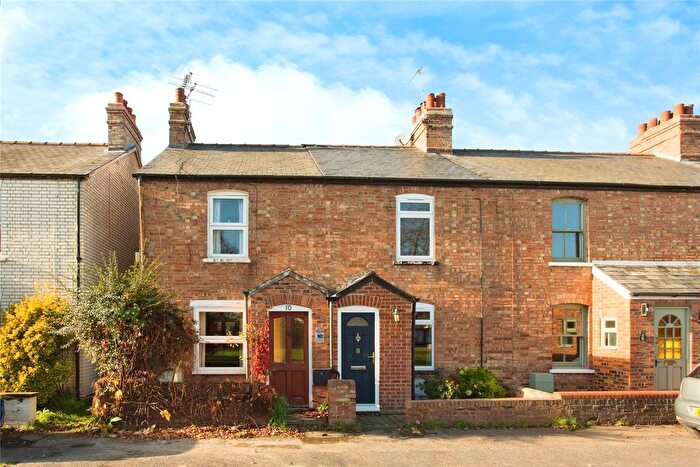
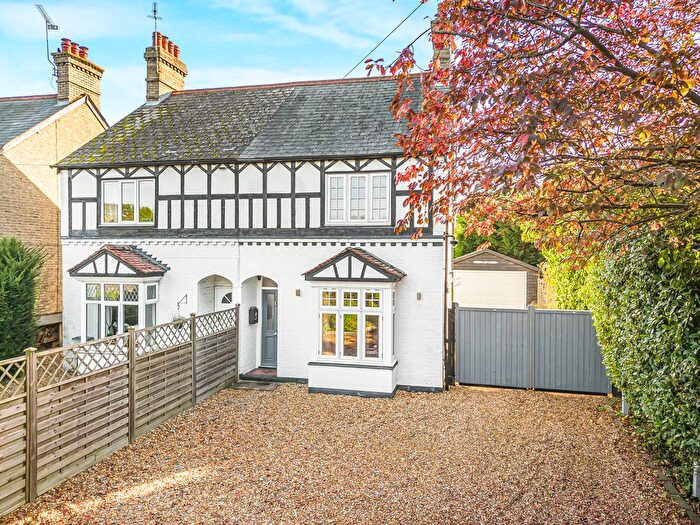
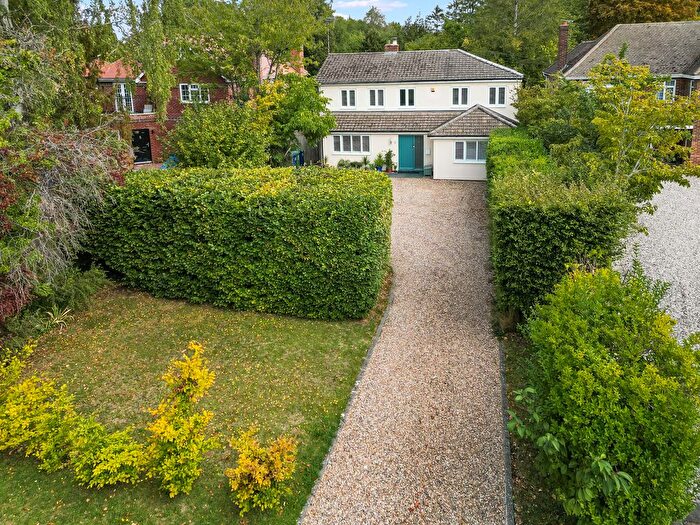
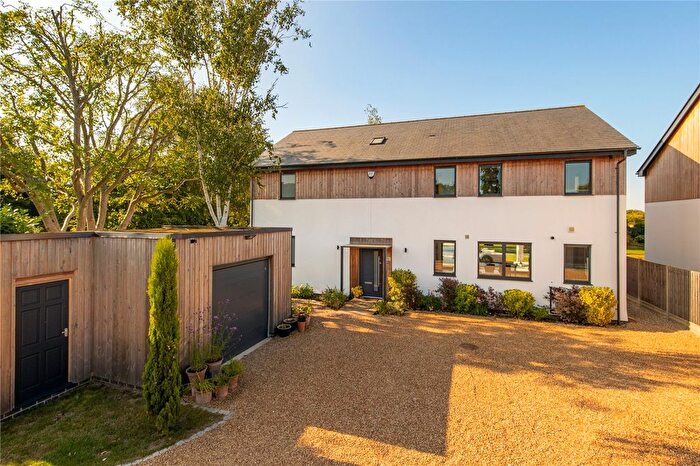
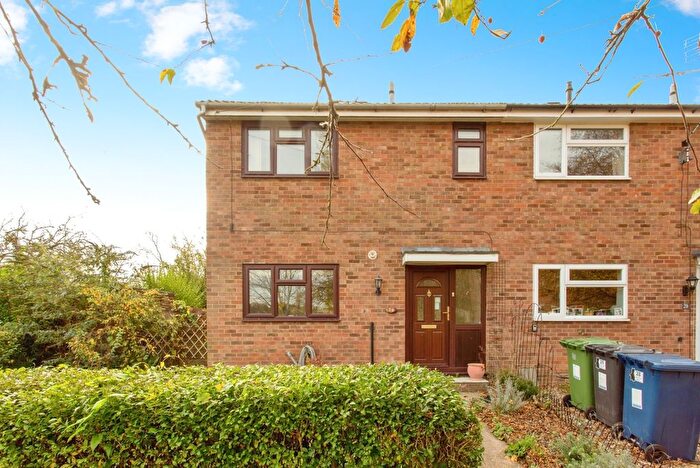
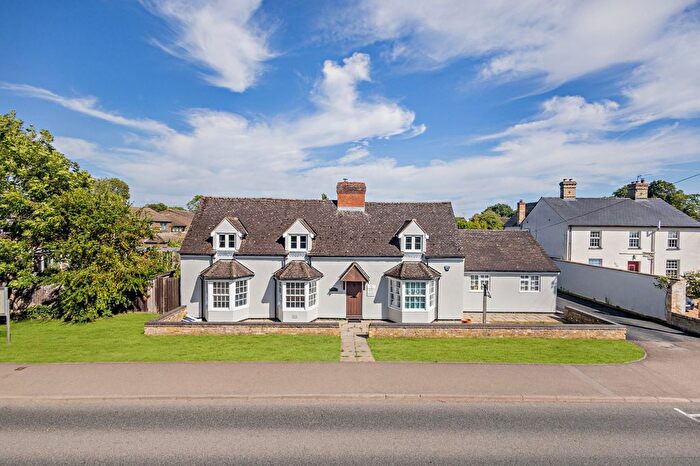
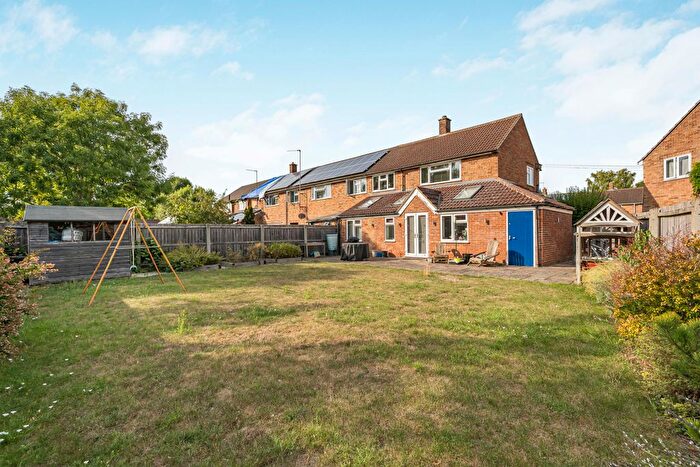
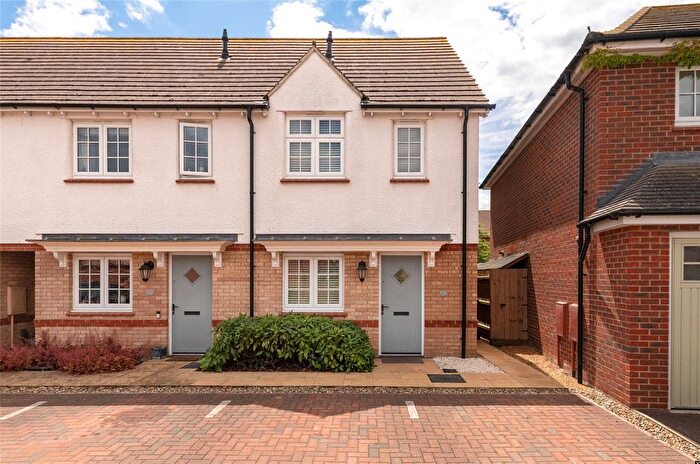
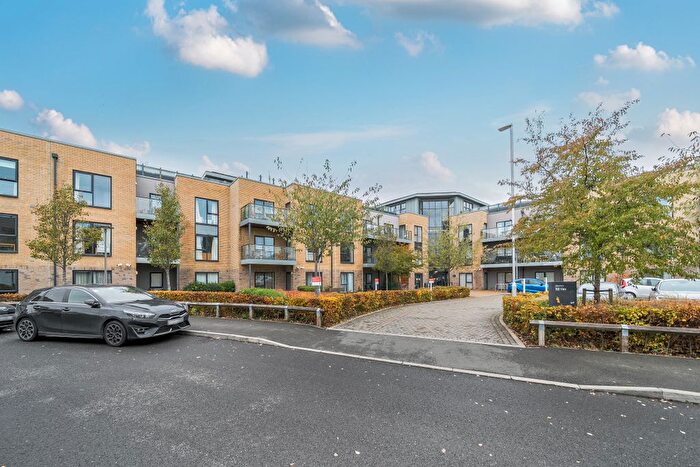
Houses for sale & to rent in Harston And Hauxton, Cambridge
House Prices in Harston And Hauxton
Properties in Harston And Hauxton have an average house price of £642,505.00 and had 68 Property Transactions within the last 3 years¹.
Harston And Hauxton is an area in Cambridge, Cambridgeshire with 976 households², where the most expensive property was sold for £2,600,000.00.
Properties for sale in Harston And Hauxton
Previously listed properties in Harston And Hauxton
Roads and Postcodes in Harston And Hauxton
Navigate through our locations to find the location of your next house in Harston And Hauxton, Cambridge for sale or to rent.
| Streets | Postcodes |
|---|---|
| Ash View | CB22 5TE |
| Button End | CB22 7GY CB22 7NX |
| Cambridge Road | CB22 5HT |
| Chapel Lane | CB22 7NG |
| Church Road | CB22 5HS |
| Church Street | CB22 7NP CB22 7NR |
| Field View | CB22 7QU |
| Green Man Lane | CB22 7PY |
| Haslingfield Road | CB22 7NT |
| Hawthorn Avenue | CB22 5JA |
| High Meadow | CB22 7TR |
| High Street | CB22 5HW CB22 7PX CB22 7PZ CB22 7QB CB22 7QD |
| Hurrells Row | CB22 7NW |
| Jackson Close | CB22 5JD |
| Jopling Way | CB22 5HY |
| Lawrance Lea | CB22 7QR |
| Leys Walk | CB22 5HZ |
| London Road | CB22 7QH CB22 7QJ CB22 7QQ |
| Manor Close | CB22 7QF |
| Meadow Way | CB22 7NQ |
| Mill Road | CB22 7NF |
| Moorfield | CB22 7TP |
| New Road | CB22 7AB CB22 7QG |
| Orchard Close | CB22 7PT |
| Pightle Close | CB22 7NN |
| Queens Close | CB22 7QL CB22 7QN CB22 7QW |
| Riddy Close | CB22 5TD |
| Royston Road | CB22 7NH CB22 7NJ CB22 7PU |
| Sheepshead Lane | CB22 7QA |
| Station Road | CB22 7NY CB22 7PP |
| The Chestnuts | CB22 7QS |
| The Footpath | CB22 7NS |
| The Lane | CB22 5HP |
| The Limes | CB22 7QT |
| The Paddock | CB22 7PR |
| Willow Way | CB22 5JB |
Transport near Harston And Hauxton
-
Foxton Station
-
Shelford Station
-
Shepreth Station
-
Cambridge Station
-
Whittlesford Station
-
Meldreth Station
- FAQ
- Price Paid By Year
- Property Type Price
Frequently asked questions about Harston And Hauxton
What is the average price for a property for sale in Harston And Hauxton?
The average price for a property for sale in Harston And Hauxton is £642,505. This amount is 25% higher than the average price in Cambridge. There are 191 property listings for sale in Harston And Hauxton.
What streets have the most expensive properties for sale in Harston And Hauxton?
The streets with the most expensive properties for sale in Harston And Hauxton are Cambridge Road at an average of £1,710,000, London Road at an average of £1,397,000 and High Meadow at an average of £1,230,000.
What streets have the most affordable properties for sale in Harston And Hauxton?
The streets with the most affordable properties for sale in Harston And Hauxton are Riddy Close at an average of £339,762, Manor Close at an average of £350,000 and Jopling Way at an average of £371,875.
Which train stations are available in or near Harston And Hauxton?
Some of the train stations available in or near Harston And Hauxton are Foxton, Shelford and Shepreth.
Property Price Paid in Harston And Hauxton by Year
The average sold property price by year was:
| Year | Average Sold Price | Price Change |
Sold Properties
|
|---|---|---|---|
| 2025 | £539,312 | -7% |
16 Properties |
| 2024 | £579,530 | -35% |
28 Properties |
| 2023 | £784,770 | 15% |
24 Properties |
| 2022 | £669,622 | 7% |
32 Properties |
| 2021 | £622,111 | 13% |
51 Properties |
| 2020 | £541,009 | 1% |
33 Properties |
| 2019 | £534,773 | 5% |
32 Properties |
| 2018 | £510,291 | -13% |
34 Properties |
| 2017 | £577,941 | -8% |
34 Properties |
| 2016 | £624,861 | 29% |
49 Properties |
| 2015 | £444,893 | -13% |
33 Properties |
| 2014 | £502,972 | 8% |
42 Properties |
| 2013 | £460,945 | 21% |
37 Properties |
| 2012 | £366,144 | 17% |
25 Properties |
| 2011 | £305,011 | -31% |
39 Properties |
| 2010 | £401,038 | 2% |
38 Properties |
| 2009 | £392,266 | 27% |
42 Properties |
| 2008 | £287,297 | -8% |
24 Properties |
| 2007 | £311,139 | -8% |
51 Properties |
| 2006 | £336,395 | 18% |
51 Properties |
| 2005 | £275,587 | -15% |
33 Properties |
| 2004 | £318,017 | 28% |
50 Properties |
| 2003 | £230,431 | -13% |
45 Properties |
| 2002 | £260,145 | 28% |
55 Properties |
| 2001 | £187,188 | -5% |
38 Properties |
| 2000 | £196,317 | 11% |
44 Properties |
| 1999 | £174,525 | 26% |
65 Properties |
| 1998 | £129,228 | 3% |
44 Properties |
| 1997 | £125,442 | 19% |
45 Properties |
| 1996 | £101,410 | 10% |
49 Properties |
| 1995 | £91,041 | - |
31 Properties |
Property Price per Property Type in Harston And Hauxton
Here you can find historic sold price data in order to help with your property search.
The average Property Paid Price for specific property types in the last three years are:
| Property Type | Average Sold Price | Sold Properties |
|---|---|---|
| Semi Detached House | £420,785.00 | 21 Semi Detached Houses |
| Detached House | £848,144.00 | 38 Detached Houses |
| Terraced House | £335,264.00 | 7 Terraced Houses |
| Flat | £138,750.00 | 2 Flats |

