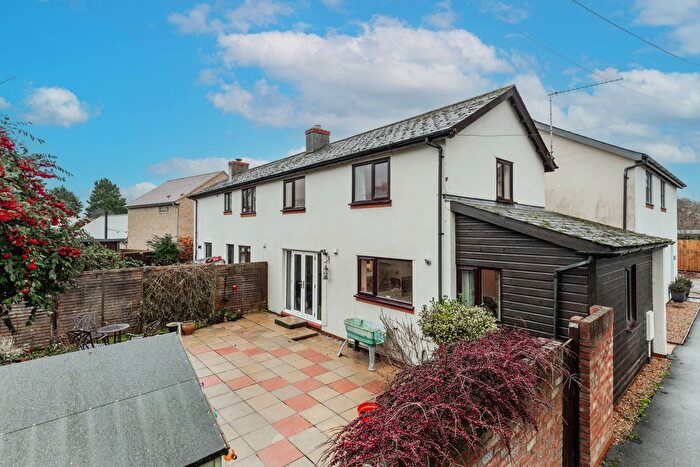
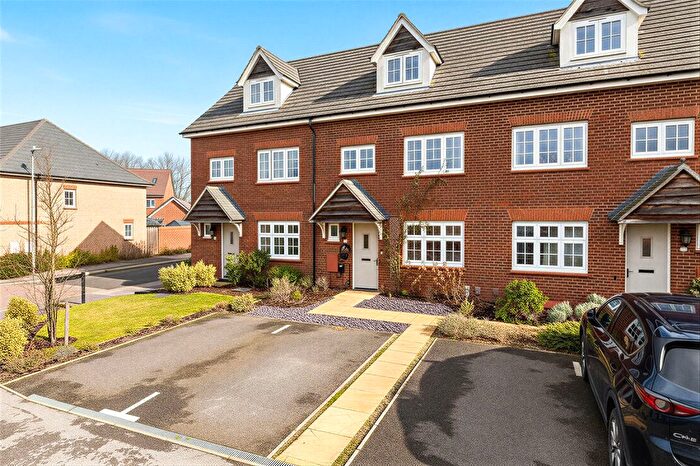
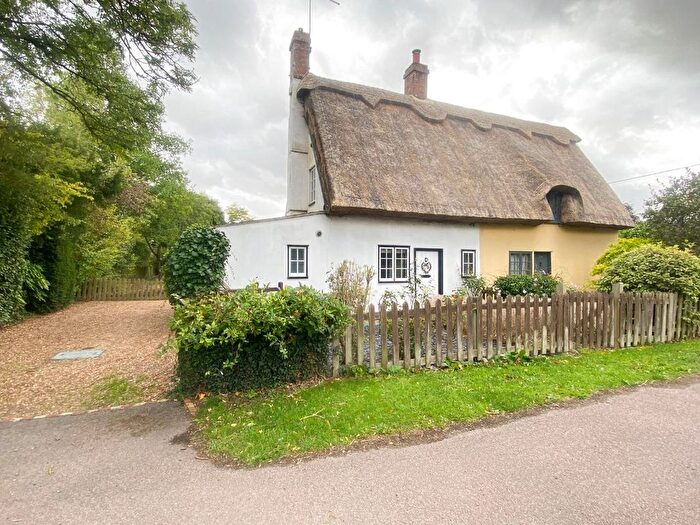
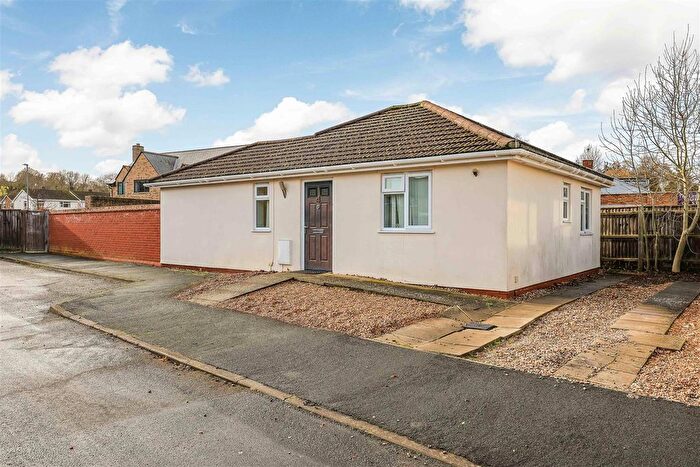
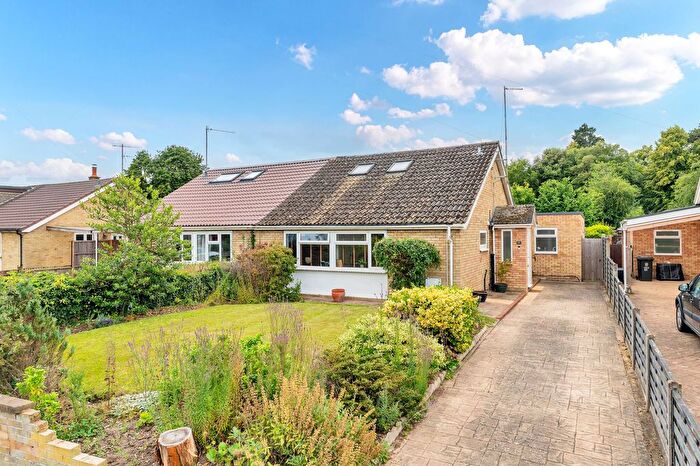
Houses for sale & to rent in Haslingfield And The Eversdens, Cambridge
House Prices in Haslingfield And The Eversdens
Properties in Haslingfield And The Eversdens have an average house price of £612,210.00 and had 95 Property Transactions within the last 3 years¹.
Haslingfield And The Eversdens is an area in Cambridge, Cambridgeshire with 1,051 households², where the most expensive property was sold for £1,850,000.00.
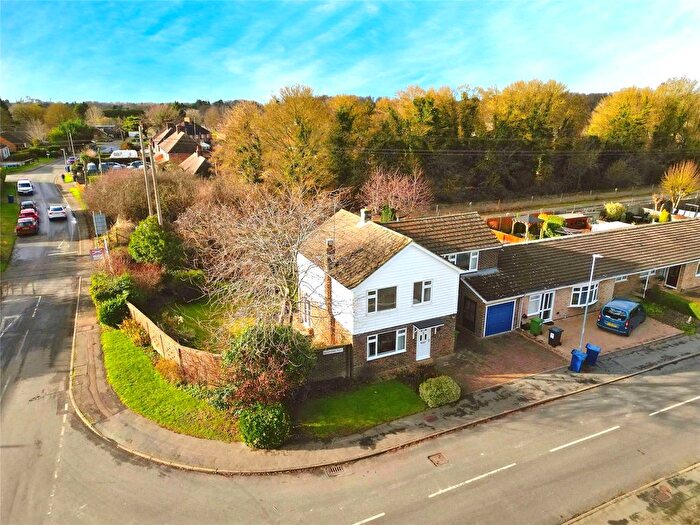
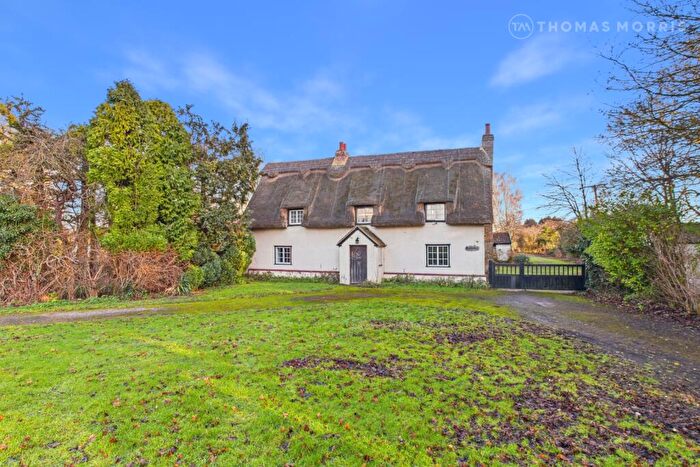
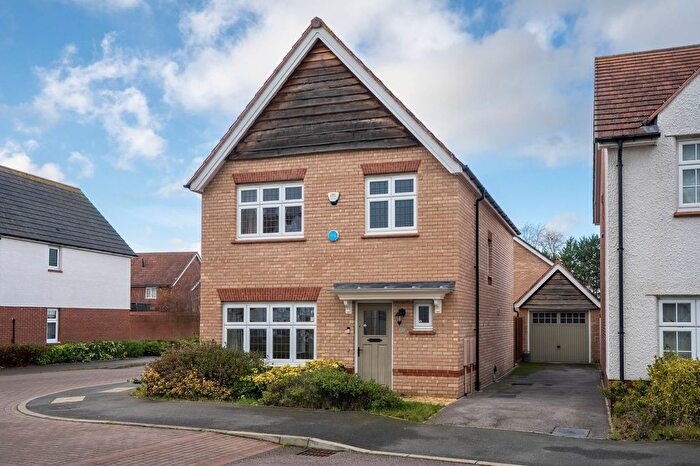
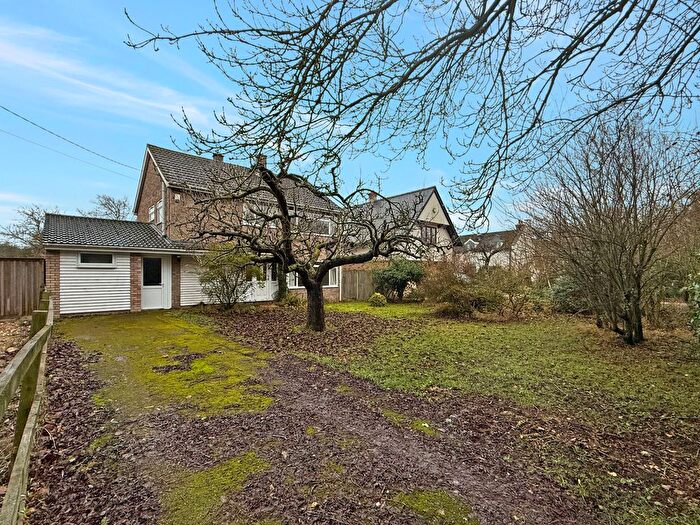
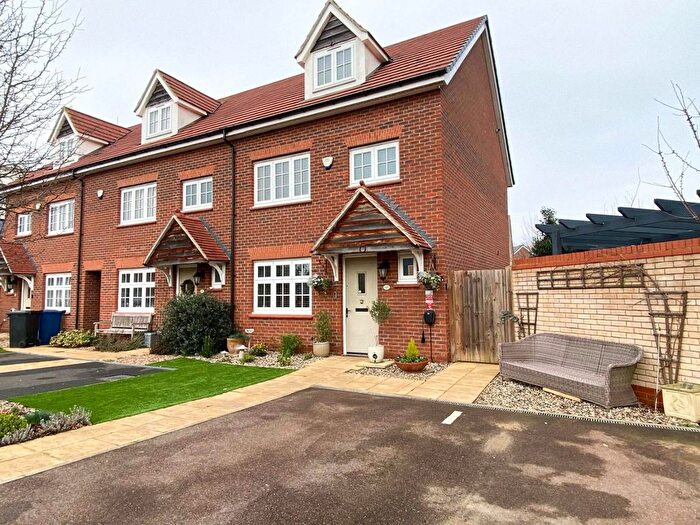
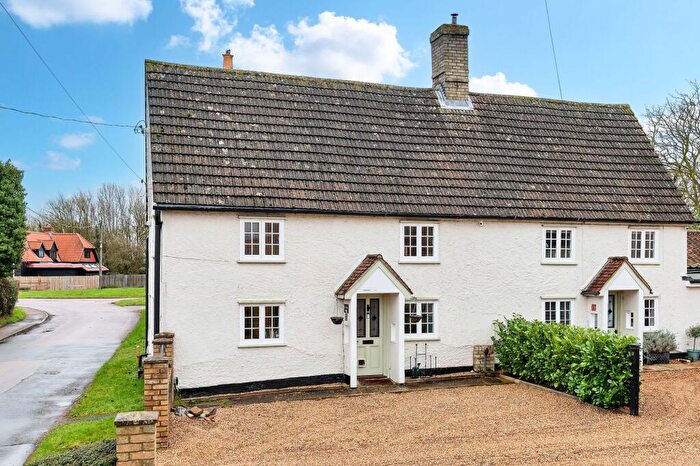
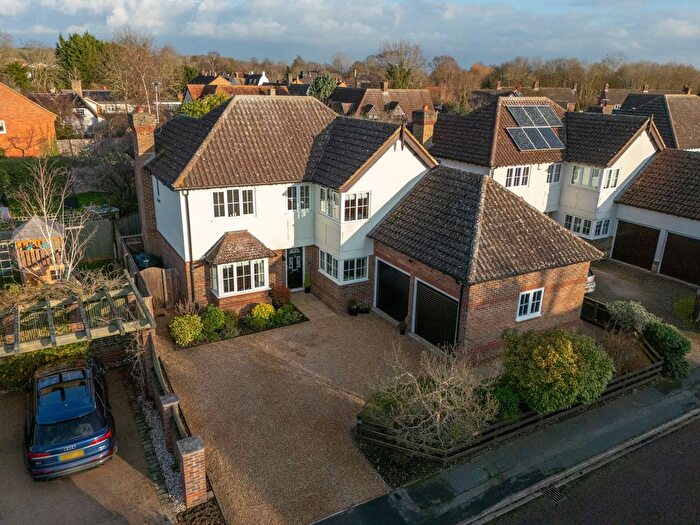
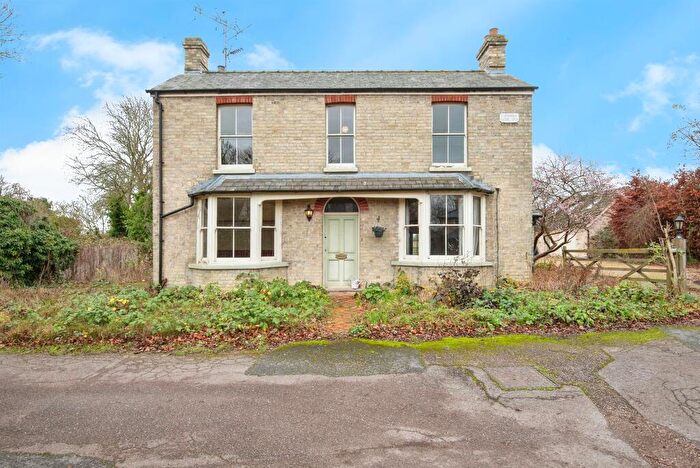
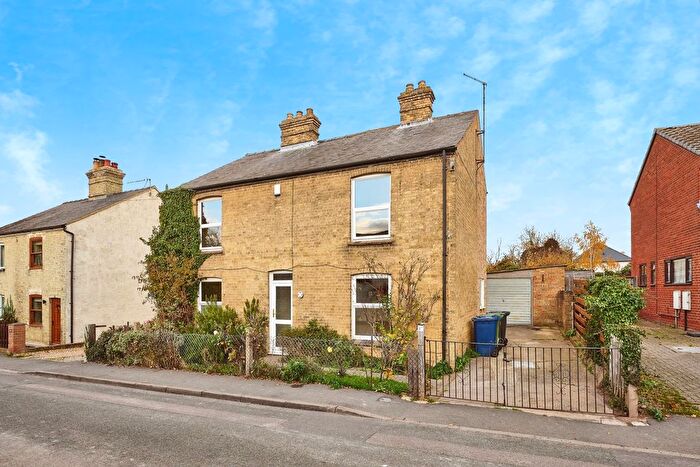
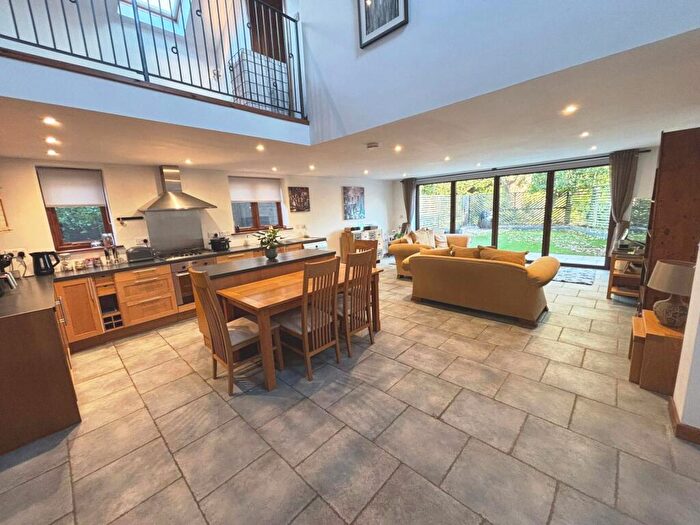
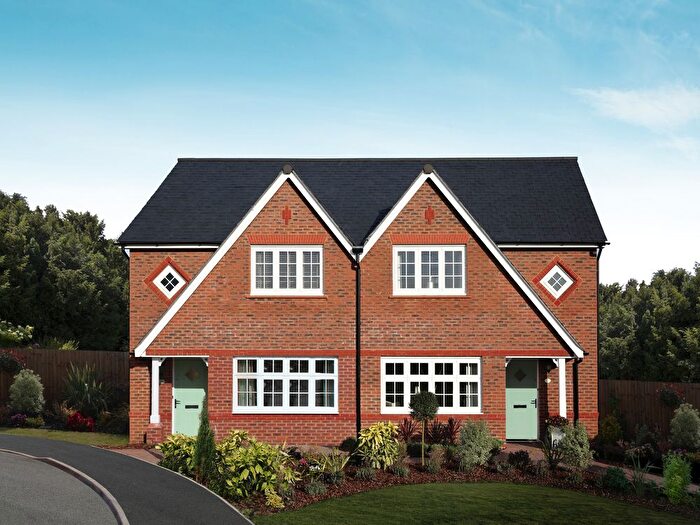
Properties for sale in Haslingfield And The Eversdens
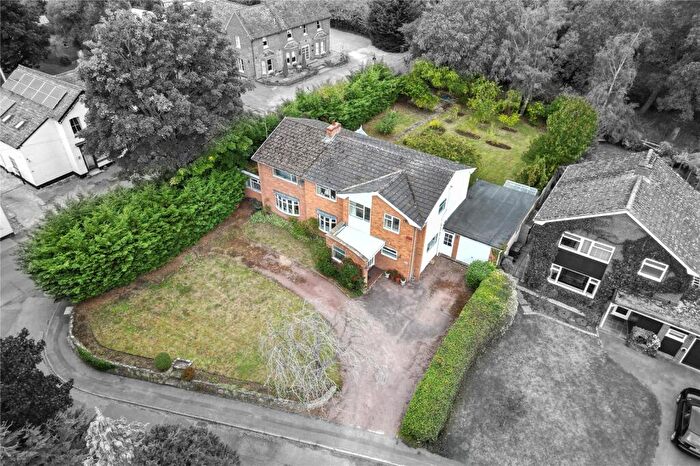
Previously listed properties in Haslingfield And The Eversdens
Roads and Postcodes in Haslingfield And The Eversdens
Navigate through our locations to find the location of your next house in Haslingfield And The Eversdens, Cambridge for sale or to rent.
| Streets | Postcodes |
|---|---|
| Back Lane | CB23 1JN |
| Badcock Road | CB23 1LF |
| Barton Road | CB23 1LL |
| Boltons Way | CB23 1EZ |
| Broad Lane | CB23 1JF |
| Bucks Lane | CB23 1HL |
| Butler Way | CB23 1JG |
| Cantelupe Road | CB23 1LU |
| Chapel Hill | CB23 1JJ |
| Chapel Road | CB23 1HP |
| Chestnut Close | CB23 1JU |
| Church Lane | CB23 1HQ |
| Church Street | CB23 1HU CB23 1JE |
| Church Way | CB23 1JR |
| Coach Drive | CB23 1EN |
| College Crescent | CB23 1LZ |
| Comberton Road | CB23 1EU |
| Dodds Mead | CB23 1LD |
| Eversden Road | CB23 1ET |
| Finchs Field | CB23 1HG |
| Fountain Lane | CB23 1LT |
| Harlton Road | CB23 1AD CB23 1HB CB23 1HD |
| Harston Road | CB23 1JX |
| Haslingfield Road | CB23 1ER |
| High Street | CB23 1ES CB23 1HE CB23 1HN CB23 1HW CB23 1JP CB23 1JW |
| Ivetts Close | CB23 1YL |
| Kestrel Rise | CB2 9BP |
| Kingston Road | CB23 1HT |
| Knapp Rise | CB23 1LQ |
| Leetes Lane | CB23 1HH |
| Lilac Close | CB23 1JS |
| Lilac End | CB23 1LG |
| Low Close | CB23 1AA |
| Lowfields | CB23 1HJ |
| Moss Drive | CB23 1JB |
| New Road | CB23 1LP CB23 1LR |
| Orchard Road | CB23 1JT |
| Pates Close | CB23 1LH |
| Quarry Lane | CB23 1LB |
| River Lane | CB23 1LX |
| School Lane | CB23 1JL |
| Scotts Yard | CB23 1NB |
| Sidney Gardens | CB23 1NA |
| Stearnes Yard | CB23 1JA |
| The Elms | CB23 1ND |
| The Hemlocks | CB23 1LE |
| The Knapp | CB23 1JH |
| The Meadows | CB23 1JD |
| Trinity Close | CB23 1LS |
| Watsons Yard | CB23 1AB |
| Wells Close | CB23 1JQ |
| Wheelers Way | CB23 1HF |
| Wimpole Road | CB23 1HR |
| Wisbeys Yard | CB23 1NF |
Transport near Haslingfield And The Eversdens
- FAQ
- Price Paid By Year
- Property Type Price
Frequently asked questions about Haslingfield And The Eversdens
What is the average price for a property for sale in Haslingfield And The Eversdens?
The average price for a property for sale in Haslingfield And The Eversdens is £612,210. This amount is 19% higher than the average price in Cambridge. There are 775 property listings for sale in Haslingfield And The Eversdens.
What streets have the most expensive properties for sale in Haslingfield And The Eversdens?
The streets with the most expensive properties for sale in Haslingfield And The Eversdens are Church Street at an average of £999,166, Haslingfield Road at an average of £921,500 and High Street at an average of £879,232.
What streets have the most affordable properties for sale in Haslingfield And The Eversdens?
The streets with the most affordable properties for sale in Haslingfield And The Eversdens are Low Close at an average of £176,000, Fountain Lane at an average of £322,500 and School Lane at an average of £347,666.
Which train stations are available in or near Haslingfield And The Eversdens?
Some of the train stations available in or near Haslingfield And The Eversdens are Foxton, Shepreth and Shelford.
Property Price Paid in Haslingfield And The Eversdens by Year
The average sold property price by year was:
| Year | Average Sold Price | Price Change |
Sold Properties
|
|---|---|---|---|
| 2025 | £629,774 | 19% |
31 Properties |
| 2024 | £512,991 | -34% |
31 Properties |
| 2023 | £688,916 | 11% |
33 Properties |
| 2022 | £616,429 | 2% |
36 Properties |
| 2021 | £603,479 | 16% |
50 Properties |
| 2020 | £506,945 | -2% |
34 Properties |
| 2019 | £515,422 | 7% |
36 Properties |
| 2018 | £477,901 | -11% |
38 Properties |
| 2017 | £528,211 | 10% |
36 Properties |
| 2016 | £474,122 | -9% |
23 Properties |
| 2015 | £517,878 | 24% |
33 Properties |
| 2014 | £391,624 | -4% |
49 Properties |
| 2013 | £405,636 | 5% |
41 Properties |
| 2012 | £383,848 | 0,4% |
33 Properties |
| 2011 | £382,234 | -0,4% |
32 Properties |
| 2010 | £383,794 | 1% |
38 Properties |
| 2009 | £381,703 | -12% |
27 Properties |
| 2008 | £427,862 | 9% |
29 Properties |
| 2007 | £390,275 | 23% |
37 Properties |
| 2006 | £301,603 | -9% |
47 Properties |
| 2005 | £329,541 | 14% |
36 Properties |
| 2004 | £284,752 | 11% |
41 Properties |
| 2003 | £252,297 | -1% |
26 Properties |
| 2002 | £254,668 | 24% |
48 Properties |
| 2001 | £193,573 | 0,3% |
59 Properties |
| 2000 | £192,946 | 26% |
42 Properties |
| 1999 | £142,935 | 7% |
41 Properties |
| 1998 | £132,270 | 2% |
41 Properties |
| 1997 | £129,835 | 10% |
49 Properties |
| 1996 | £116,305 | -1% |
44 Properties |
| 1995 | £117,743 | - |
37 Properties |
Property Price per Property Type in Haslingfield And The Eversdens
Here you can find historic sold price data in order to help with your property search.
The average Property Paid Price for specific property types in the last three years are:
| Property Type | Average Sold Price | Sold Properties |
|---|---|---|
| Semi Detached House | £450,021.00 | 35 Semi Detached Houses |
| Detached House | £780,985.00 | 50 Detached Houses |
| Terraced House | £336,000.00 | 10 Terraced Houses |

