
Houses for sale in Ely South, Ely
House Prices in Ely South
Properties in Ely South have an average house price of £396k and had 200 Property Transactions within the last 3 years¹.
Ely South is an area in Ely, Cambridgeshire with 1,647 households², where the most expensive property was sold for £885k.
Properties for sale in Ely South

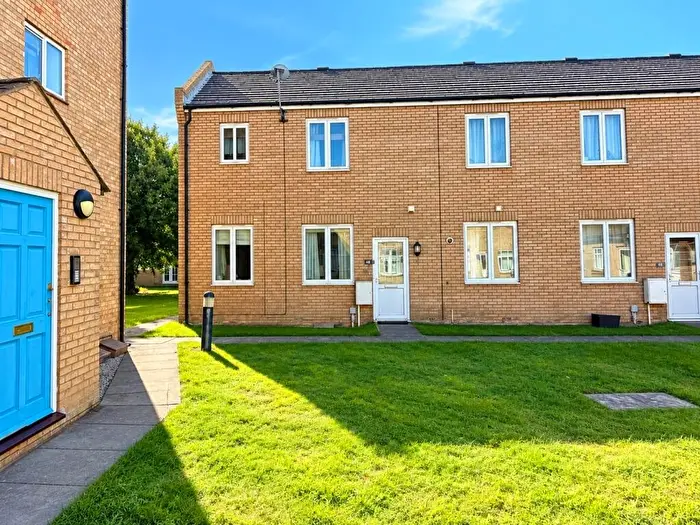

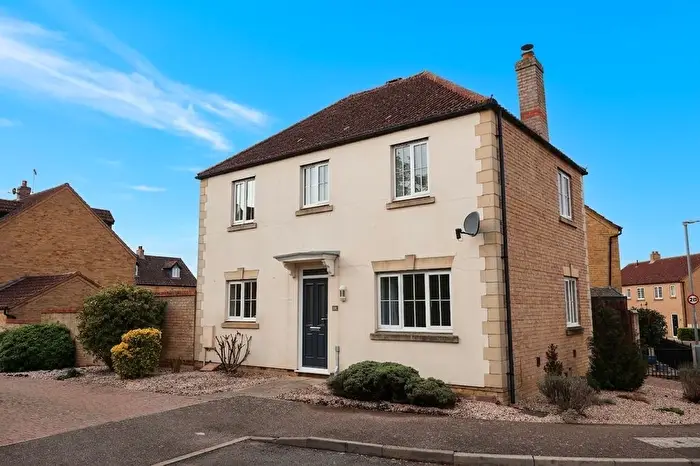
 2 Bedrooms
 1 Bathroom




If you are looking to sell your house, let it out, or receive a property valuation, an expert can help you.
Click the button below to get started.


Roads and Postcodes in Ely South
Navigate through our locations to find the location of your next house in Ely South, Ely for sale or to rent.
| Streets | Postcodes |
|---|---|
| Alexander Chase | CB6 3SN CB6 3SW |
| Bedford Close | CB6 3EL |
| Beresford Road | CB6 3SG CB6 3WA CB6 3WB CB6 3WD CB6 3WW |
| Briar Grove | CB6 3EU |
| Brooke Grove | CB6 3WS CB6 3WT CB6 3WU |
| Cambridge Road | CB7 4EQ CB7 4HL CB7 4HT CB7 4HU |
| Cambridgeshire Close | CB6 3BX |
| Canterbury Avenue | CB6 3DW |
| Churchill Close | CB6 3BT |
| Collier Close | CB6 3WQ CB6 3WX |
| Darwin Close | CB6 3WY |
| Debden Green | CB6 3BS |
| Ely Road | CB6 2HL |
| Elysian Close | CB7 4HY |
| Engine Yard | CB6 3BF |
| Gateway Gardens | CB6 3DE |
| Grace Gardens | CB6 3GG |
| Hamilton Road | CB6 3BN |
| Hereward Street | CB6 3BP |
| Hertford Close | CB6 3QS |
| Hervey Close | CB6 3DU |
| Hollendale Walk | CB6 3FJ |
| Houghton Gardens | CB7 4JN |
| Kingsley Walk | CB6 3BZ |
| Lansdowne Close | CB6 3BL |
| Leicester Close | CB6 3QR |
| Longfields | CB6 3DN |
| Marriott Drive | CB7 4WJ |
| Mawson Close | CB6 3DX |
| Meadow Way | CB6 3EX |
| Morley Drive | CB6 3FQ |
| Murfitt Close | CB6 3FN |
| Norfolk Road | CB6 3EJ |
| Northampton Close | CB6 3QT |
| Pasture Grove | CB6 3EY |
| Pilgrims Way | CB6 3DL |
| Samuels Way | CB7 4HA |
| St Johns Road | CB6 3BB CB6 3BE CB6 3BG CB6 3BW |
| Suffolk Close | CB6 3EW |
| Tennyson Place | CB6 3WE CB6 3WF |
| The Chase | CB6 3BH CB6 3BJ CB6 3DR CB6 3DS |
| The Glaives | CB6 3FY |
| Tower Court | CB7 4XS |
| Tower Road | CB7 4HW |
| Warwick Drive | CB6 3EN |
| Witchford Road | CB6 3DP CB6 3NN |
| Yorke Way | CB6 3DT |
Property price trends in Ely South
According to the latest Land Registry data, the average home in Ely South sold for £432,733 in 2026. That figure comes from 3,161 sales logged over the past 31 years.
Prices have continued to climb over the last three years. Compared with 2023, when the typical sale came in around £385,877, that's a rise of roughly 12.1%.
Looking back five years, average prices are up about 26.7% since 2021, a gain of around £91,174 in cash terms.
Zoom out to the past decade for the fuller picture. Back in 2016, homes here averaged £315,659, so the typical sold price has climbed about 37.1% since then, roughly 3.2% a year. Stretch the view to fifteen years and that annual pace edges up closer to 5.2%.
Frequently asked questions about Ely South
What is the average price for a property for sale in Ely South?
The average price for a property for sale in Ely South is £396,061. This amount is 13% higher than the average price in Ely. There are 186 property listings for sale in Ely South.
What streets have the most expensive properties for sale in Ely South?
The streets with the most expensive properties for sale in Ely South are Houghton Gardens at an average of £780,000, Collier Close at an average of £528,571 and Alexander Chase at an average of £505,785.
What streets have the most affordable properties for sale in Ely South?
The streets with the most affordable properties for sale in Ely South are Pasture Grove at an average of £165,000, The Glaives at an average of £205,000 and Tower Court at an average of £221,785.
Which train stations are available in or near Ely South?
Some of the train stations available in or near Ely South are Ely, Littleport and Shippea Hill.
Property Price Paid in Ely South by Year
The average sold property price by year was:
| Year | Average Sold Price | Price Change |
Sold Properties

|
|---|---|---|---|
| 2026 | £432,733 | 
10% |
30 Properties |
| 2025 | £388,000 | 
-2% |
55 Properties |
| 2024 | £394,902 |
2% |
57 Properties |
| 2023 | £385,877 |
2% |
58 Properties |
| 2022 | £378,864 |
10% |
57 Properties |
| 2021 | £341,559 |
2% |
92 Properties |
| 2020 | £336,160 |
-14% |
61 Properties |
| 2019 | £382,977 |
15% |
71 Properties |
| 2018 | £327,041 |
-8% |
79 Properties |
| 2017 | £354,428 |
11% |
71 Properties |
Property Price per Property Type in Ely South
Here you can find historic sold price data in order to help with your property search.
The average Property Paid Price for specific property types in the last three years are:
| Property Type | Average Sold Price | Sold Properties |
|---|---|---|
| Detached House | £487,193.00 | 89 Detached Houses |
| Flat | £207,730.00 | 15 Flats |
| Semi Detached House | £366,400.00 | 47 Semi Detached Houses |
| Terraced House | £316,639.00 | 49 Terraced Houses |
