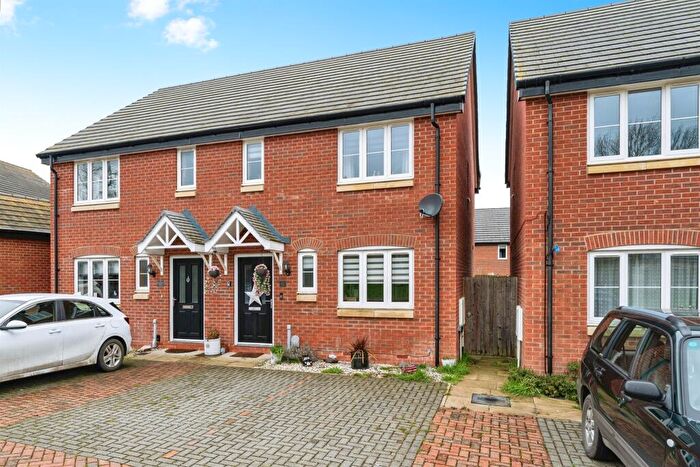
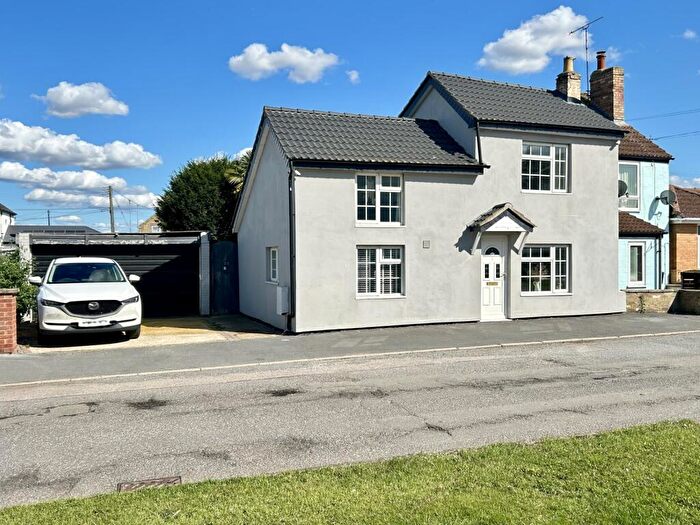
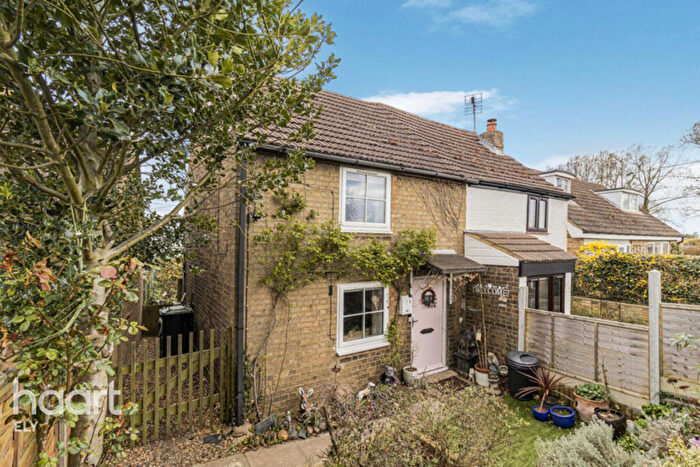
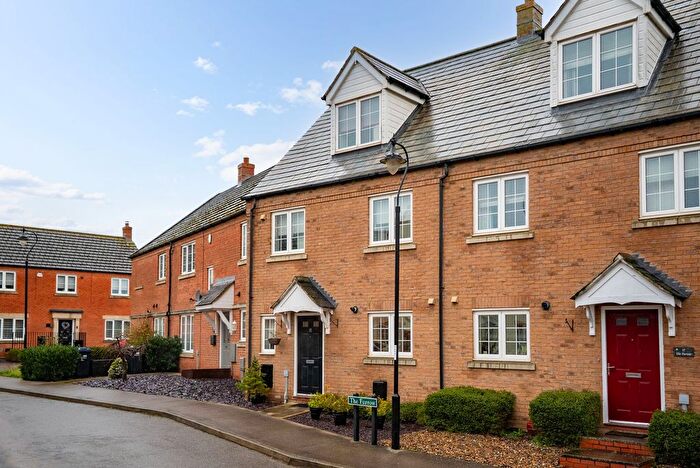
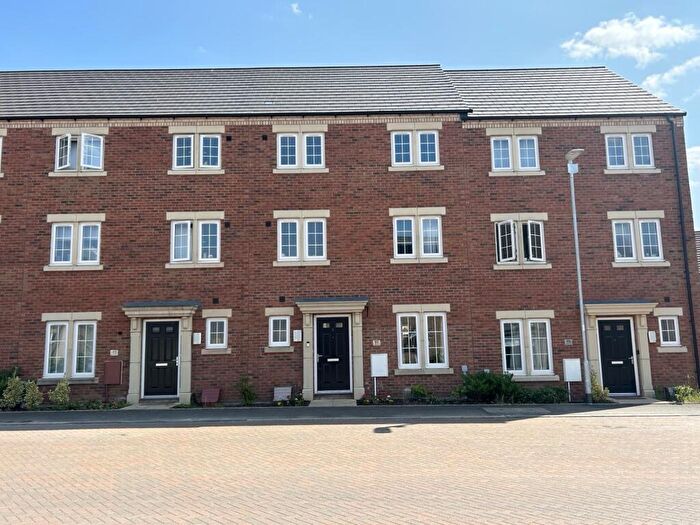
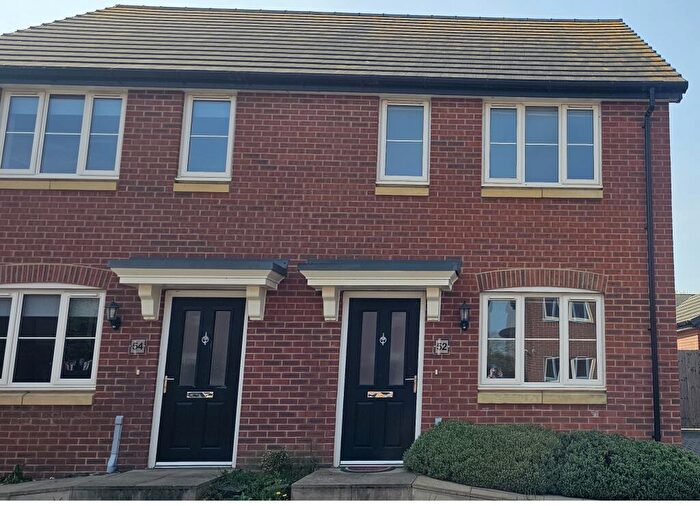
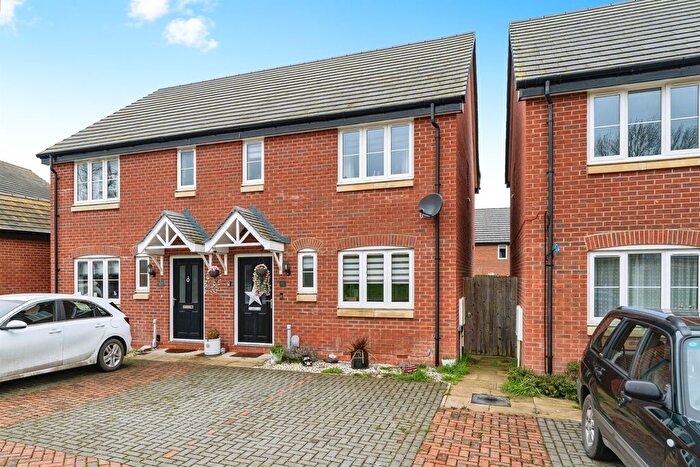
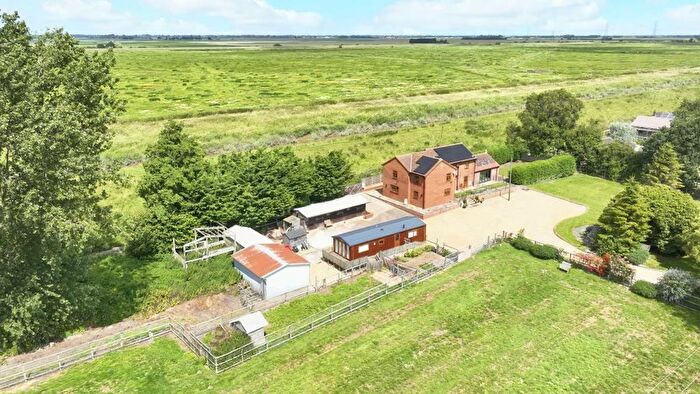
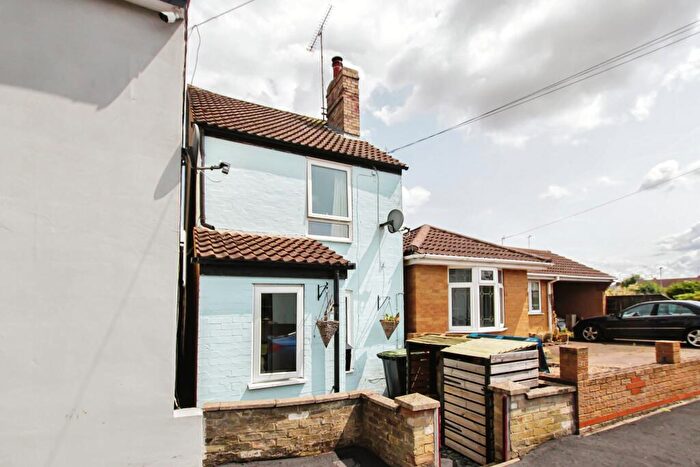
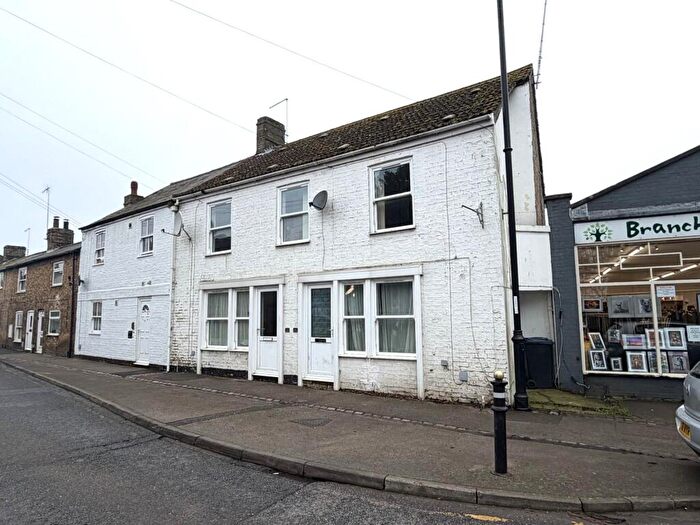
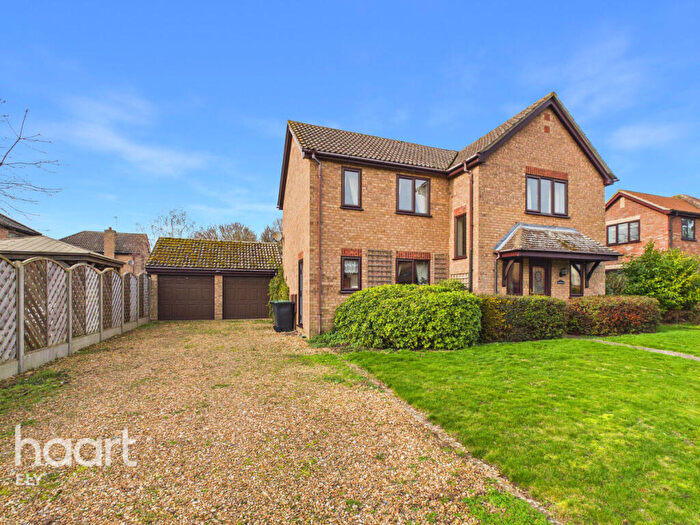
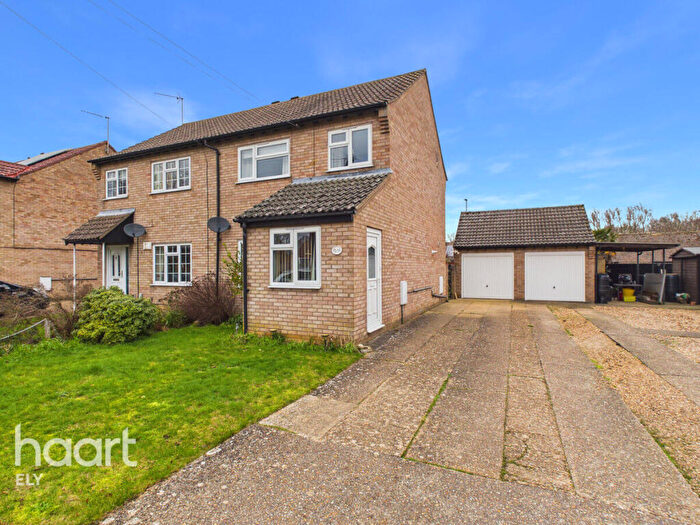
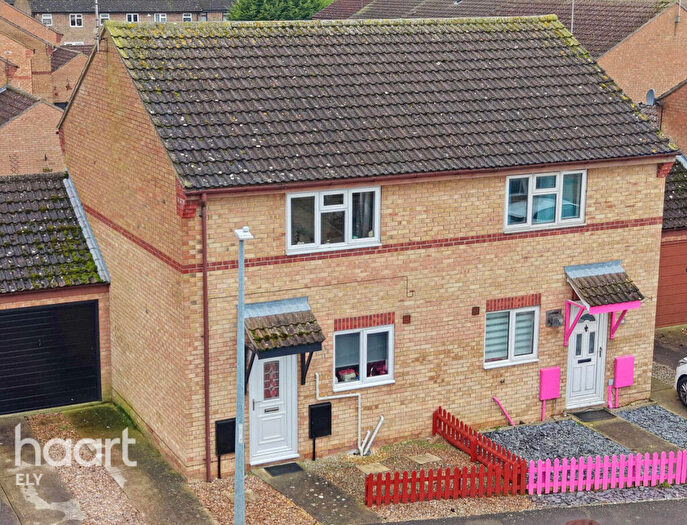
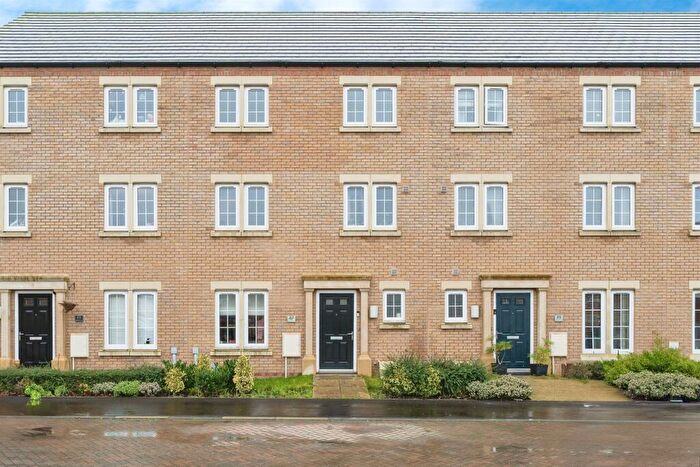
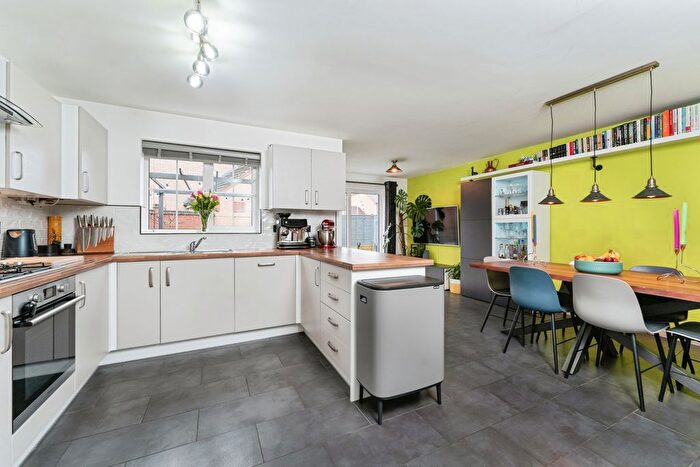
Houses for sale & to rent in Littleport, Ely
House Prices in Littleport
Properties in Littleport have an average house price of £276,838.00 and had 44 Property Transactions within the last 3 years¹.
Littleport is an area in Ely, Cambridgeshire with 204 households², where the most expensive property was sold for £445,000.00.
Properties for sale in Littleport
Roads and Postcodes in Littleport
Navigate through our locations to find the location of your next house in Littleport, Ely for sale or to rent.
| Streets | Postcodes |
|---|---|
| Adams Forge | CB6 1FA |
| Back Lane | CB6 1QH |
| Barley Way | CB6 1FS |
| Burberry Court | CB6 1GZ |
| Charolais Lane | CB6 1HA |
| Cherry Tree Court | CB6 1GX |
| Chestnut Lane | CB6 1FQ |
| City Road | CB6 1NF |
| Cornfield Lane | CB6 1EX |
| Faraday Road Business Park | CB6 1PE |
| Farrier Drive | CB6 1SQ |
| Fetlock Walk | CB6 1HH |
| First Westmoor Drove | CB6 1RP CB6 1RW |
| Friars Nine | CB6 1HD |
| Harvest Way | CB6 1EY |
| Havers Rise | CB6 1TF |
| Hempfield Place | CB6 1NR |
| Hempfield Road | CB6 1FT |
| Henry Crabb Road | CB6 1SE |
| Holdsworth Drive | CB6 1TB |
| Holly Close | CB6 1FD |
| Horsley Hale | CB6 1ER |
| Hunter Drive | CB6 1GU |
| Hyde Park | CB6 1FE |
| Lynn Road | CB6 1FU CB6 1JL |
| Marefen Drove | CB6 1RH |
| Martingale Lane | CB6 1GW |
| New Orchard Park | CB6 1LT |
| Newnham Chase | CB6 1SX CB6 1SY |
| Park Drive | CB6 1GQ |
| Parsons Lane | CB6 1JF CB6 1JG CB6 1JQ CB6 1JT |
| Poppy Close | CB6 1FZ |
| Sail View | CB6 1HY |
| Saxon Business Park | CB6 1XX |
| Shepherds Drove | CB7 4TE |
| Shire Lane | CB6 1GR |
| The Furrow | CB6 1GT |
| Victoria Gardens | CB6 1ND |
| Whitworth Way | CB6 1SS |
| Wisbech Road | CB6 1FY CB6 1GJ CB6 1RD CB6 1RF CB6 1RQ CB6 1ST |
| CB6 1QZ CB6 1GS CB6 1LS CB6 1LW |
Transport near Littleport
- FAQ
- Price Paid By Year
- Property Type Price
Frequently asked questions about Littleport
What is the average price for a property for sale in Littleport?
The average price for a property for sale in Littleport is £276,838. This amount is 21% lower than the average price in Ely. There are 1,376 property listings for sale in Littleport.
What streets have the most expensive properties for sale in Littleport?
The streets with the most expensive properties for sale in Littleport are Park Drive at an average of £300,000, Chestnut Lane at an average of £295,000 and Barley Way at an average of £294,250.
What streets have the most affordable properties for sale in Littleport?
The streets with the most affordable properties for sale in Littleport are The Furrow at an average of £135,700, Harvest Way at an average of £271,046 and Cornfield Lane at an average of £283,500.
Which train stations are available in or near Littleport?
Some of the train stations available in or near Littleport are Littleport, Ely and Shippea Hill.
Property Price Paid in Littleport by Year
The average sold property price by year was:
| Year | Average Sold Price | Price Change |
Sold Properties
|
|---|---|---|---|
| 2025 | £302,388 | 16% |
9 Properties |
| 2024 | £253,063 | -10% |
11 Properties |
| 2023 | £278,154 | -18% |
24 Properties |
| 2022 | £327,981 | 25% |
27 Properties |
| 2021 | £245,598 | -11% |
15 Properties |
| 2020 | £272,069 | 6% |
32 Properties |
| 2019 | £257,044 | 8% |
43 Properties |
| 2018 | £236,892 | 6% |
28 Properties |
| 2017 | £221,500 | -30% |
4 Properties |
| 2016 | £287,703 | 25% |
17 Properties |
| 2015 | £215,494 | 32% |
27 Properties |
| 2014 | £145,595 | -261% |
6 Properties |
| 2005 | £525,000 | 43% |
1 Property |
| 2004 | £300,000 | - |
1 Property |
Property Price per Property Type in Littleport
Here you can find historic sold price data in order to help with your property search.
The average Property Paid Price for specific property types in the last three years are:
| Property Type | Average Sold Price | Sold Properties |
|---|---|---|
| Semi Detached House | £275,120.00 | 10 Semi Detached Houses |
| Detached House | £338,690.00 | 11 Detached Houses |
| Terraced House | £248,004.00 | 23 Terraced Houses |

