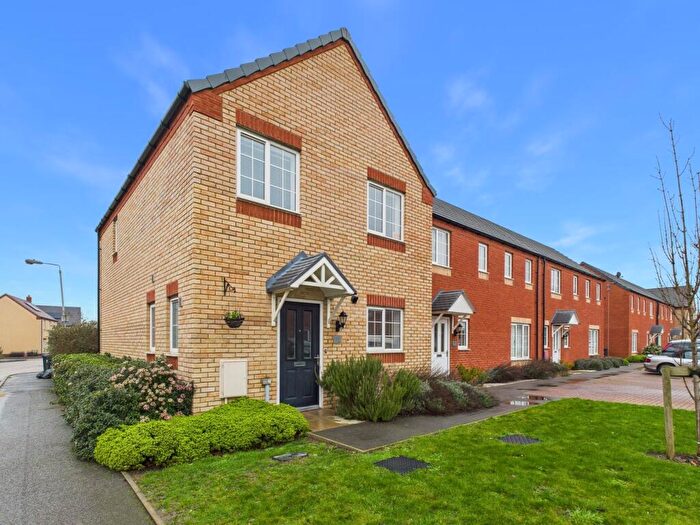
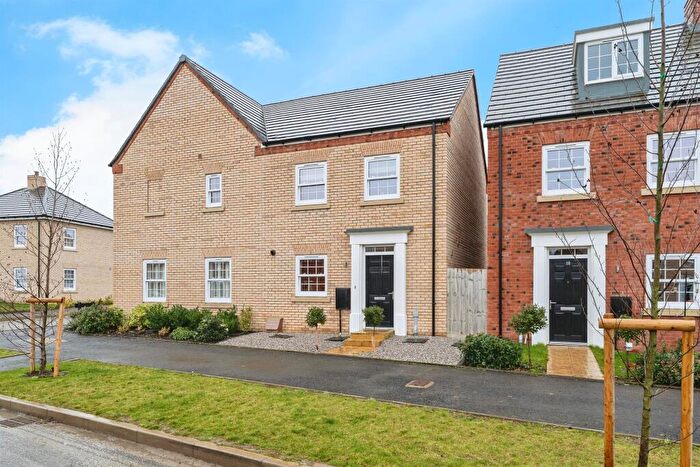
Houses for sale & to rent in Ely East, Ely
House Prices in Ely East
Properties in Ely East have an average house price of £365,428.00 and had 192 Property Transactions within the last 3 years¹.
Ely East is an area in Ely, Cambridgeshire with 1,831 households², where the most expensive property was sold for £1,150,000.00.
Properties for sale in Ely East
Roads and Postcodes in Ely East
Navigate through our locations to find the location of your next house in Ely East, Ely for sale or to rent.
| Streets | Postcodes |
|---|---|
| Annesdale | CB7 4BN |
| Archery Crescent | CB7 4QH |
| Back Hill | CB7 4BZ CB7 4DA |
| Back Lane | CB7 4AR |
| Barton Mews | CB7 4DR |
| Barton Road | CB7 4DE CB7 4HZ |
| Barton Square | CB7 4DF CB7 4DG |
| Bishop Wynn Close | CB7 4BH |
| Branch Bank | CB7 4UR |
| Branch Bridge | CB7 4UG |
| Brays Lane | CB7 4QJ |
| Bridge Road | CB7 4DY |
| Broad Street | CB7 4AH CB7 4AJ CB7 4BD CB7 4BE CB7 4BQ CB7 4FJ |
| Butchers Row | CB7 4NA CB7 4NE |
| Buttermarket | CB7 4NY |
| Cambridge Road | CB7 4HJ CB7 4HX |
| Cardinals Terrace | CB7 4GE |
| Cardinals Way | CB7 4GB CB7 4GF |
| Castlehythe | CB7 4BU |
| Chantry Lane | CB7 4JH |
| Charles Graven Court | CB7 4FN |
| Chequer Lane | CB7 4LN |
| Chorister Court | CB7 4DU |
| Church Lane | CB7 4JG |
| Corner Close | CB7 4UY |
| Coronation Parade | CB7 4LB |
| Cresswells Lane | CB7 4PF |
| Deacons Lane | CB7 4PT |
| Dolphin Lane | CB7 4LY |
| Douglas Court | CB7 4SE |
| Dovehouse Close | CB7 4BY |
| Ely Road | CB7 4TZ CB7 4UA CB7 4UJ |
| Fore Hill | CB7 4AA CB7 4AF CB7 4AQ |
| Hallfield Terrace | CB7 5TS |
| High Street | CB7 4LF CB7 4LJ CB7 4JR CB7 4JU CB7 4LA CB7 4LQ CB7 4LT |
| High Street Back | CB7 4WH |
| High Street Passage | CB7 4NB |
| Jubilee Terrace | CB7 4BJ |
| Kingdon Avenue | CB7 4UL |
| Lark Bank | CB7 4SW |
| Lisle Close | CB7 4AD |
| Lisle Lane | CB7 4AS CB7 4FA |
| Low Road | CB7 4UQ |
| Lower Road | CB7 5TN |
| Lynn Road | CB6 1DB CB7 4EJ |
| Main Street | CB7 4UN |
| Market Place | CB7 4NP CB7 4NT CB7 4NU CB7 4QN |
| Market Street | CB7 4LP CB7 4LS CB7 4LR CB7 4LU CB7 4LZ CB7 4PB CB7 4YY |
| Mildenhall Road | CB7 4SU |
| Mile End Crossing | CB7 4TQ |
| Mile End Road | CB7 4SJ |
| Minster Place | CB7 4EL |
| Missin Gate | CB7 4FW |
| Newnham Street | CB7 4PE CB7 4PG |
| Nornea Lane | CB7 5TT |
| Nutholt Lane | CB7 4EE CB7 9SA CB7 9SB CB7 9SD CB7 9SE CB7 9SF CB7 9SG CB7 9SH CB7 9SJ CB7 9SL CB7 9SP CB7 9SQ CB7 9SR CB7 9SS CB7 9ST CB7 9SU CB7 9SW CB7 9SX CB7 9SY CB7 9SZ CB7 9TA |
| Old Bank | CB7 4UT CB7 4XJ |
| Old Brewery Close | CB7 4QE |
| Osier Close | CB7 4AY |
| Padnal Bank | CB7 4UE CB7 4UF CB7 4UP |
| Palace Green | CB7 4EW |
| Parade Lane | CB7 4JA |
| Potters Lane | CB7 4BX |
| Prickwillow Road | CB7 4QP CB7 4QT CB7 4SH CB7 4NS |
| Putney Hill Road | CB7 4UU |
| Quanea Drove | CB7 5TJ |
| Quayside | CB7 4BA |
| Queen Adelaide Way | CB7 5FA |
| Riflemans Close | CB6 1FF |
| Riverside Close | CB7 4UW |
| Roswell View | CB7 4JS |
| Seymours Paddock | CB7 5RS |
| Ship Lane | CB7 4BB CB7 4EZ |
| Silver Street | CB7 4JB CB7 4JF |
| Soham Road | CB7 5TL CB7 5TP CB7 5TR |
| Springhead Lane | CB7 4QY |
| St Martins Walk | CB7 4QF |
| St Marys Court | CB7 4HQ |
| St Marys Street | CB7 4ER CB7 4HF |
| Station Cottages | CB7 4SP |
| Station Road | CB7 4BS CB7 4BP CB7 4BW |
| Steward Close | CB7 5TW |
| Stuntney Causeway | CB7 5TH |
| The Cloisters | CB7 4ZH |
| The College | CB7 4DL CB7 4DN CB7 4DS CB7 4DW |
| The Deans Meadow | CB7 4BG |
| The Range | CB7 4JD |
| The Turnpike | CB7 4JJ |
| The Vineyards | CB7 4QG CB7 4SQ |
| Three Cups Walk | CB7 4AN |
| Victoria Street | CB7 4BL |
| Vineyard Way | CB7 4QQ |
| Waterside | CB7 4AU CB7 4AZ |
| Willow Grove | CB7 4EB |
| Willow Walk | CB7 4AT |
| Woolpack Yard | CB7 4PX |
| CB6 1WA CB6 1WD CB6 2WG CB6 2XW CB7 4ED CB7 4EF CB7 4PA CB7 4RB CB7 4SB CB7 4YN CB7 5NA CB7 5YH CB7 4HG |
Transport near Ely East
- FAQ
- Price Paid By Year
- Property Type Price
Frequently asked questions about Ely East
What is the average price for a property for sale in Ely East?
The average price for a property for sale in Ely East is £365,428. This amount is 4% higher than the average price in Ely. There are 2,590 property listings for sale in Ely East.
What streets have the most expensive properties for sale in Ely East?
The streets with the most expensive properties for sale in Ely East are High Street at an average of £750,000, Seymours Paddock at an average of £655,000 and Cambridge Road at an average of £607,125.
What streets have the most affordable properties for sale in Ely East?
The streets with the most affordable properties for sale in Ely East are Putney Hill Road at an average of £126,500, Roswell View at an average of £173,000 and Market Street at an average of £188,500.
Which train stations are available in or near Ely East?
Some of the train stations available in or near Ely East are Ely, Littleport and Shippea Hill.
Property Price Paid in Ely East by Year
The average sold property price by year was:
| Year | Average Sold Price | Price Change |
Sold Properties
|
|---|---|---|---|
| 2025 | £353,313 | -6% |
63 Properties |
| 2024 | £375,753 | 2% |
68 Properties |
| 2023 | £366,430 | -12% |
61 Properties |
| 2022 | £411,965 | 10% |
80 Properties |
| 2021 | £372,573 | 9% |
113 Properties |
| 2020 | £339,651 | -13% |
49 Properties |
| 2019 | £382,364 | 27% |
67 Properties |
| 2018 | £278,125 | -15% |
166 Properties |
| 2017 | £318,577 | 3% |
79 Properties |
| 2016 | £309,307 | 8% |
78 Properties |
| 2015 | £284,486 | 9% |
75 Properties |
| 2014 | £259,622 | 7% |
94 Properties |
| 2013 | £240,677 | 11% |
82 Properties |
| 2012 | £214,864 | -11% |
49 Properties |
| 2011 | £238,453 | -2% |
67 Properties |
| 2010 | £242,871 | 20% |
66 Properties |
| 2009 | £193,897 | -21% |
50 Properties |
| 2008 | £235,448 | 1% |
83 Properties |
| 2007 | £233,691 | 8% |
136 Properties |
| 2006 | £215,332 | 8% |
96 Properties |
| 2005 | £197,754 | 1% |
80 Properties |
| 2004 | £194,962 | 3% |
107 Properties |
| 2003 | £188,157 | 17% |
98 Properties |
| 2002 | £155,864 | 10% |
145 Properties |
| 2001 | £139,673 | 30% |
127 Properties |
| 2000 | £98,335 | 9% |
83 Properties |
| 1999 | £89,599 | 12% |
85 Properties |
| 1998 | £78,661 | 3% |
86 Properties |
| 1997 | £76,513 | 10% |
113 Properties |
| 1996 | £69,216 | 8% |
96 Properties |
| 1995 | £63,808 | - |
76 Properties |
Property Price per Property Type in Ely East
Here you can find historic sold price data in order to help with your property search.
The average Property Paid Price for specific property types in the last three years are:
| Property Type | Average Sold Price | Sold Properties |
|---|---|---|
| Flat | £256,366.00 | 42 Flats |
| Semi Detached House | £354,946.00 | 28 Semi Detached Houses |
| Detached House | £535,460.00 | 47 Detached Houses |
| Terraced House | £323,862.00 | 75 Terraced Houses |

