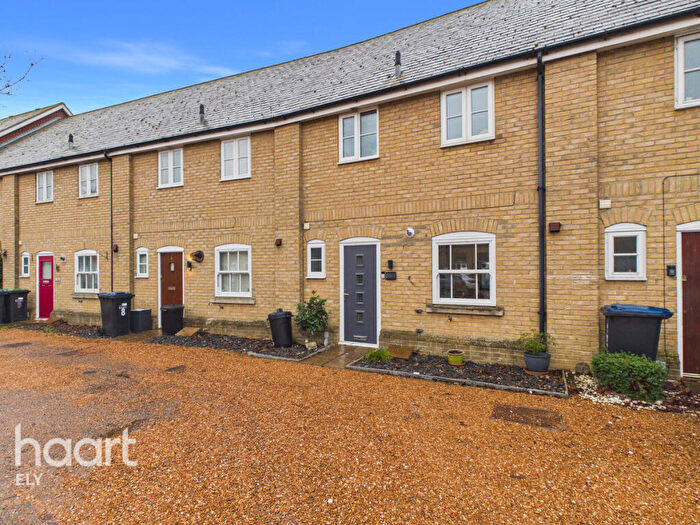
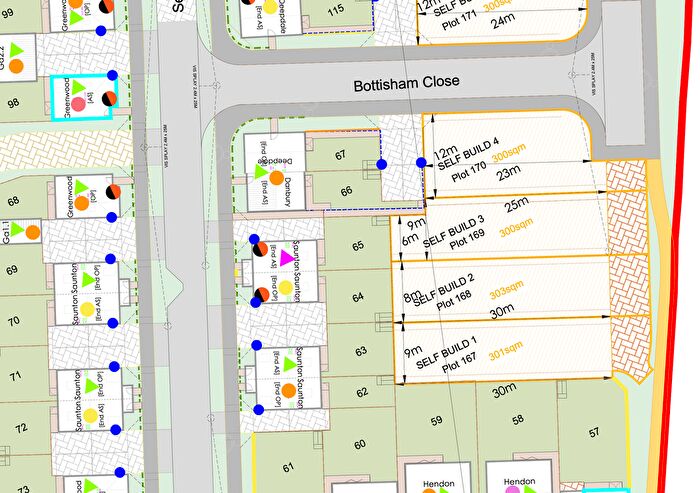
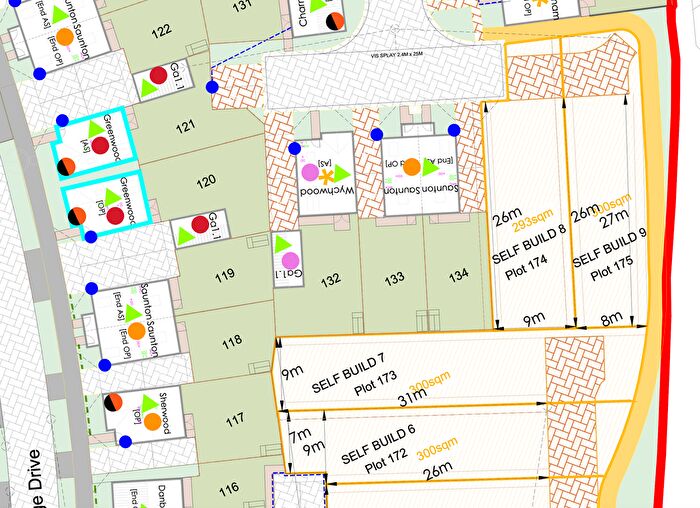
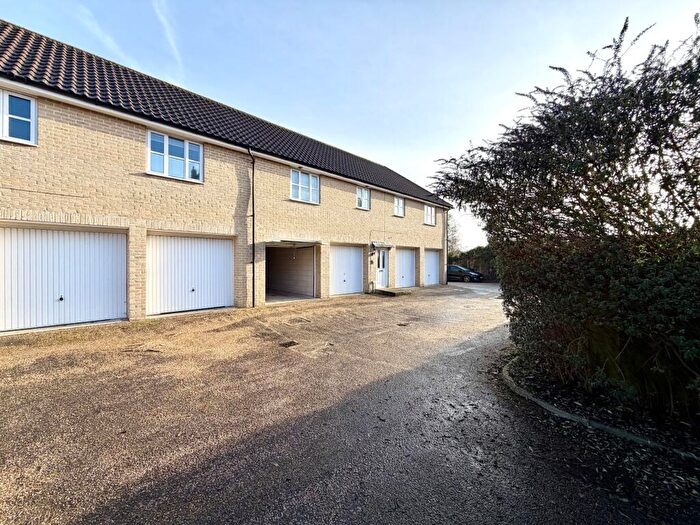
Houses for sale & to rent in Soham North, Ely
House Prices in Soham North
Properties in Soham North have an average house price of £318,146.00 and had 162 Property Transactions within the last 3 years¹.
Soham North is an area in Ely, Cambridgeshire with 2,056 households², where the most expensive property was sold for £1,320,000.00.
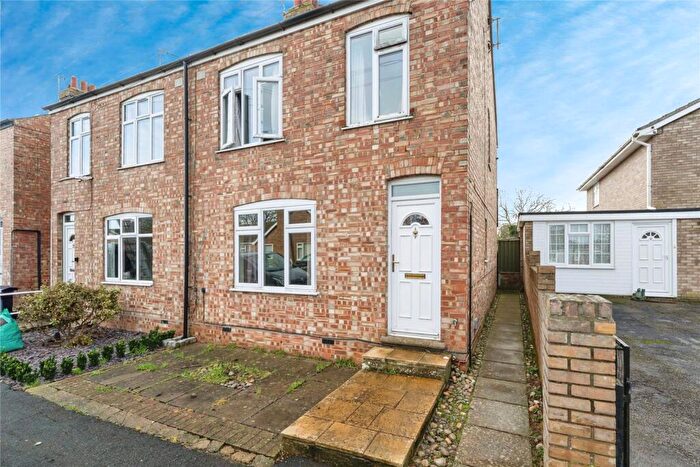
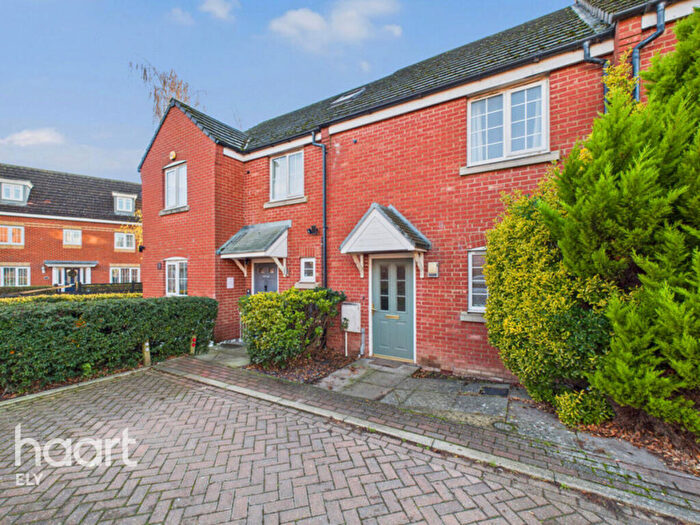
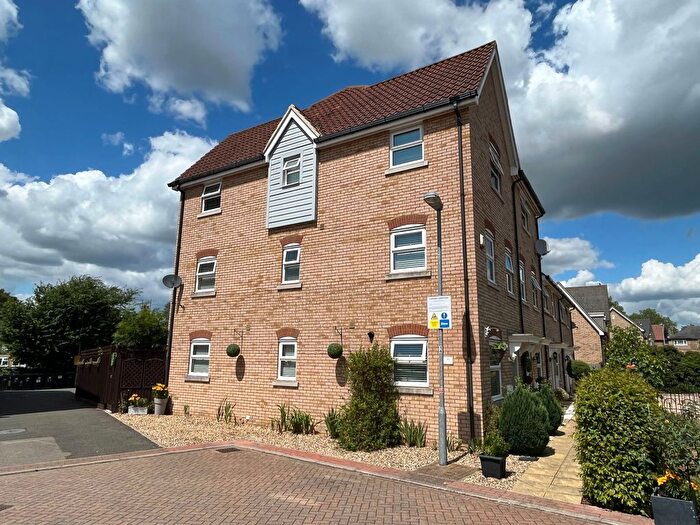
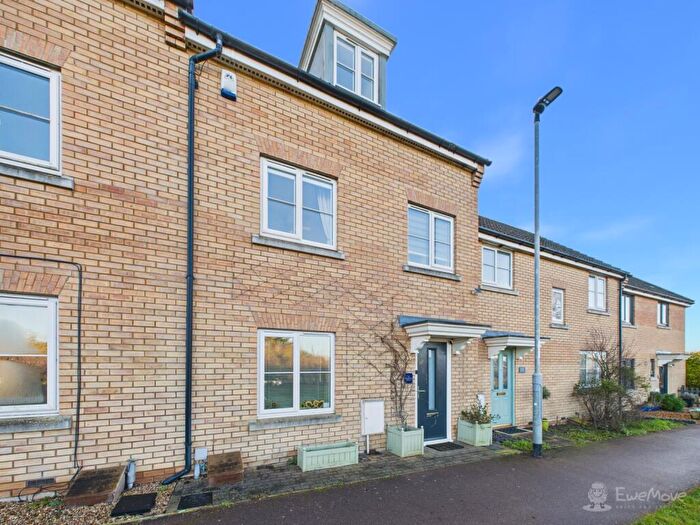
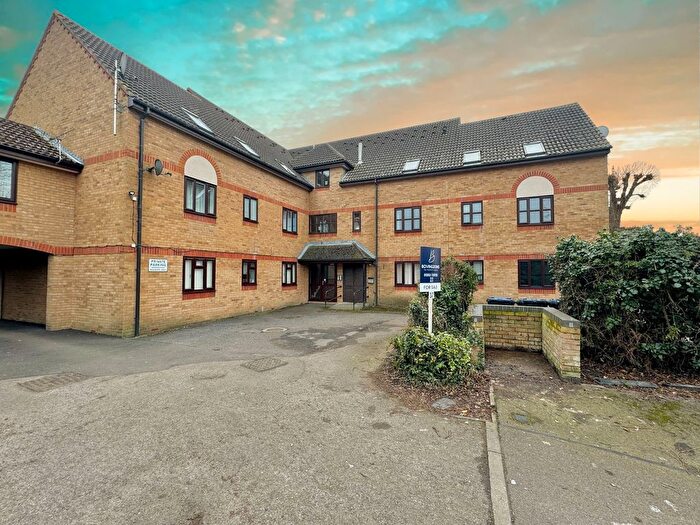
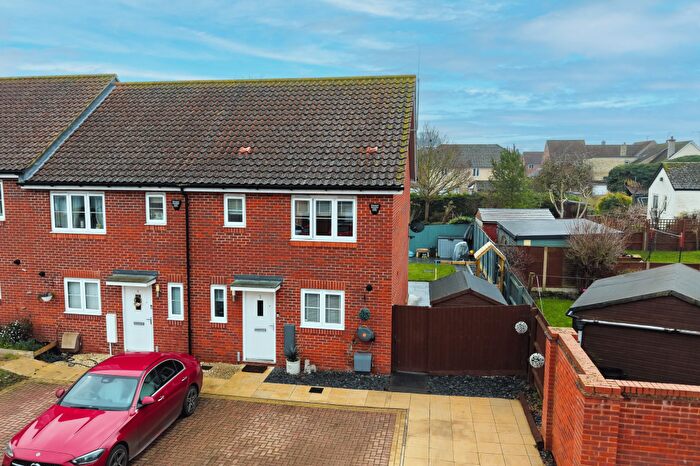
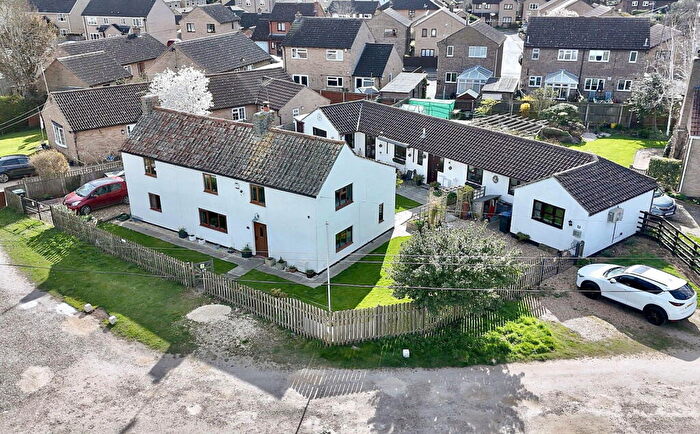
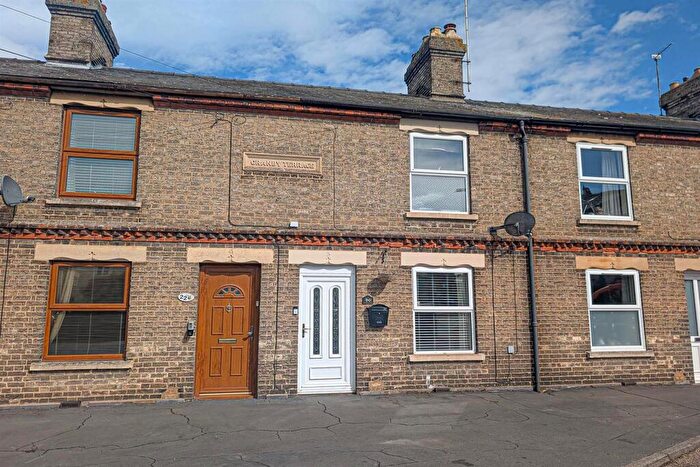
Properties for sale in Soham North
Roads and Postcodes in Soham North
Navigate through our locations to find the location of your next house in Soham North, Ely for sale or to rent.
| Streets | Postcodes |
|---|---|
| Aspen Way | CB7 5ZQ |
| Avocet Grove | CB7 5GN |
| Bancroft Lane | CB7 5DG |
| Barcham Road | CB7 5TU |
| Barway | CB7 5UB |
| Barway Road | CB7 5TX CB7 5UA CB7 5GT CB7 5TZ |
| Bell Gardens | CB7 5XB |
| Bittern Grove | CB7 5FR |
| Blackthorn Court | CB7 5DT |
| Bluebell Walk | CB7 5YX |
| Broad Piece | CB7 5EL |
| Broadhill Drove | CB7 5UG |
| Bushel Lane | CB7 5BY CB7 5BZ |
| Calfe Fen Close | CB7 5GD |
| Campion Close | CB7 5FX |
| Chapel Lane | CB7 5UL |
| Chestnut Drive | CB7 5FW |
| Chicheley Close | CB7 5JS |
| Clarks Drove | CB7 5DW |
| Cloverfield Drive | CB7 5FS CB7 5FT |
| Cyprian Rust Way | CB7 5ZE |
| Diamond Jubilee Close | CB7 5ZN |
| Evershed Fields | CB7 6BE |
| Eye Hill Drove | CB7 5XF |
| Foxwood North | CB7 5YR CB7 5YS |
| Foxwood South | CB7 5YP CB7 5YW CB7 5TQ |
| Gadwall Way | CB7 5GQ |
| Gimbert Road | CB7 5FD |
| Great Fen Road | CB7 5UH CB7 5UQ CB7 5UJ |
| Hall Street | CB7 5BN CB7 5BS CB7 5BW |
| Harrison Court | CB7 5WH |
| Hasse Road | CB7 5UN CB7 5UW |
| Herbert Human Close | CB7 5ZT |
| Heron Croft | CB7 5UT CB7 5WA |
| Holmes Lane | CB7 5JP |
| Honeysuckle Close | CB7 5YT |
| Julius Martin Lane | CB7 5EQ |
| Kingfisher Drive | CB7 5GP |
| Lapwing Way | CB7 5GE |
| Long Dolver Drove | CB7 5UP |
| Longmere Lane | CB7 5EN |
| Martin Close | CB7 5EJ CB7 5ES |
| Mereside | CB7 5EG |
| Middlemere Drove | CB7 5EW |
| Nightall Road | CB7 5FE |
| North Drive | CB7 5UD |
| Northfield Park | CB7 5UZ CB7 5XA |
| Northfield Road | CB7 5UE CB7 5UF |
| Old School Close | CB7 5WD |
| Poppy Fields | CB7 5TG |
| Primrose Lane | CB7 5YY |
| Qua Fen Common | CB7 5DF CB7 5DH CB7 5DQ |
| Queensway | CB7 5BU CB7 5BX |
| Redshank Close | CB7 5FG |
| Rosebay Gardens | CB7 5YU |
| Rosefield Lane | CB7 5WB |
| Shocksham Terrace | CB7 5QN |
| Silvers Close | CB7 5ET |
| Snowberry Way | CB7 5YZ |
| Soham Bypass | CB7 5WZ |
| Speed Lane | CB7 5BT |
| Spencer Drove | CB7 6EE |
| St Felix Close | CB7 5ZX |
| Teal Avenue | CB7 5UX |
| Ten Bell Lane | CB7 5BJ |
| The Birches | CB7 5FH |
| The Cotes | CB7 5EP CB7 5ER |
| The Shade | CB7 5DE CB7 5HF |
| Thorn Close | CB7 5EH |
| Townsend | CB7 5DB CB7 5DD |
| Weatheralls Close | CB7 5BQ |
Transport near Soham North
-
Ely Station
-
Shippea Hill Station
-
Littleport Station
-
Waterbeach Station
-
Newmarket Station
-
Kennett Station
- FAQ
- Price Paid By Year
- Property Type Price
Frequently asked questions about Soham North
What is the average price for a property for sale in Soham North?
The average price for a property for sale in Soham North is £318,146. This amount is 9% lower than the average price in Ely. There are 1,049 property listings for sale in Soham North.
What streets have the most expensive properties for sale in Soham North?
The streets with the most expensive properties for sale in Soham North are Barway Road at an average of £1,185,000, The Birches at an average of £650,000 and Barway at an average of £555,000.
What streets have the most affordable properties for sale in Soham North?
The streets with the most affordable properties for sale in Soham North are Bluebell Walk at an average of £125,000, Heron Croft at an average of £183,000 and Rosebay Gardens at an average of £190,000.
Which train stations are available in or near Soham North?
Some of the train stations available in or near Soham North are Ely, Shippea Hill and Littleport.
Property Price Paid in Soham North by Year
The average sold property price by year was:
| Year | Average Sold Price | Price Change |
Sold Properties
|
|---|---|---|---|
| 2025 | £274,314 | -21% |
60 Properties |
| 2024 | £330,803 | -10% |
63 Properties |
| 2023 | £365,133 | 25% |
39 Properties |
| 2022 | £273,156 | -6% |
60 Properties |
| 2021 | £290,712 | 5% |
107 Properties |
| 2020 | £274,841 | 8% |
55 Properties |
| 2019 | £251,891 | -2% |
82 Properties |
| 2018 | £256,197 | 9% |
93 Properties |
| 2017 | £233,175 | 4% |
104 Properties |
| 2016 | £223,027 | 8% |
135 Properties |
| 2015 | £205,573 | 16% |
106 Properties |
| 2014 | £171,837 | 3% |
90 Properties |
| 2013 | £167,296 | 2% |
86 Properties |
| 2012 | £163,854 | 4% |
102 Properties |
| 2011 | £156,529 | -2% |
95 Properties |
| 2010 | £159,533 | -3% |
81 Properties |
| 2009 | £163,700 | -10% |
103 Properties |
| 2008 | £179,352 | 7% |
91 Properties |
| 2007 | £167,201 | 0,1% |
169 Properties |
| 2006 | £167,093 | 7% |
258 Properties |
| 2005 | £155,614 | 10% |
79 Properties |
| 2004 | £140,352 | 13% |
121 Properties |
| 2003 | £122,718 | 19% |
87 Properties |
| 2002 | £99,387 | 10% |
138 Properties |
| 2001 | £89,346 | 12% |
121 Properties |
| 2000 | £78,862 | 10% |
112 Properties |
| 1999 | £71,277 | 8% |
125 Properties |
| 1998 | £65,641 | 12% |
112 Properties |
| 1997 | £57,545 | 13% |
94 Properties |
| 1996 | £50,131 | 2% |
113 Properties |
| 1995 | £49,136 | - |
74 Properties |
Property Price per Property Type in Soham North
Here you can find historic sold price data in order to help with your property search.
The average Property Paid Price for specific property types in the last three years are:
| Property Type | Average Sold Price | Sold Properties |
|---|---|---|
| Semi Detached House | £283,303.00 | 50 Semi Detached Houses |
| Detached House | £473,845.00 | 47 Detached Houses |
| Terraced House | £238,604.00 | 60 Terraced Houses |
| Flat | £157,500.00 | 5 Flats |

