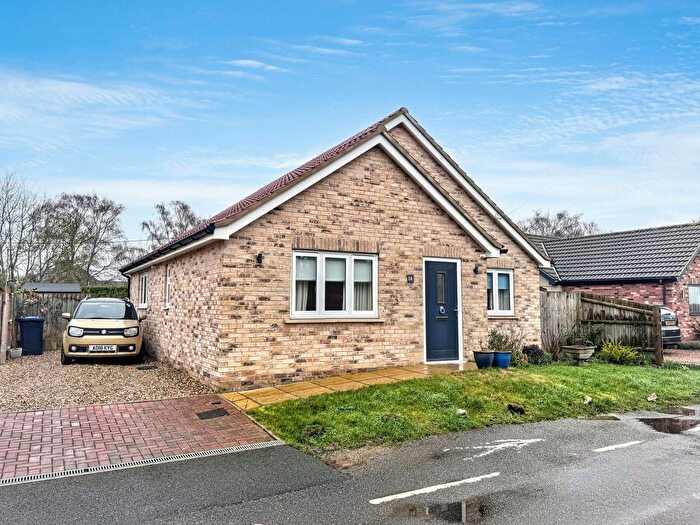
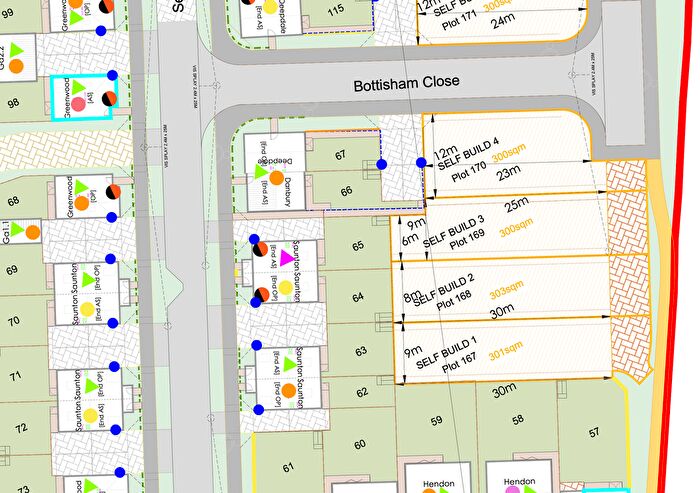
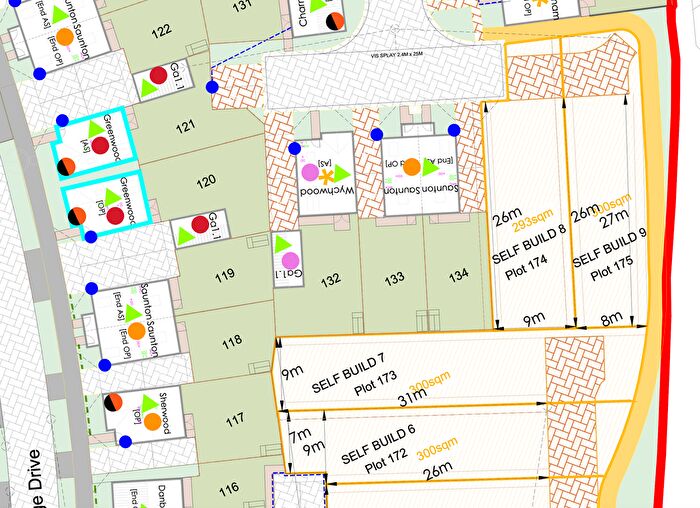
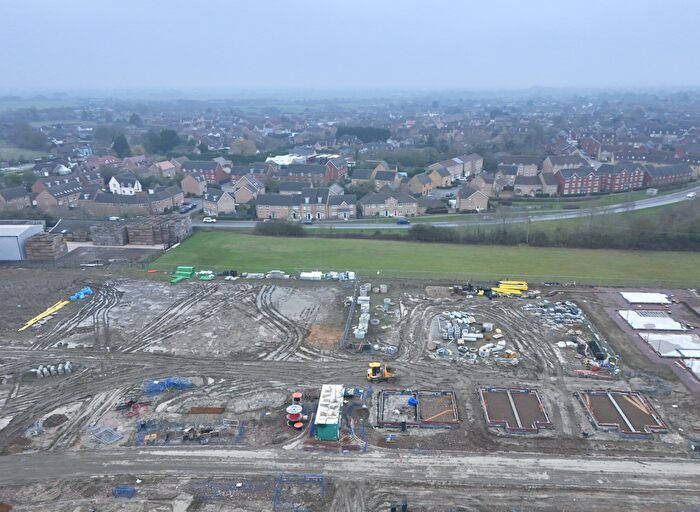
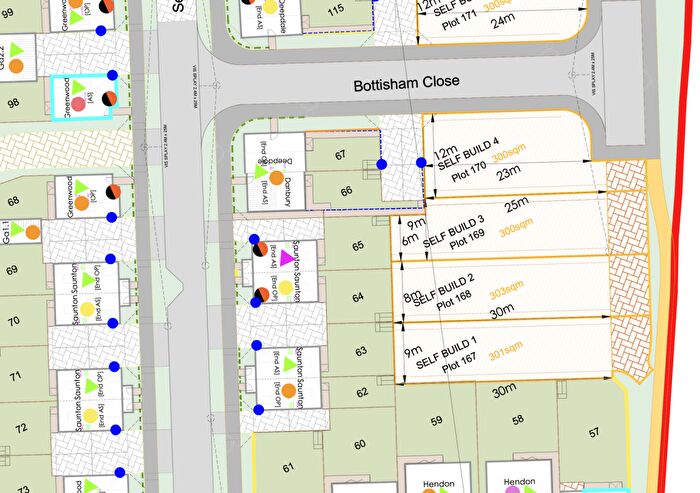
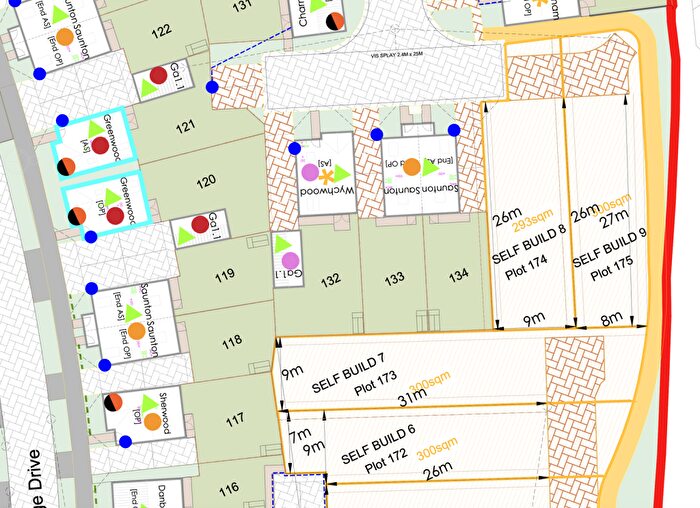
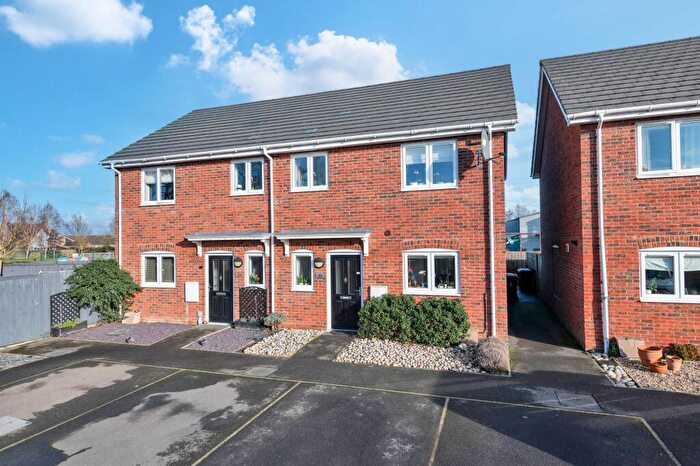
Houses for sale & to rent in Soham South, Ely
House Prices in Soham South
Properties in Soham South have an average house price of £287,727.00 and had 270 Property Transactions within the last 3 years¹.
Soham South is an area in Ely, Cambridgeshire with 2,726 households², where the most expensive property was sold for £890,000.00.
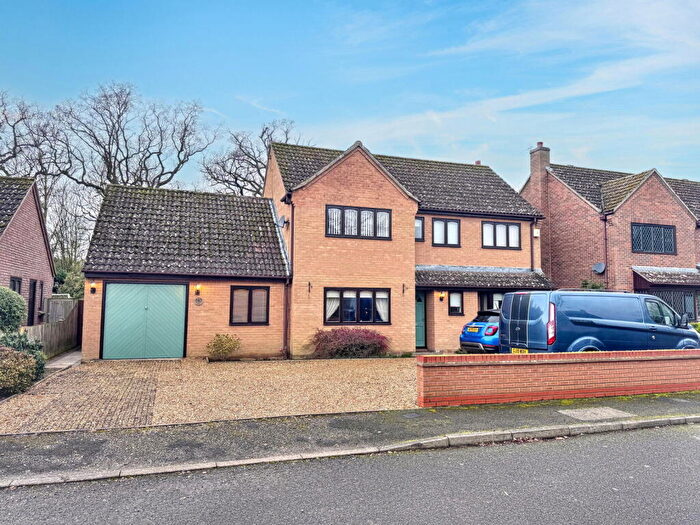
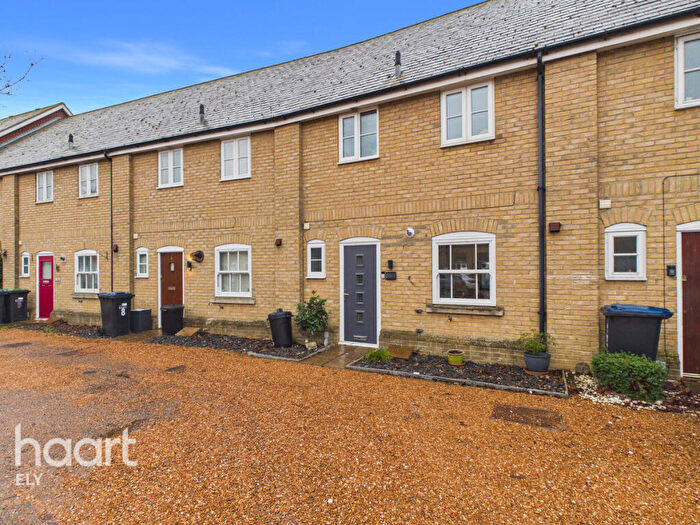
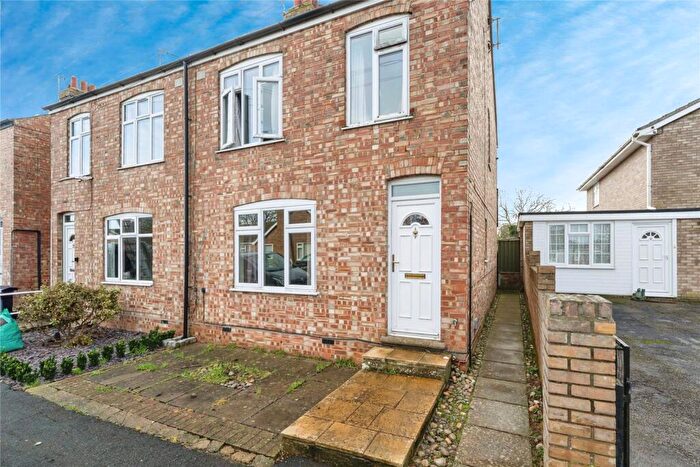
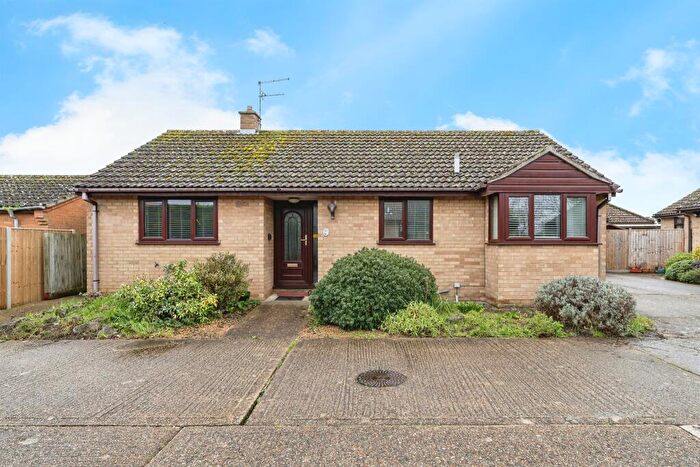
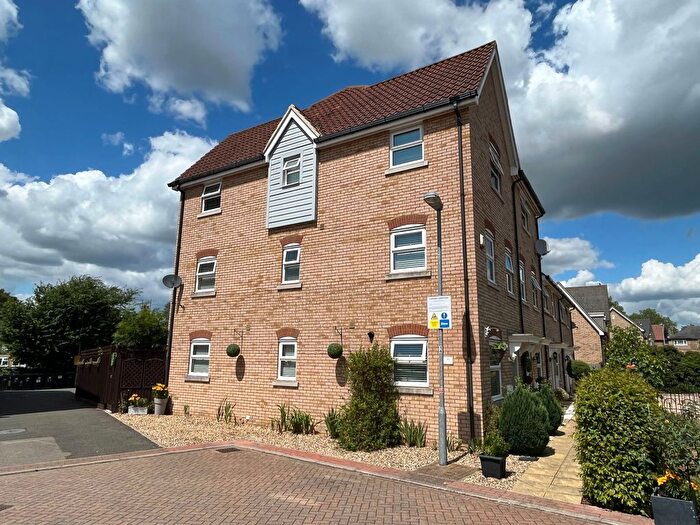
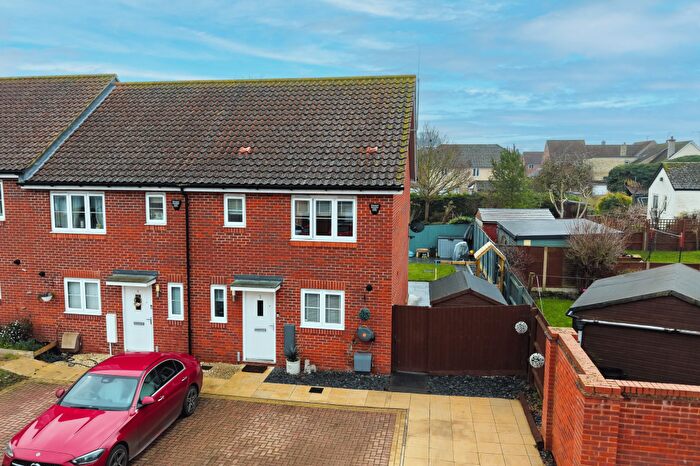
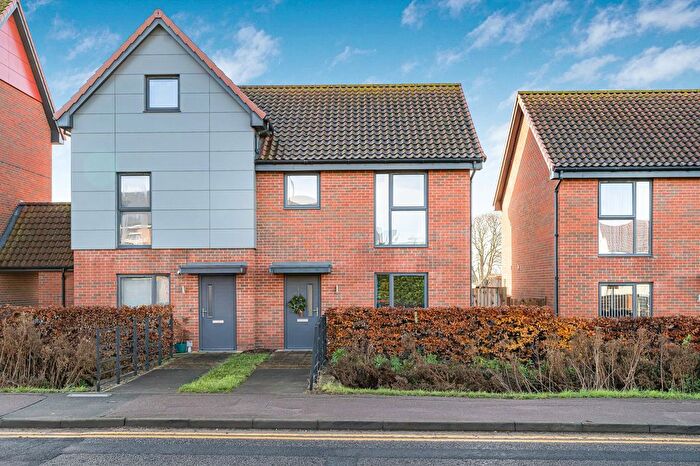
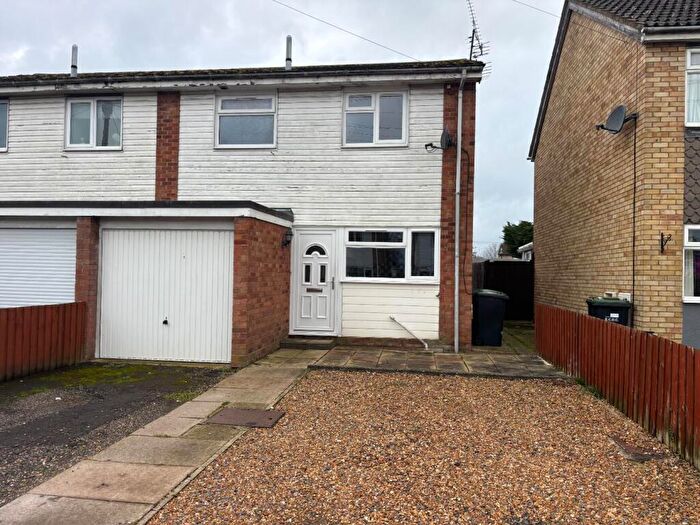
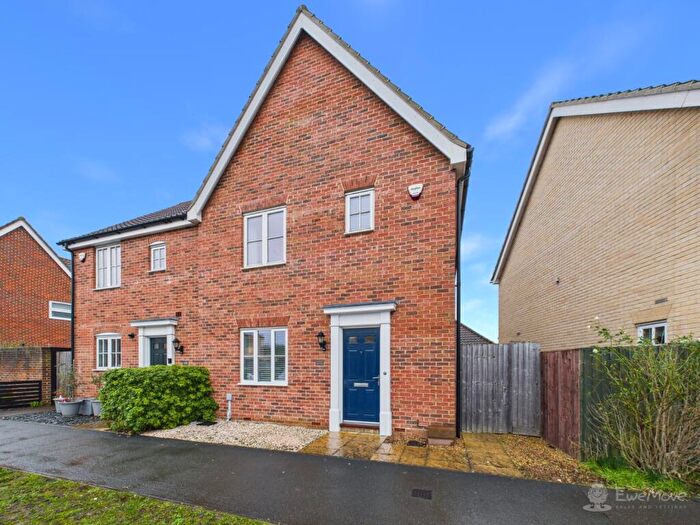
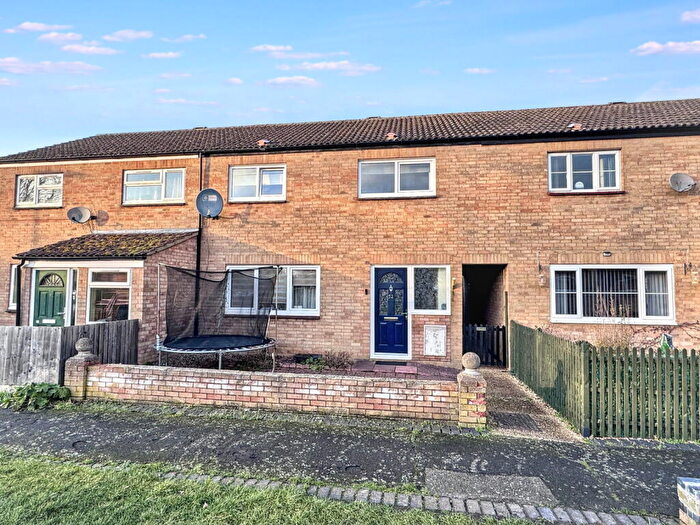
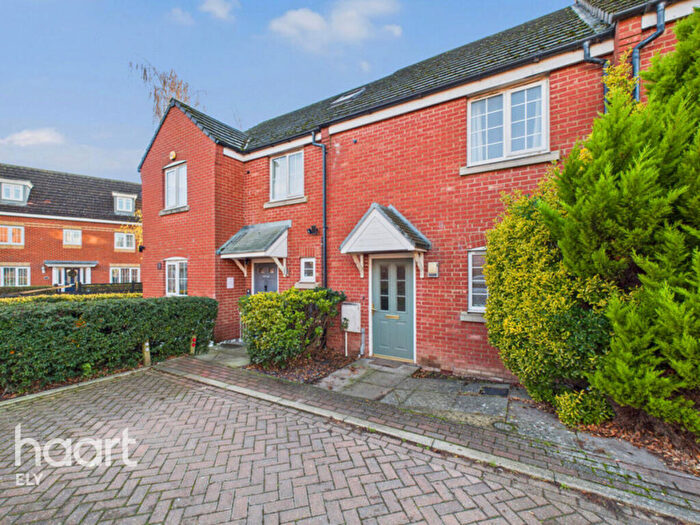
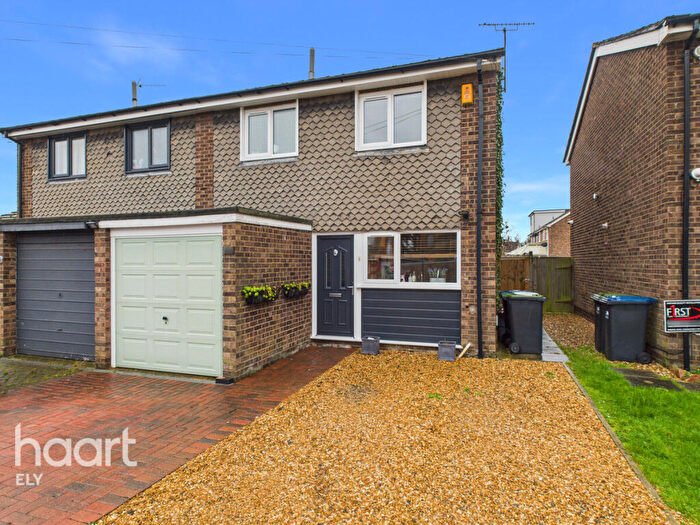
Properties for sale in Soham South
Roads and Postcodes in Soham South
Navigate through our locations to find the location of your next house in Soham South, Ely for sale or to rent.
| Streets | Postcodes |
|---|---|
| Adelaide Close | CB7 5FJ |
| Angle Common | CB7 5HX |
| Archers Close | CB7 5QL |
| Back Lane | CB7 5YL |
| Berrycroft | CB7 5BL |
| Brewhouse Lane | CB7 5JD CB7 5JE |
| Brook Dam Lane | CB7 5HZ CB7 5TF |
| Brook Street | CB7 5AD CB7 5AE |
| Butts Close | CB7 5JR |
| Butts Lane | CB7 5XU |
| Cedar Court | CB7 5FL |
| Celandine View | CB7 5DP CB7 5FU |
| Centre Road | CB7 5AU CB7 5AX |
| Chapel Lane | CB7 5XZ |
| Church Hall Close | CB7 5WE |
| Church Road | CB7 5XT |
| Churchgate Street | CB7 5DR CB7 5DS |
| Clay Street | CB7 5HH CB7 5HJ CB7 5HL |
| College Close | CB7 5HP |
| College Road | CB7 5HW |
| Coral Place | CB7 5PQ |
| Cornmills Road | CB7 5AT |
| Cornwell Close | CB7 5GX |
| Cross Green | CB7 5XS CB7 5DU |
| Dace Drive | CB7 6AH |
| Dobede Way | CB7 5FN CB7 5ZJ |
| Drury Lane | CB7 5XY |
| East Fen Common | CB7 5JH CB7 5JJ |
| East Fen Drove | CB7 5JL |
| Eastern Avenue | CB7 5JF |
| Emerald Way | CB7 6AT |
| Ennion Close | CB7 5GU |
| Fair Field Close | CB7 5EU |
| Field Farm Cottages | CB7 5YG |
| Flounder Close | CB7 6AG |
| Fordham Road | CB7 5AH CB7 5AJ CB7 5AL CB7 5AQ CB7 5FP |
| Fountain Lane | CB7 5ED |
| Frank Bridges Close | CB7 5EZ |
| Frederick Talbot Close | CB7 5EY |
| Gardeners Lane | CB7 5HS |
| Gidney Lane | CB7 5FZ |
| Glenare Court | CB7 5TY |
| Greenhills | CB7 5DA |
| Guntons Close | CB7 5DJ CB7 5DL CB7 5DN |
| Hardfields Court | CB7 5WX |
| Hawes Lane | CB7 5ZW |
| Hawker Drive | CB7 6AS |
| High Street | CB7 5HA CB7 5HB CB7 5HD CB7 5HE CB7 5XR |
| Hodson Close | CB7 5PL |
| Kents Lane | CB7 5DX |
| Kings Parade | CB7 5AR |
| Lines Close | CB7 5PY |
| Lode Close | CB7 5HR CB7 5WN |
| Lode Lane | CB7 5XP |
| Lower Road | CB7 5YA CB7 5YB CB7 5YD |
| Maple Close | CB7 5WT |
| Market Street | CB7 5JG |
| Market Street Mews | CB7 5ZG |
| Meadow Close | CB7 5FB |
| Mereside | CB7 5EE CB7 5XE |
| Military Road | CB7 5AS |
| Mill Corner | CB7 5HT CB7 5HU |
| Millcroft | CB7 5AP |
| Mistral Close | CB7 5BP |
| Morello Chase | CB7 5WQ CB7 5ZU |
| Mynott Mews | CB7 5WJ |
| North Street | CB7 5XW |
| Nutholt Lane | CB7 9ZQ |
| Old School Lane | CB7 5ZR |
| Orchard Row | CB7 5AY CB7 5AZ CB7 5FY |
| Paddock Street | CB7 5JA CB7 5JB |
| Padney Road | CB7 5YE CB7 5YF |
| Pennywort | CB7 5ZF |
| Perch Chase | CB7 6AJ |
| Pond Green | CB7 5XX |
| Pratt Street | CB7 5BH |
| Red House Gardens | CB7 5FQ |
| Red Lion Square | CB7 5HQ |
| Redit Lane | CB7 5WU |
| Regal Drive | CB7 5BE |
| Regal Lane | CB7 5BA |
| Regent Place | CB7 5RL |
| Sand Street | CB7 5AA |
| Skimmer Chase | CB7 6AW |
| St Andrews Park | CB7 5GY CB7 5GZ |
| Staples Lane | CB7 5AF |
| Staploe Mews | CB7 5JW |
| Station Road | CB7 5DY CB7 5DZ |
| Stretham Road | CB7 5XH CB7 5XL CB7 5XQ |
| Sunburst Green | CB7 5WL |
| Swallowtail Close | CB7 5HY |
| Symphony Court | CB7 5QD |
| Tanners Lane | CB7 5AB |
| The Butts | CB7 5AN CB7 5AW |
| The Causeway | CB7 5BB CB7 5BD |
| The Crescent | CB7 5AG CB7 5XN |
| The Oaks | CB7 5FF |
| Thomas Mews | CB7 5JN |
| Valerian Gardens | CB7 5WR |
| Victoria Mews | CB7 5HG |
| West Drive | CB7 5EA |
| West Drive Crescent | CB7 5EB |
| West Drive Gardens | CB7 5EF CB7 5EX |
| White Hart Lane | CB7 5JQ |
| Windmill Close | CB7 5BG |
| CB7 5YQ CB7 9BX CB7 9DE CB7 9DP CB7 9DR CB7 9ED CB7 9EF CB7 9ER CB7 9EX CB7 9EY CB7 9EZ CB7 9FJ CB7 9FP CB7 9FU CB7 9GF CB7 9GG CB7 9GJ CB7 9GN CB7 9GQ CB7 9GU CB7 9GX CB7 9GY CB7 9HA CB7 9HE CB7 9HF CB7 9HG CB7 9HH CB7 9PQ CB7 9RP CB7 9WQ CB7 9ZJ CB7 9ZR CB7 6AU CB7 9HP CB7 9HR CB7 9HX CB7 9JA CB7 9JG CB7 9JH CB7 9JP CB7 9JQ CB7 9JR CB7 9JS |
Transport near Soham South
-
Ely Station
-
Newmarket Station
-
Waterbeach Station
-
Kennett Station
-
Shippea Hill Station
-
Dullingham Station
-
Littleport Station
- FAQ
- Price Paid By Year
- Property Type Price
Frequently asked questions about Soham South
What is the average price for a property for sale in Soham South?
The average price for a property for sale in Soham South is £287,727. This amount is 18% lower than the average price in Ely. There are 997 property listings for sale in Soham South.
What streets have the most expensive properties for sale in Soham South?
The streets with the most expensive properties for sale in Soham South are Stretham Road at an average of £670,000, The Oaks at an average of £565,000 and Adelaide Close at an average of £562,500.
What streets have the most affordable properties for sale in Soham South?
The streets with the most affordable properties for sale in Soham South are Staploe Mews at an average of £108,500, Cornwell Close at an average of £116,250 and Eastern Avenue at an average of £135,000.
Which train stations are available in or near Soham South?
Some of the train stations available in or near Soham South are Ely, Newmarket and Waterbeach.
Property Price Paid in Soham South by Year
The average sold property price by year was:
| Year | Average Sold Price | Price Change |
Sold Properties
|
|---|---|---|---|
| 2025 | £283,378 | -6% |
82 Properties |
| 2024 | £299,397 | 7% |
100 Properties |
| 2023 | £278,519 | -4% |
88 Properties |
| 2022 | £288,836 | 7% |
101 Properties |
| 2021 | £267,732 | -1% |
141 Properties |
| 2020 | £269,925 | -3% |
88 Properties |
| 2019 | £278,804 | 8% |
139 Properties |
| 2018 | £256,985 | 1% |
177 Properties |
| 2017 | £253,549 | 2% |
145 Properties |
| 2016 | £247,376 | 16% |
125 Properties |
| 2015 | £208,807 | 7% |
147 Properties |
| 2014 | £193,695 | 7% |
177 Properties |
| 2013 | £179,220 | 6% |
120 Properties |
| 2012 | £169,115 | -4% |
95 Properties |
| 2011 | £175,544 | -1% |
130 Properties |
| 2010 | £177,664 | 8% |
104 Properties |
| 2009 | £163,817 | -13% |
103 Properties |
| 2008 | £185,597 | 5% |
83 Properties |
| 2007 | £175,429 | 4% |
139 Properties |
| 2006 | £168,131 | 7% |
133 Properties |
| 2005 | £156,421 | -4% |
106 Properties |
| 2004 | £162,984 | 17% |
108 Properties |
| 2003 | £135,235 | 7% |
117 Properties |
| 2002 | £125,098 | 17% |
146 Properties |
| 2001 | £104,140 | 8% |
141 Properties |
| 2000 | £95,628 | 17% |
127 Properties |
| 1999 | £79,373 | 10% |
118 Properties |
| 1998 | £71,653 | 12% |
106 Properties |
| 1997 | £63,013 | 9% |
118 Properties |
| 1996 | £57,226 | 2% |
113 Properties |
| 1995 | £56,159 | - |
83 Properties |
Property Price per Property Type in Soham South
Here you can find historic sold price data in order to help with your property search.
The average Property Paid Price for specific property types in the last three years are:
| Property Type | Average Sold Price | Sold Properties |
|---|---|---|
| Flat | £162,350.00 | 30 Flats |
| Semi Detached House | £269,997.00 | 87 Semi Detached Houses |
| Detached House | £401,501.00 | 79 Detached Houses |
| Terraced House | £237,940.00 | 74 Terraced Houses |

