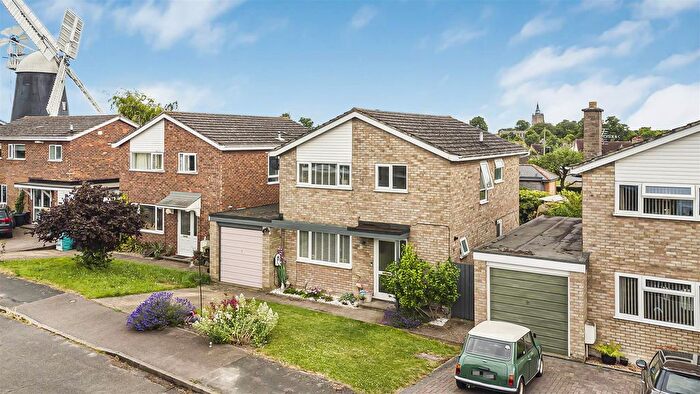
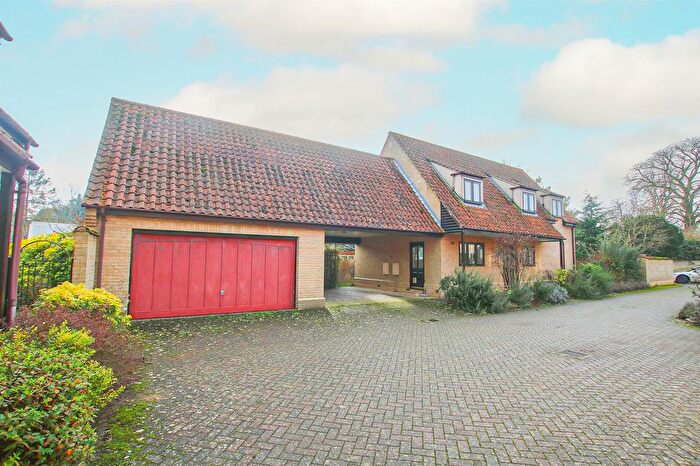
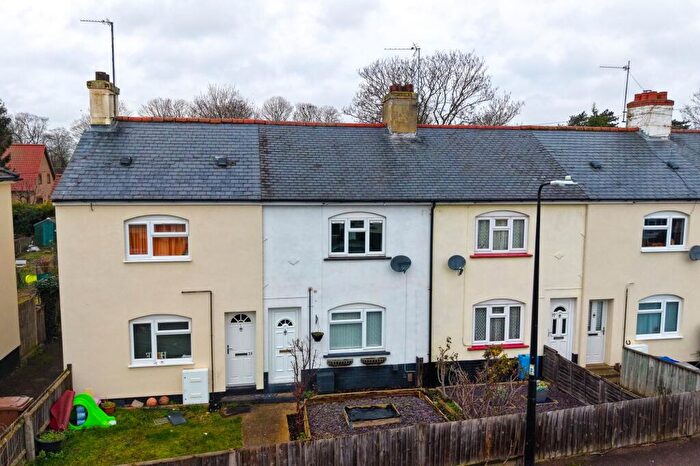
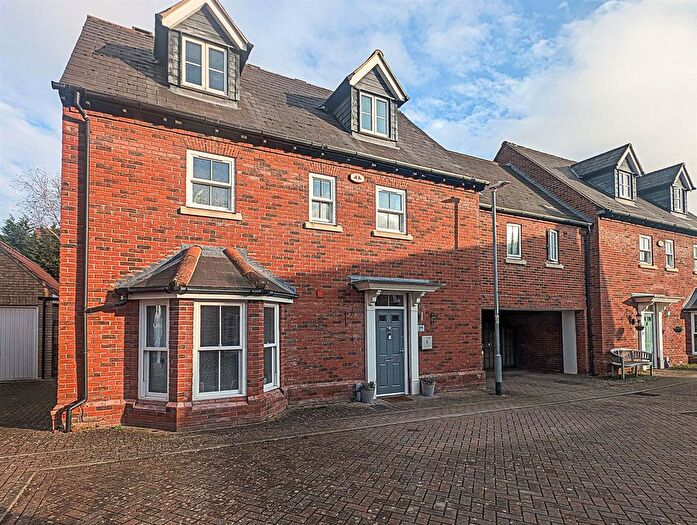
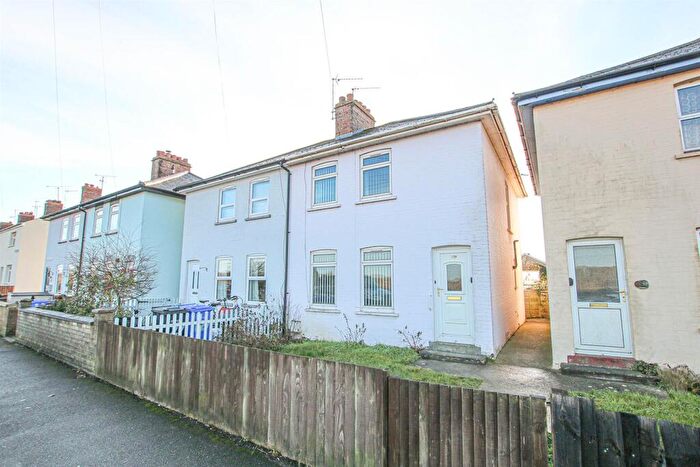
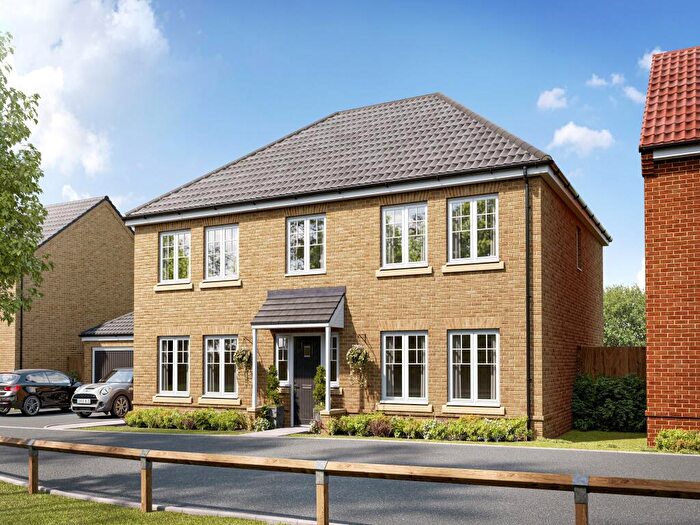
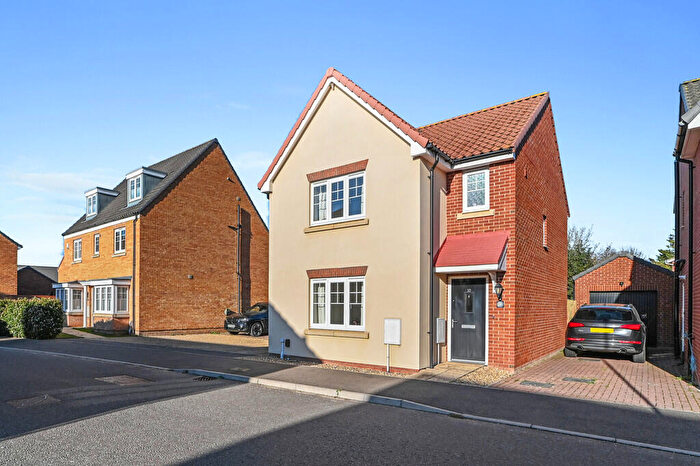
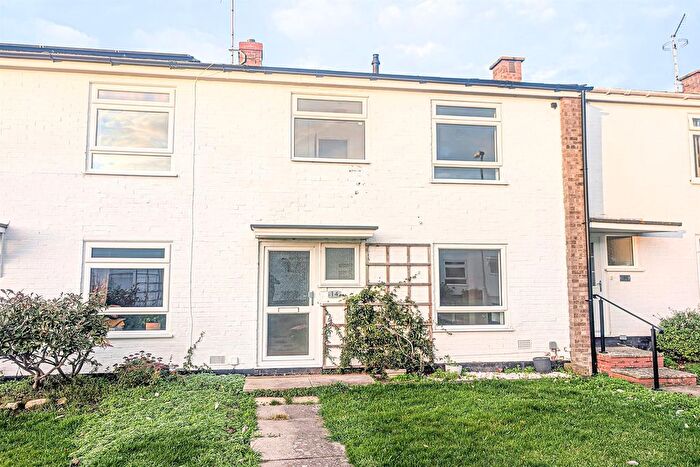
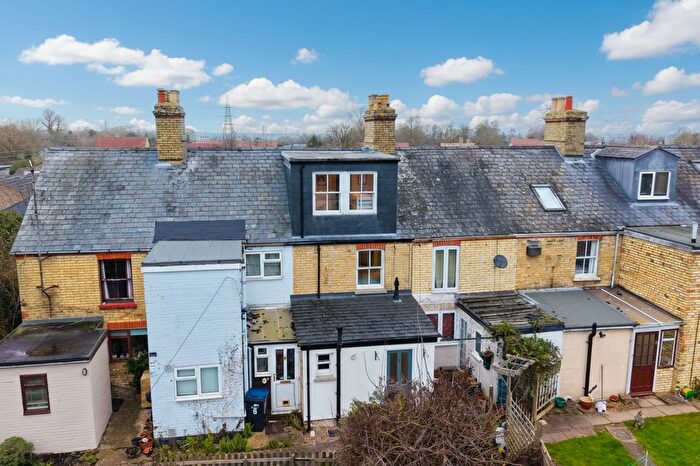
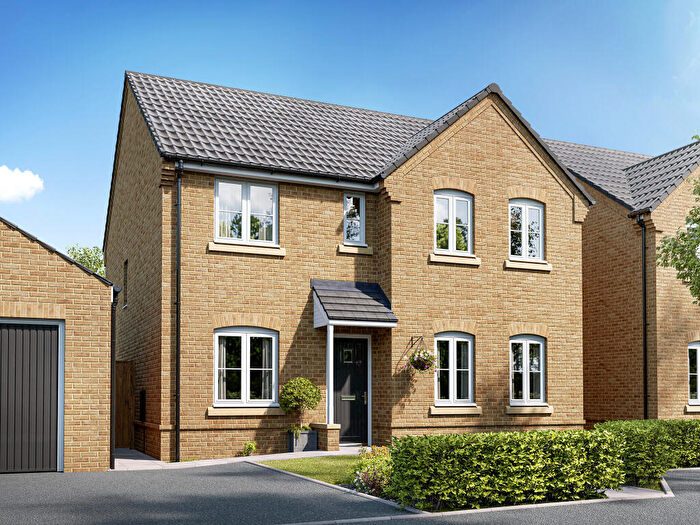
Houses for sale & to rent in Burwell, Cambridge
House Prices in Burwell
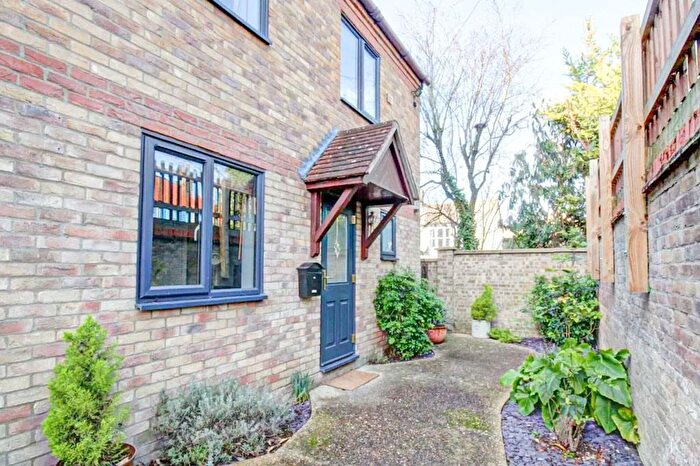
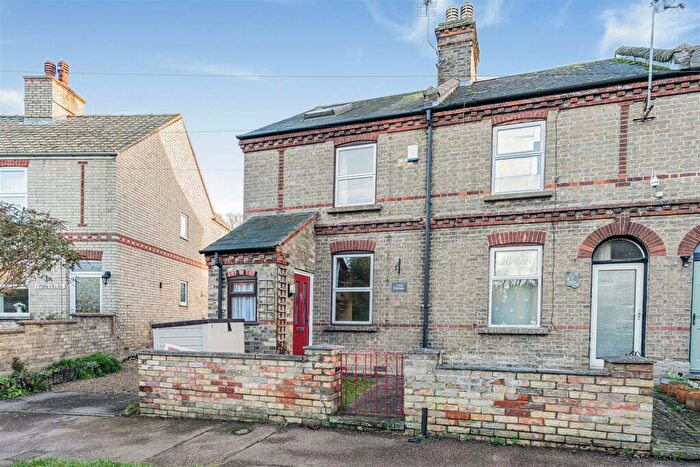
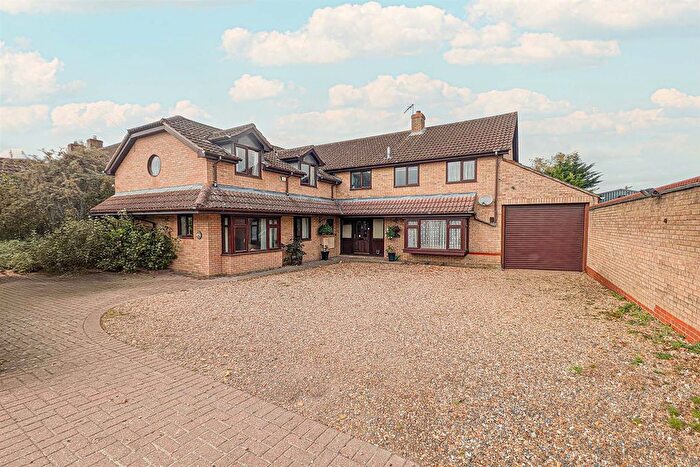
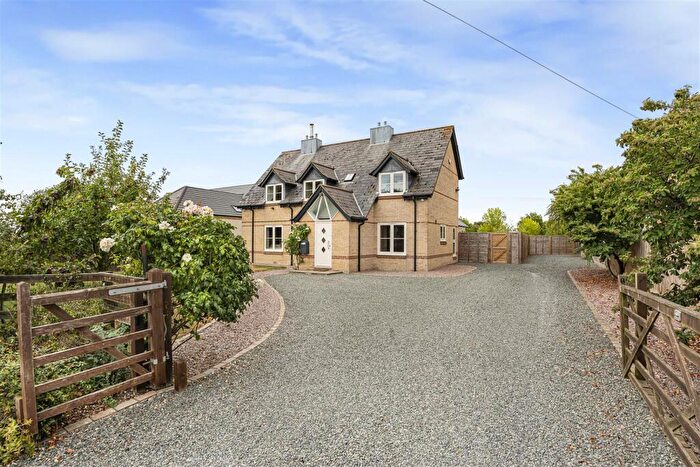
Properties in Burwell have an average house price of £388,976.00 and had 234 Property Transactions within the last 3 years¹.
Burwell is an area in Cambridge, Cambridgeshire with 2,631 households², where the most expensive property was sold for £1,250,000.00.
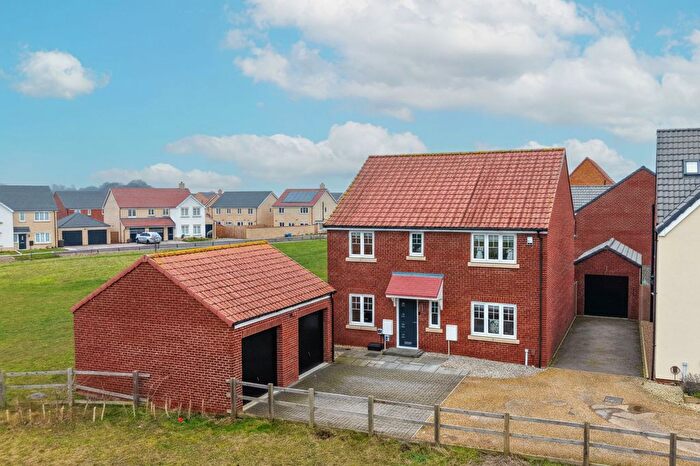
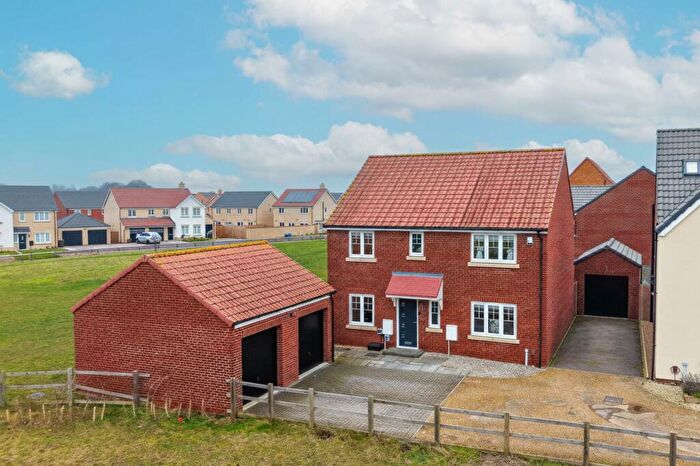
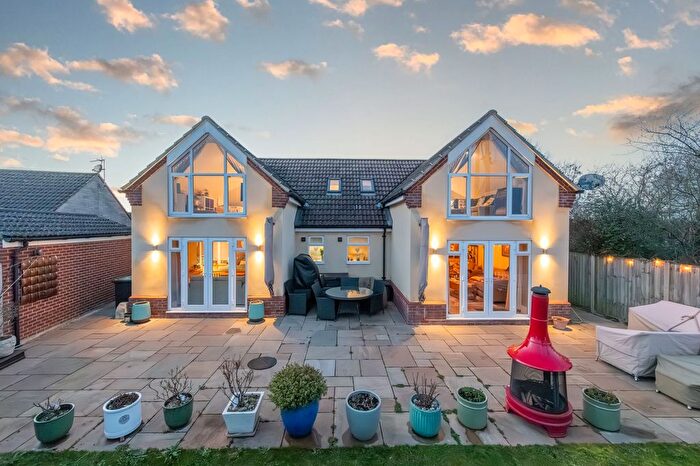
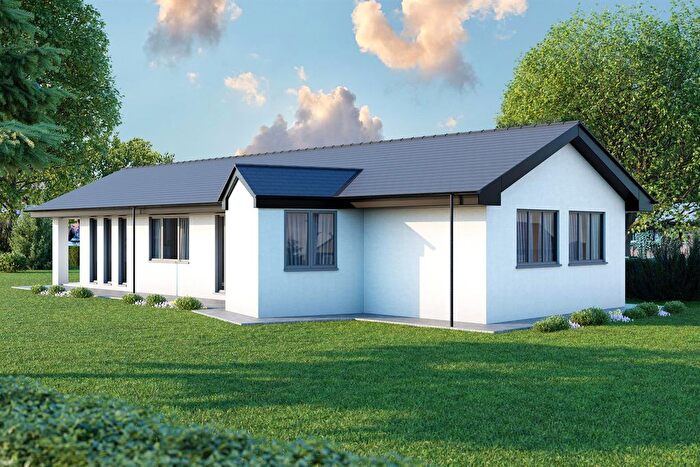
Properties for sale in Burwell
Roads and Postcodes in Burwell
Navigate through our locations to find the location of your next house in Burwell, Cambridge for sale or to rent.
| Streets | Postcodes |
|---|---|
| Abbey Close | CB25 0HN |
| Anchor Lane | CB25 0BD |
| Appletree Grove | CB25 0BF |
| Arbor Close | CB25 0FR |
| Ash Grove | CB25 0DR CB25 0DS |
| Baker Drive | CB25 0AB |
| Barkways | CB25 0RG |
| Bayfield Drive | CB25 0JE |
| Bewicks Mead | CB25 0LW |
| Bloomsfield | CB25 0RA |
| Blossom Close | CB25 0AU |
| Bolton Close | CB25 0EX |
| Broads Road | CB25 0BQ |
| Broads Road Business Park | CB25 0BT |
| Buntings Crescent | CB25 0EU |
| Buntings Path | CB25 0DD CB25 0EG |
| Burghley Rise | CB25 0RS |
| Burling Way | CB25 0FJ |
| Carter Road | CB25 0DN |
| Casburn Lane | CB25 0ED |
| Cedar Gardens | CB25 0FE |
| Chandlers Court | CB25 0AZ |
| Chestnut Rise | CB25 0BX |
| Church Lane | CB25 0AQ |
| Copperfield Way | CB25 0PA |
| Cornfields | CB25 0AX |
| Dalzells Lane | CB25 0GA |
| Dysons Drove | CB25 0BL |
| Ellis Gardens | CB25 0FL |
| Factory Road | CB25 0BN CB25 0BW |
| Felsham Chase | CB25 0JP |
| First Drove | CB25 0BH |
| Garden Court | CB25 0DH |
| Grantchester Rise | CB25 0BE |
| Green Lane | CB25 0RE |
| Guyatt Court | CB25 0DP |
| Hall Lane | CB25 0HE |
| Hatley Drive | CB25 0AY |
| Hawthorn Way | CB25 0DQ |
| Heath Road | CB25 0AP |
| High Street | CB25 0HB CB25 0HD |
| Holkham Mead | CB25 0JL |
| Hythe Close | CB25 0EZ |
| Hythe Lane | CB25 0EH |
| Isaacson Road | CB25 0AF |
| Kentwell Place | CB25 0RT |
| Kingfisher Drive | CB25 0BS |
| Laburnum Lane | CB25 0EB |
| Lime Close | CB25 0HH CB25 0JR |
| Low Road | CB25 0EJ |
| Lucas Close | CB25 0FN |
| Mandeville | CB25 0AG |
| Martin Road | CB25 0DL |
| Mason Road | CB25 0BG |
| Meadowlands | CB25 0HG |
| Melford Close | CB25 0JG |
| Mill Close | CB25 0HL |
| Mill Lane | CB25 0HJ |
| Montford Close | CB25 0RF |
| Murton Close | CB25 0DT |
| Myrtle Drive | CB25 0AJ |
| Ness Road | CB25 0AA CB25 0DA CB25 0DB |
| New Road | CB25 0BY |
| Newmarket Road | CB25 0AE CB25 0DY |
| Newnham Lane | CB25 0EA |
| North Street | CB25 0BA CB25 0BB |
| Old Lode Court | CB25 0FF |
| Old School Close | CB25 0AS |
| Old Stable Court | CB25 0FS |
| Orchard Way | CB25 0EQ |
| Pantile Lane | CB25 0EE |
| Park Road | CB25 0ES |
| Parsonage Close | CB25 0ER |
| Parsonage Lane | CB25 0EN |
| Poplars Close | CB25 0ET |
| Pound Close | CB25 0EP |
| Priory Close | CB25 0HW |
| Railway Close | CB25 0DW |
| Ravenward Drive | CB25 0AD |
| Reach Road | CB25 0AH CB25 0BU CB25 0GH |
| Roman Close | CB25 0RQ |
| Saxon Drive | CB25 0HR |
| School Lane | CB25 0HS |
| Scotred Close | CB25 0AL |
| Silver Street | CB25 0EF |
| Smiths Orchard | CB25 0FT |
| Spring Close | CB25 0HF |
| St Marys View | CB25 0FB |
| Station Gate | CB25 0BZ |
| Summerfield Close | CB25 0FD |
| Swaffham Road | CB25 0AN CB25 0AW |
| Tan House Lane | CB25 0AR |
| The Avenue | CB25 0DE |
| The Briars | CB25 0FP |
| The Causeway | CB25 0DU CB25 0HA |
| The Leys | CB25 0DZ |
| The Paddocks | CB25 0HQ |
| Toyse Close | CB25 0DG |
| Toyse Lane | CB25 0DF |
| Tunbridge Close | CB25 0EL |
| Waterside | CB25 0BJ |
| Weirs Drove | CB25 0BP CB25 0FX |
| Westhorpe | CB25 0DJ |
| Wild Acres | CB25 0EY |
| Woodside Meadows | CB25 0FU |
| CB25 0RD CB25 0UW CB25 0XA CB25 0UT CB25 0YY |
Transport near Burwell
-
Newmarket Station
-
Dullingham Station
-
Waterbeach Station
-
Kennett Station
-
Cambridge North Station
-
Ely Station
-
Cambridge Station
- FAQ
- Price Paid By Year
- Property Type Price
Frequently asked questions about Burwell
What is the average price for a property for sale in Burwell?
The average price for a property for sale in Burwell is £388,976. This amount is 24% lower than the average price in Cambridge. There are 533 property listings for sale in Burwell.
What streets have the most expensive properties for sale in Burwell?
The streets with the most expensive properties for sale in Burwell are Lime Close at an average of £805,000, Isaacson Road at an average of £755,000 and High Street at an average of £715,000.
What streets have the most affordable properties for sale in Burwell?
The streets with the most affordable properties for sale in Burwell are Ash Grove at an average of £110,642, Grantchester Rise at an average of £155,250 and Chandlers Court at an average of £187,500.
Which train stations are available in or near Burwell?
Some of the train stations available in or near Burwell are Newmarket, Dullingham and Waterbeach.
Property Price Paid in Burwell by Year
The average sold property price by year was:
| Year | Average Sold Price | Price Change |
Sold Properties
|
|---|---|---|---|
| 2025 | £396,039 | 8% |
76 Properties |
| 2024 | £365,528 | -13% |
89 Properties |
| 2023 | £411,441 | -1% |
69 Properties |
| 2022 | £413,818 | 8% |
112 Properties |
| 2021 | £379,675 | 7% |
133 Properties |
| 2020 | £353,096 | -0,4% |
97 Properties |
| 2019 | £354,418 | 7% |
95 Properties |
| 2018 | £329,634 | 1% |
138 Properties |
| 2017 | £326,439 | 2% |
125 Properties |
| 2016 | £318,790 | 17% |
112 Properties |
| 2015 | £264,900 | 6% |
120 Properties |
| 2014 | £248,293 | -5% |
125 Properties |
| 2013 | £260,781 | 11% |
116 Properties |
| 2012 | £231,969 | -5% |
108 Properties |
| 2011 | £244,139 | 4% |
125 Properties |
| 2010 | £234,662 | 6% |
105 Properties |
| 2009 | £220,646 | -1% |
105 Properties |
| 2008 | £222,905 | 2% |
98 Properties |
| 2007 | £218,180 | -3% |
159 Properties |
| 2006 | £224,406 | 8% |
172 Properties |
| 2005 | £207,135 | 9% |
190 Properties |
| 2004 | £188,229 | 8% |
197 Properties |
| 2003 | £173,539 | 6% |
205 Properties |
| 2002 | £163,794 | 16% |
159 Properties |
| 2001 | £137,395 | 8% |
187 Properties |
| 2000 | £125,848 | 15% |
178 Properties |
| 1999 | £106,989 | 11% |
136 Properties |
| 1998 | £95,641 | 15% |
165 Properties |
| 1997 | £80,983 | 15% |
177 Properties |
| 1996 | £68,559 | -2% |
217 Properties |
| 1995 | £70,220 | - |
128 Properties |
Property Price per Property Type in Burwell
Here you can find historic sold price data in order to help with your property search.
The average Property Paid Price for specific property types in the last three years are:
| Property Type | Average Sold Price | Sold Properties |
|---|---|---|
| Semi Detached House | £324,096.00 | 52 Semi Detached Houses |
| Detached House | £507,747.00 | 117 Detached Houses |
| Terraced House | £273,260.00 | 46 Terraced Houses |
| Flat | £115,315.00 | 19 Flats |

