
Houses for sale & to rent in PE15 8JA, Robingoodfellows Lane, March North, March
House Prices in PE15 8JA, Robingoodfellows Lane, March North
Properties in PE15 8JA have no sales history available within the last 3 years. PE15 8JA is a postcode in Robingoodfellows Lane located in March North, an area in March, Cambridgeshire, with 6 households².
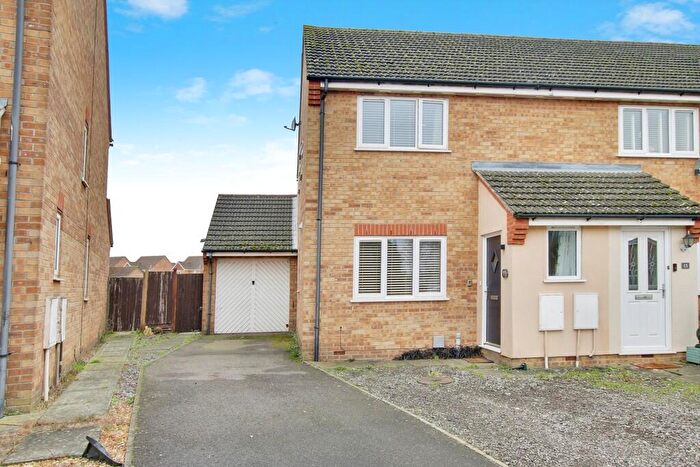
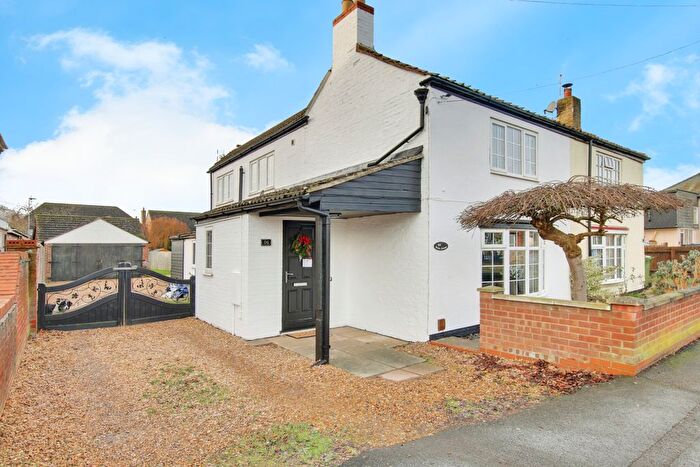
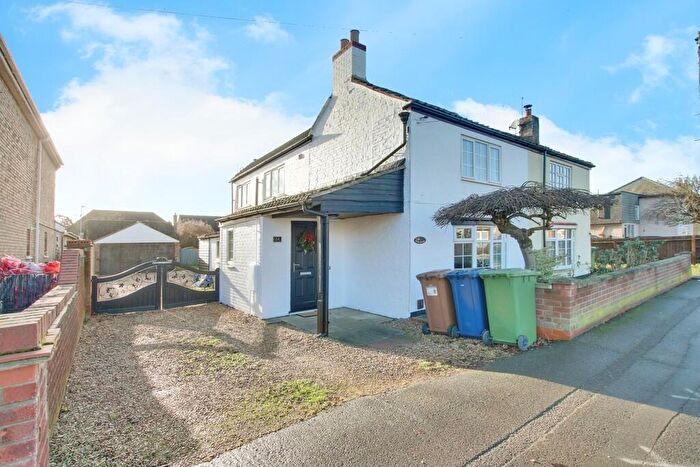
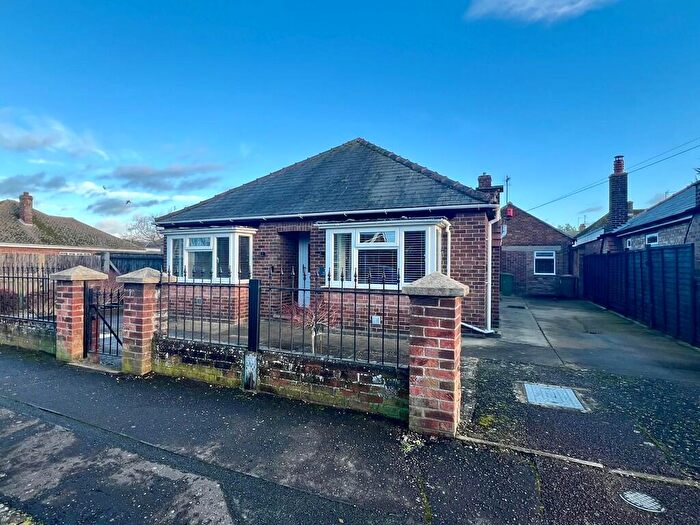
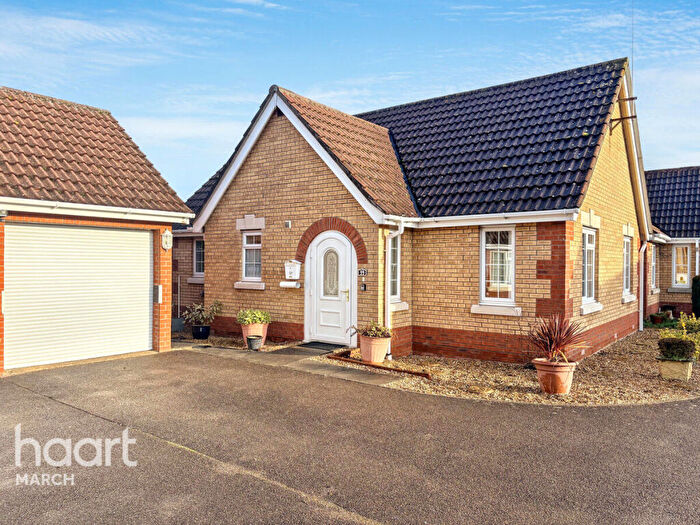
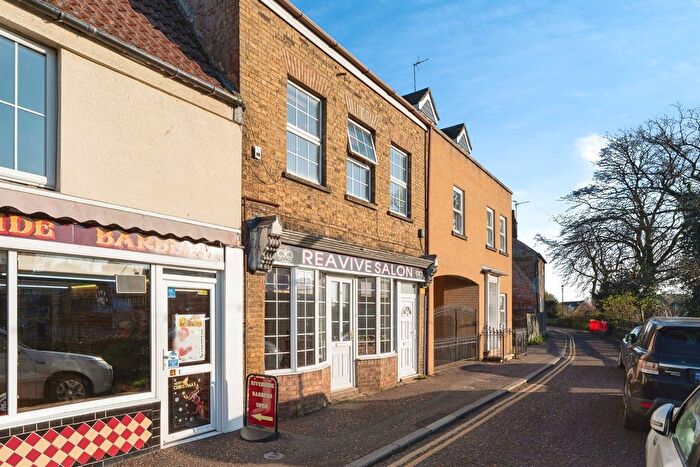
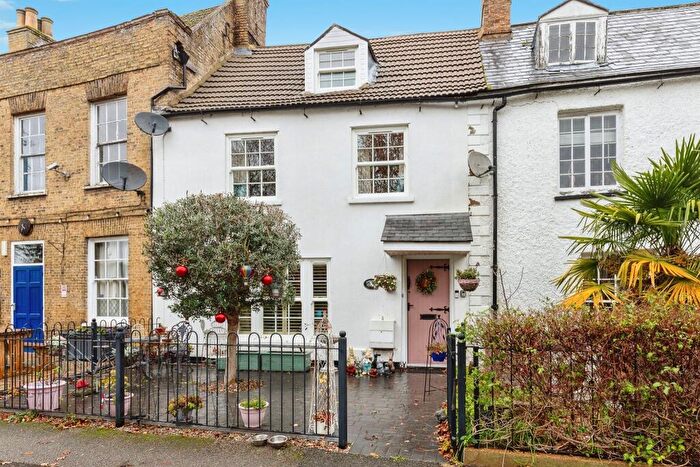
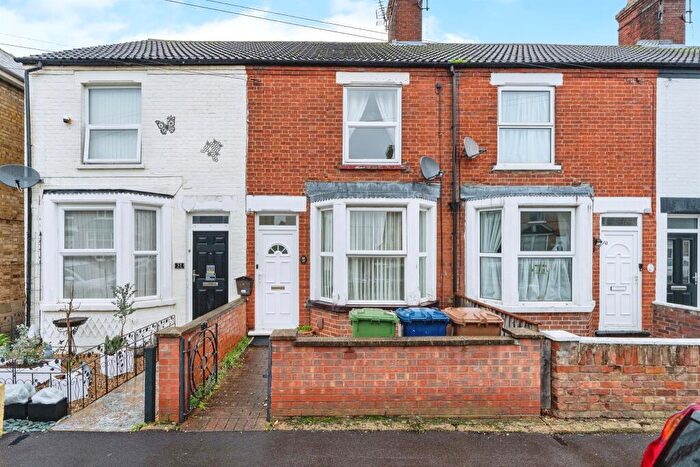
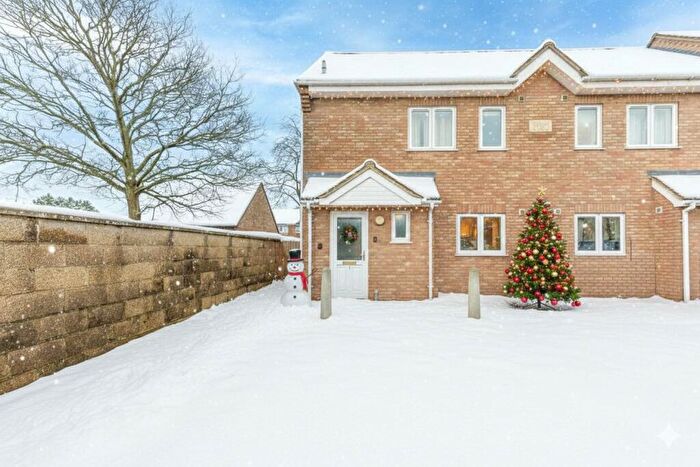
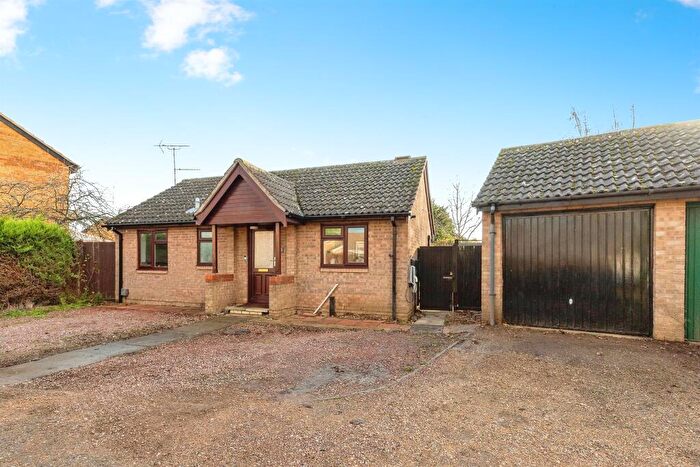
Properties for sale near PE15 8JA, Robingoodfellows Lane

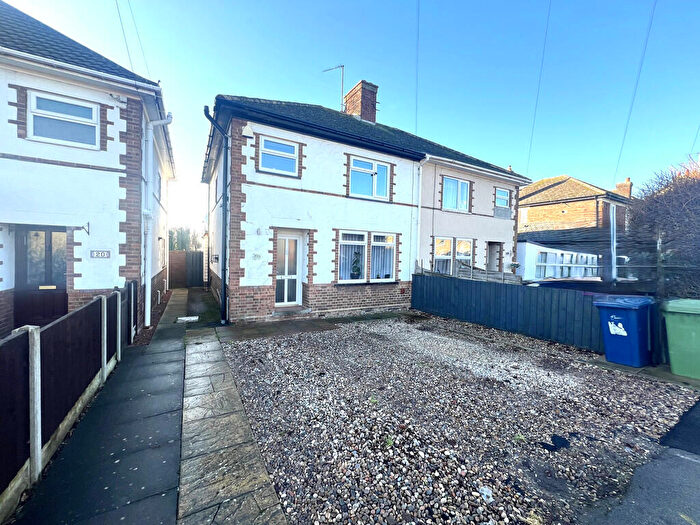
![]()
If you are looking to sell your house, let it out, or receive a property valuation, an expert can help you.
Click the button below to get started.


Price Paid in Robingoodfellows Lane, PE15 8JA, March North
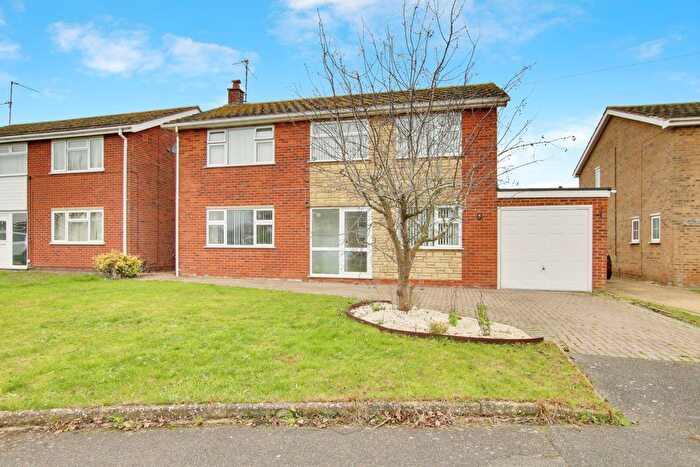
29 Robingoodfellows Lane, PE15 8JA, March North March
Property 29 has been sold 2 times. The last time it was sold was in 08/03/2021 and the sold price was £355,000.00.
This detached house, sold as a freehold on 08/03/2021, is a 160 sqm detached house with an EPC rating of E.
| Date | Price | Property Type | Tenure | Classification |
|---|---|---|---|---|
| 08/03/2021 | £355,000.00 | Detached House | freehold | Established Building |
| 07/05/1999 | £85,000.00 | Detached House | freehold | Established Building |
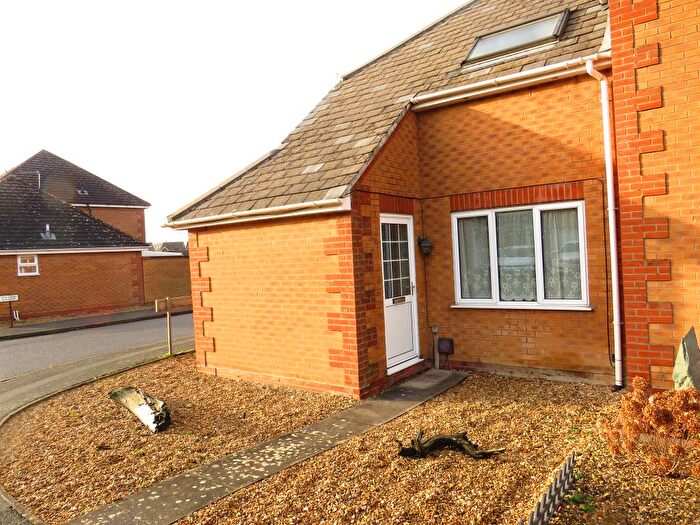
28B Robingoodfellows Lane, PE15 8JA, March North March
Property 28B has been sold 3 times. The last time it was sold was in 30/05/2014 and the sold price was £135,000.00.
This detached house, sold as a freehold on 30/05/2014, is a 94 sqm detached house with an EPC rating of F.
| Date | Price | Property Type | Tenure | Classification |
|---|---|---|---|---|
| 30/05/2014 | £135,000.00 | Detached House | freehold | Established Building |
| 18/12/2009 | £130,000.00 | Detached House | freehold | Established Building |
| 23/09/2005 | £120,000.00 | Detached House | freehold | Established Building |
Postcodes in Robingoodfellows Lane, March North
Navigate through other locations in Robingoodfellows Lane, March North, March to see more property listings for sale or to rent.
Transport near PE15 8JA, Robingoodfellows Lane

House price paid reports for PE15 8JA, Robingoodfellows Lane
Click on the buttons below to see price paid reports by year or property price:
- Price Paid By Year
Property Price Paid in PE15 8JA, Robingoodfellows Lane by Year
The average sold property price by year was:
| Year | Average Sold Price | Price Change |
Sold Properties
|
|---|---|---|---|
| 2021 | £355,000 | 62% |
1 Property |
| 2014 | £135,000 | 4% |
1 Property |
| 2009 | £130,000 | 8% |
1 Property |
| 2005 | £120,000 | 29% |
1 Property |
| 1999 | £85,000 | - |
1 Property |