
Properties for sale in PE
Peterborough
- Info
- Price Paid By Year
- Property Type Price
House Prices in PE
Properties in PE have an average house price of £278,894 and had 39307 Property Transactions within the last 3 years.
The most expensive property was sold for £11,821,327.
Property Price Paid in PE by Year
The average sold property price by year was:
| Year | Average Sold Price | Sold Properties |
|---|---|---|
| 2026 | £278,857.00 | 956 Properties |
| 2025 | £280,080.00 | 12,770 Properties |
| 2024 | £279,976.00 | 13,424 Properties |
| 2023 | £276,455.00 | 12,157 Properties |
| 2022 | £284,265.00 | 16,079 Properties |
| 2021 | £268,012.00 | 21,143 Properties |
| 2020 | £251,006.00 | 14,515 Properties |
| 2019 | £237,840.00 | 17,201 Properties |
| 2018 | £230,141.00 | 17,474 Properties |
| 2017 | £222,188.00 | 18,158 Properties |
| 2016 | £207,893.00 | 18,656 Properties |
| 2015 | £193,917.00 | 17,970 Properties |
| 2014 | £186,413.00 | 18,210 Properties |
| 2013 | £176,177.00 | 14,931 Properties |
| 2012 | £171,673.00 | 12,016 Properties |
| 2011 | £170,517.00 | 12,225 Properties |
| 2010 | £174,655.00 | 11,457 Properties |
| 2009 | £164,001.00 | 11,473 Properties |
| 2008 | £172,930.00 | 11,475 Properties |
| 2007 | £177,248.00 | 22,723 Properties |
| 2006 | £166,837.00 | 23,889 Properties |
| 2005 | £159,452.00 | 18,786 Properties |
| 2004 | £149,336.00 | 22,536 Properties |
| 2003 | £131,934.00 | 22,437 Properties |
| 2002 | £109,745.00 | 25,554 Properties |
| 2001 | £90,383.00 | 23,410 Properties |
| 2000 | £78,897.00 | 21,141 Properties |
| 1999 | £71,095.00 | 22,569 Properties |
| 1998 | £65,424.00 | 19,379 Properties |
| 1997 | £59,632.00 | 19,441 Properties |
| 1996 | £55,864.00 | 17,109 Properties |
| 1995 | £54,658.00 | 13,998 Properties |
Property Price per Property Type in PE
Here you can find historic sold price data in order to help with your property search.
The average Property Paid Price for specific property types in the last three years are:
| Property Type | Average Sold Price | Sold Properties |
|---|---|---|
| Semi Detached House | £241,336.00 | 11,234 Semi Detached Houses |
| Terraced House | £206,844.00 | 8,703 Terraced Houses |
| Detached House | £365,004.00 | 16,619 Detached Houses |
| Flat | £140,002.00 | 2,751 Flats |
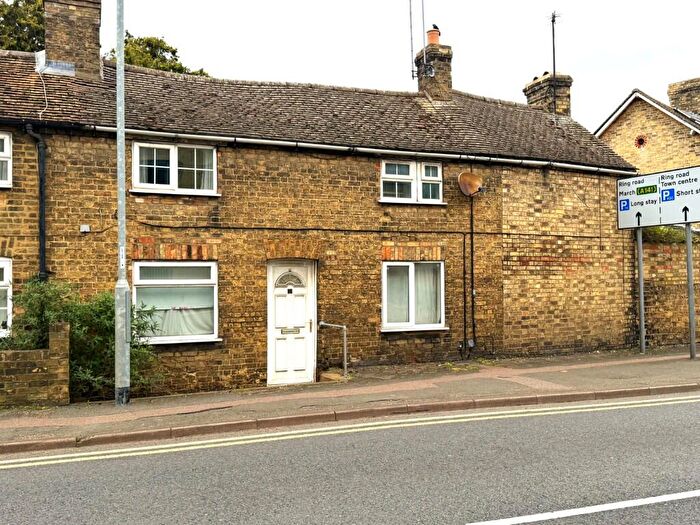
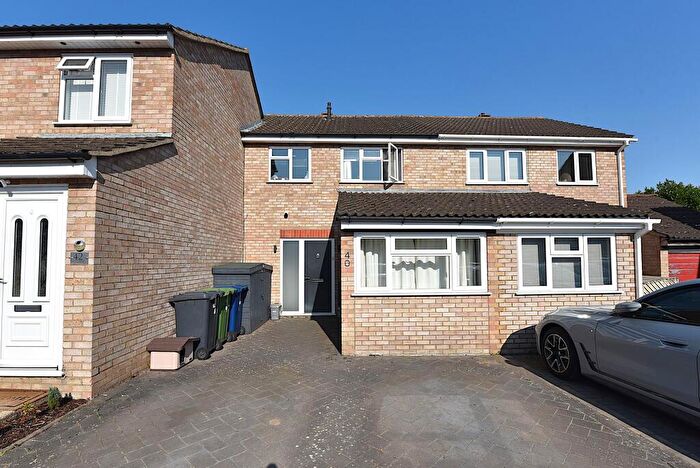
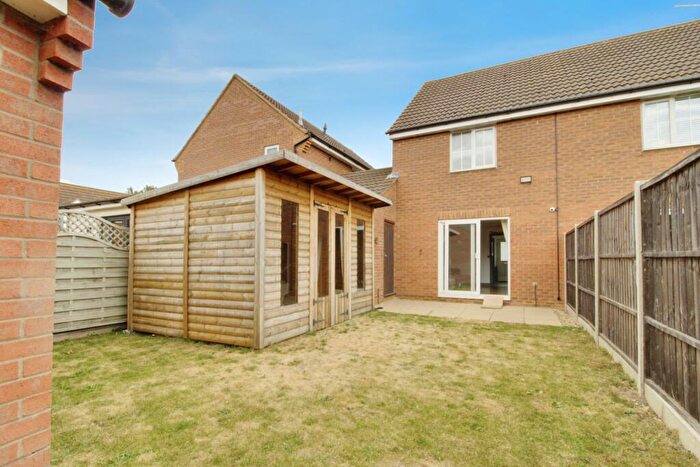
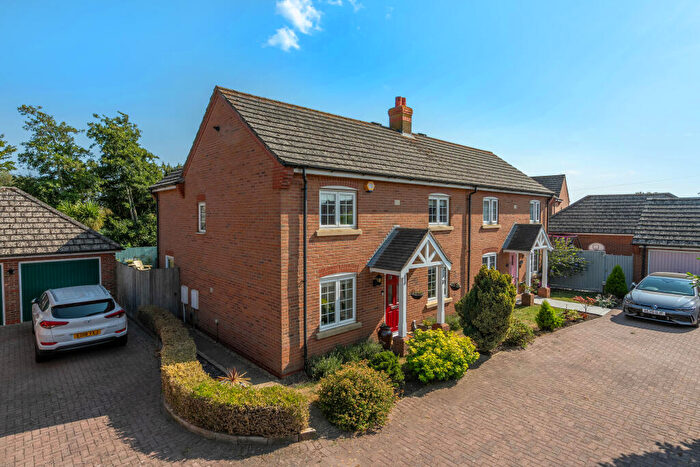
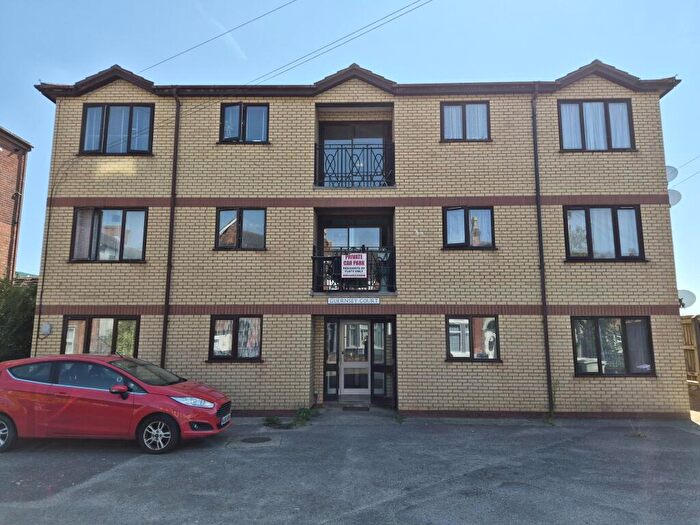
Houses and Flats for sale in PE, Peterborough
There are over 10,000 results. Property prices in PE range from £12k to £10M with an average price of £329k.
![]()
If you are looking to sell your house, let it out, or receive a property valuation, an expert can help you.
Click the button below to get started.

Postcode districts in PE, Peterborough
Navigate through our locations to find the location of your next house in PE, Peterborough, England for sale or to rent.
Transport in PE, Peterborough
Please see below transportation links in this area:

Frequently asked questions about PE
What is the average price for a property for sale in PE?
The average price for a property for sale in PE is £278,894. This amount is 22% lower than the average price in England. There are more than 10,000 property listings for sale in PE.
What locations have the most expensive properties for sale in PE?
The locations with the most expensive properties for sale in PE are PE5 at an average of £585,826, PE8 at an average of £426,320 and PE9 at an average of £411,608.
What locations have the most affordable properties for sale in PE?
The locations with the most affordable properties for sale in PE are PE21 at an average of £186,927, PE25 at an average of £188,973 and PE1 at an average of £203,941.
Which train stations are available in or near PE?
Some of the train stations available in or near PE are March, Whittlesea and Spalding.