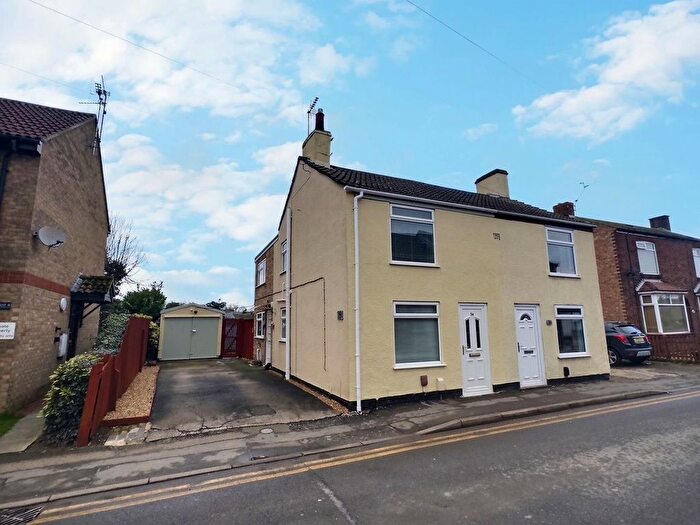
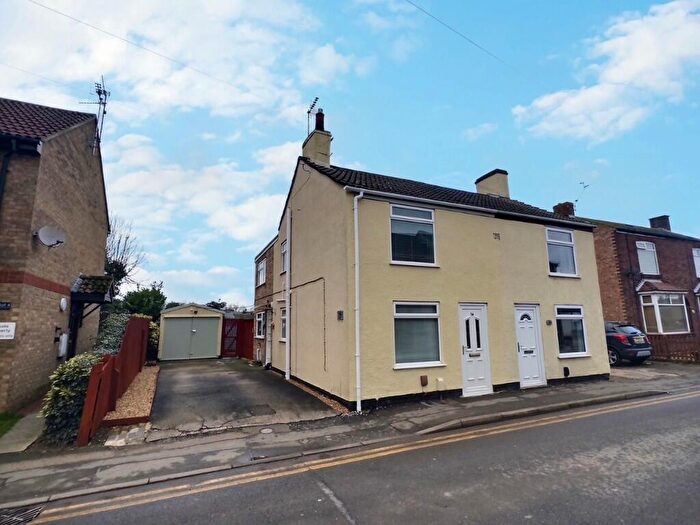
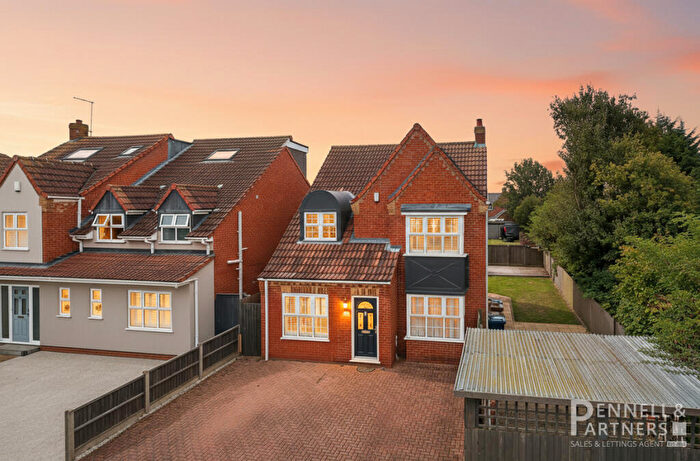
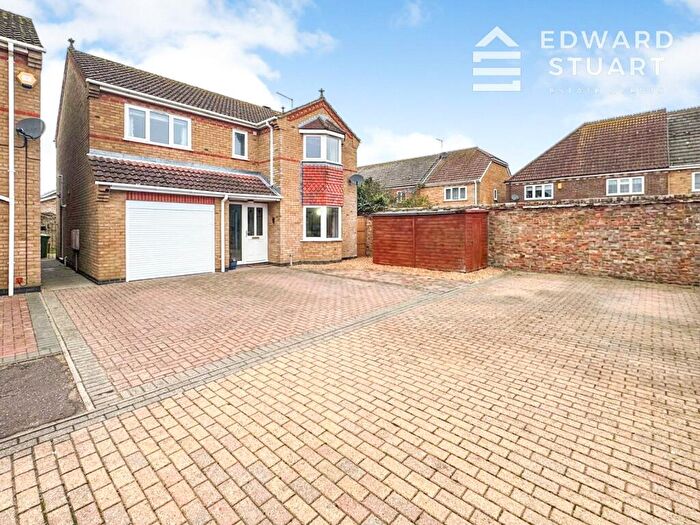
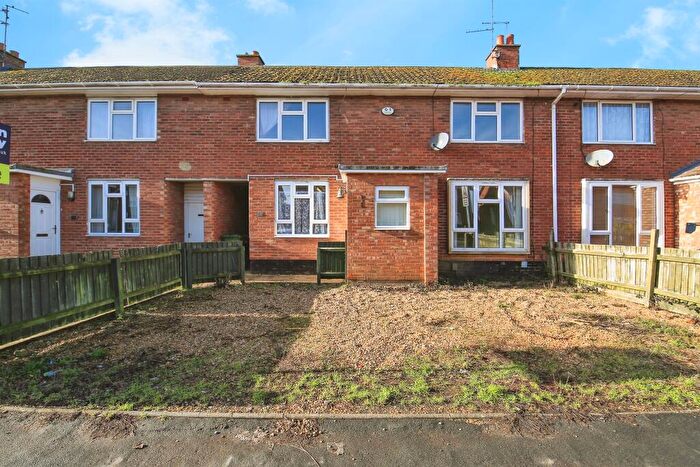
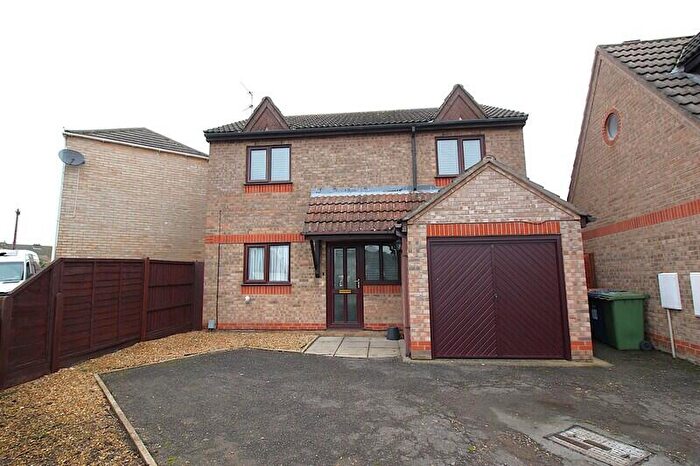
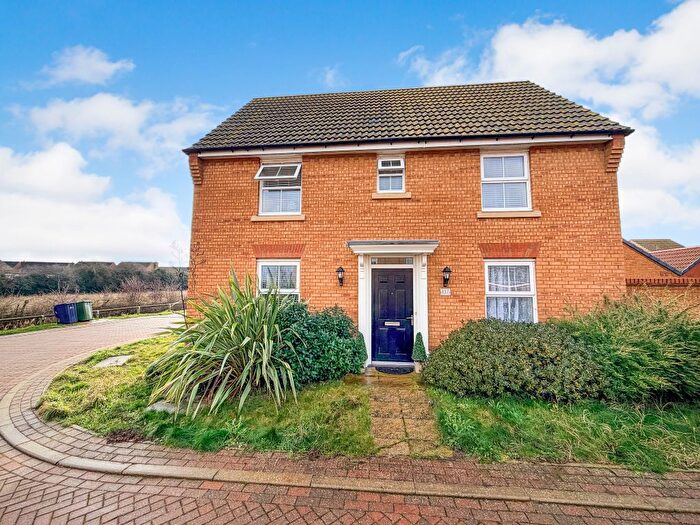
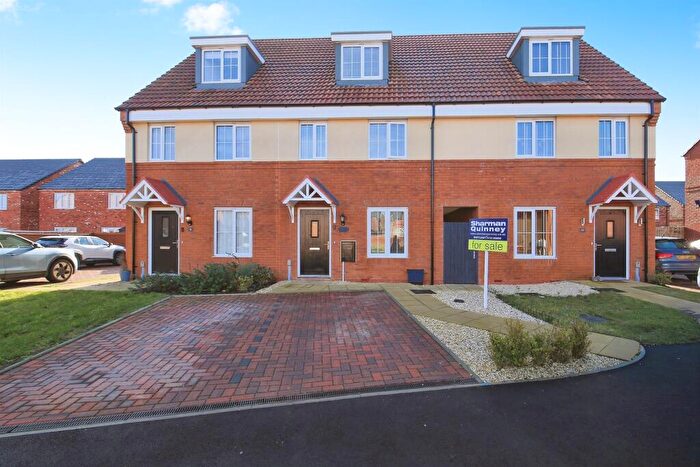
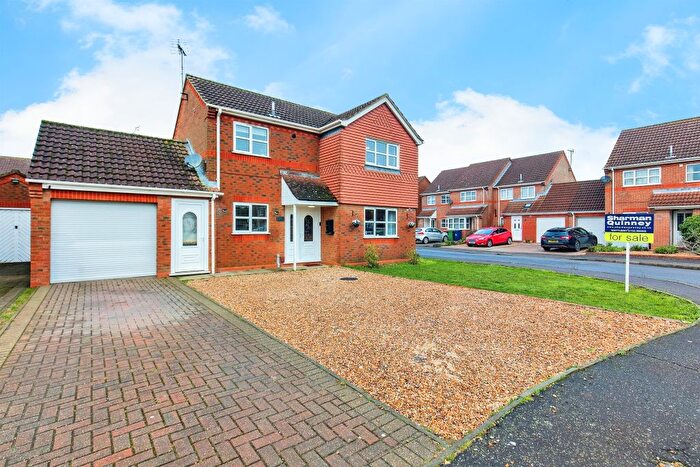
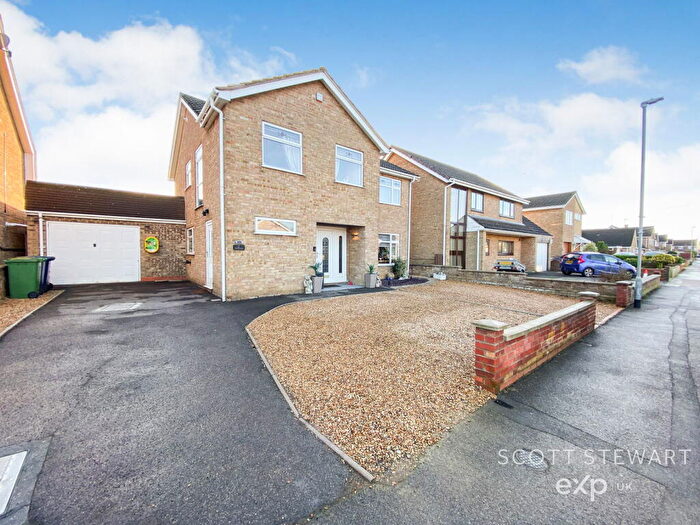
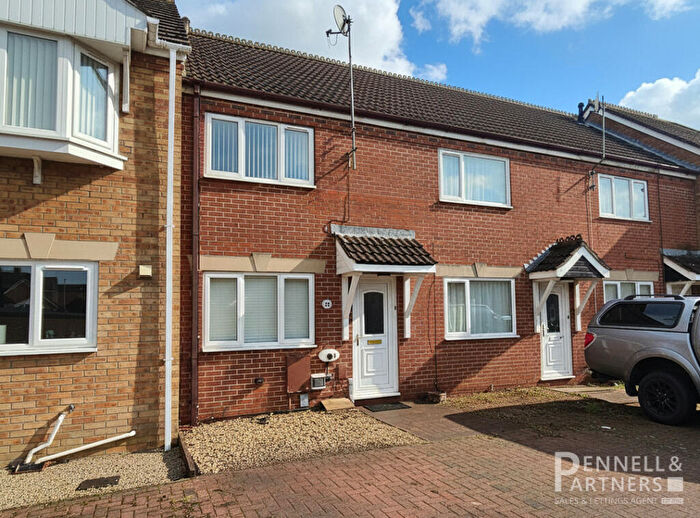
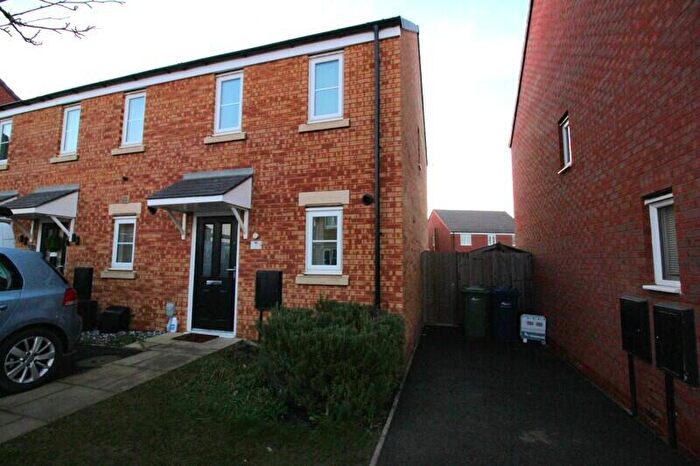
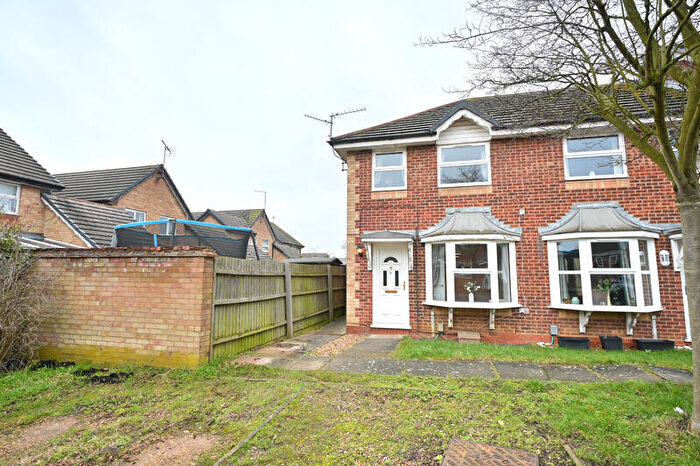
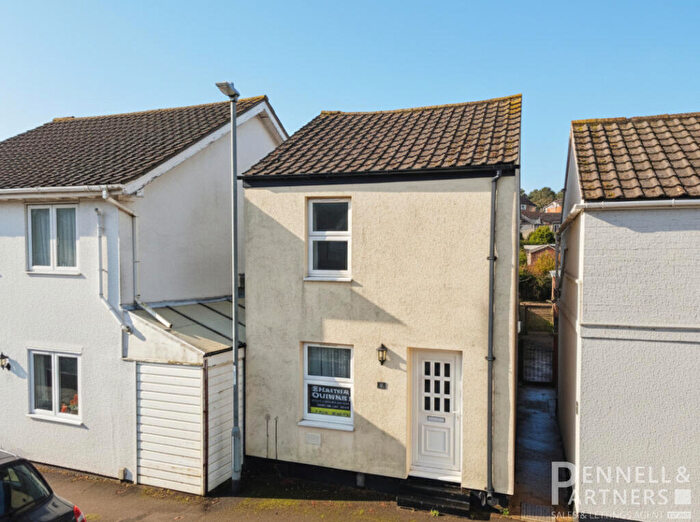
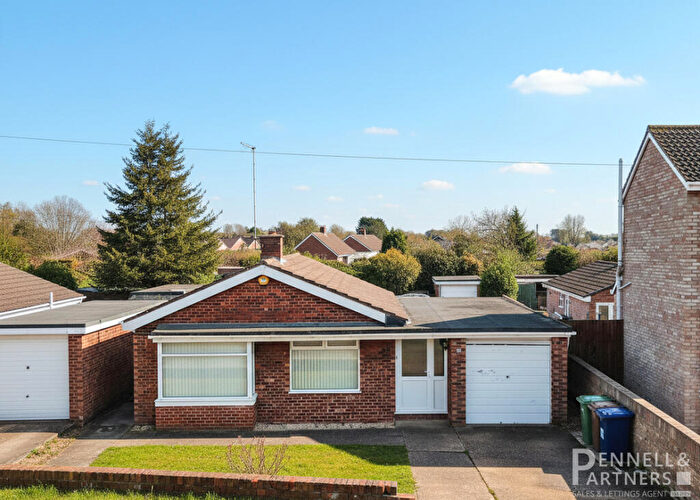
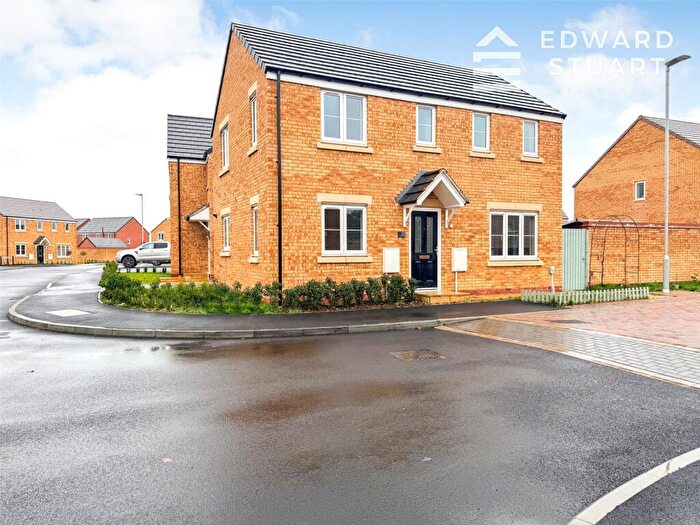
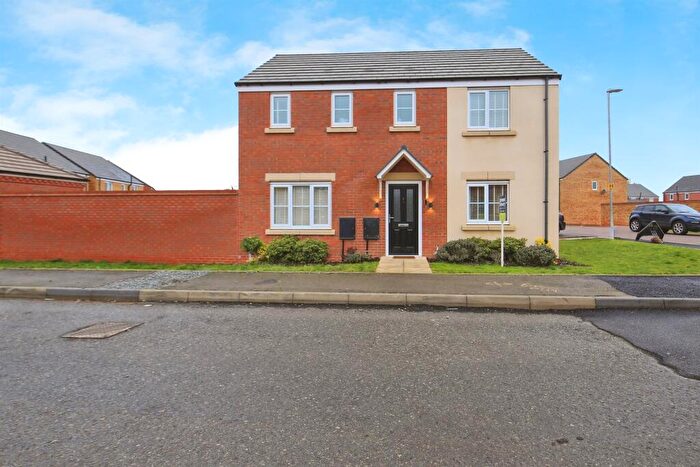
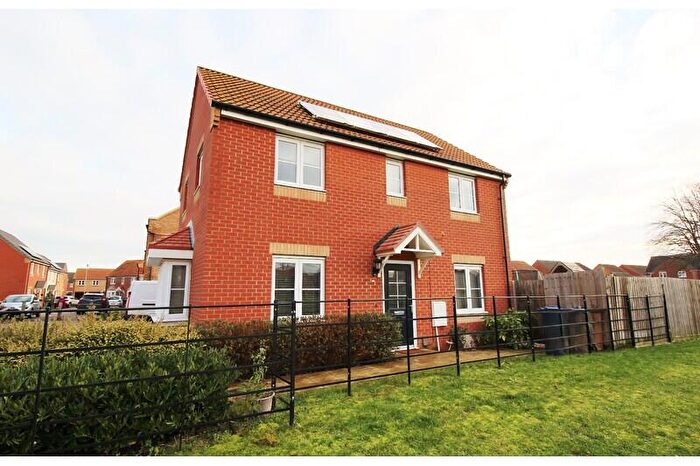
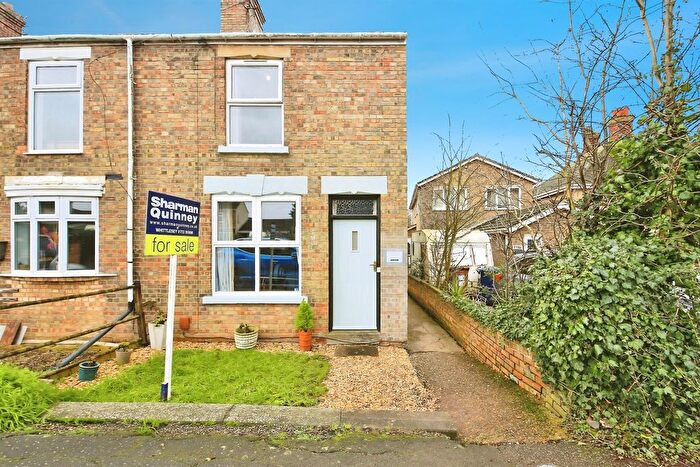
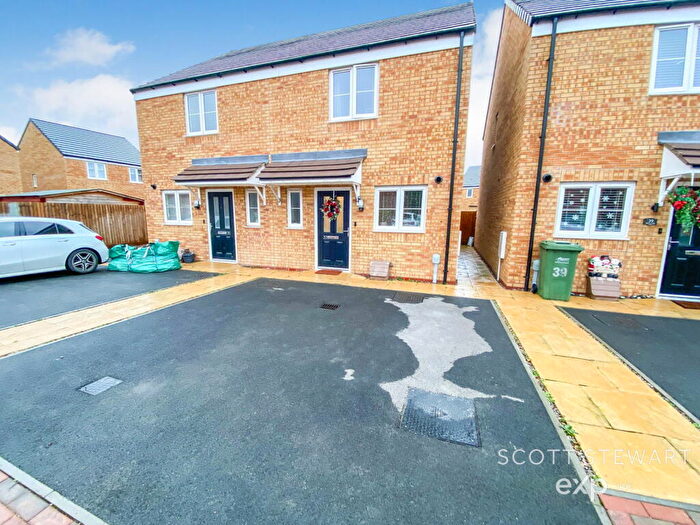
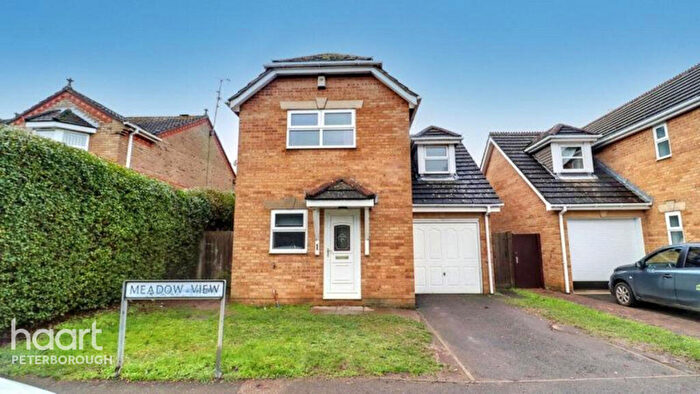
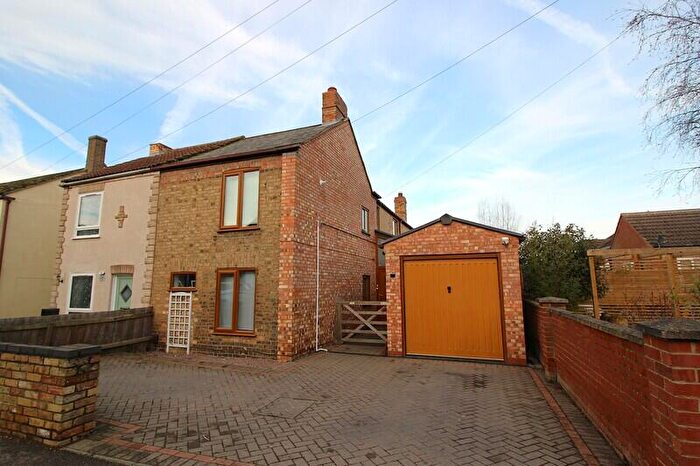
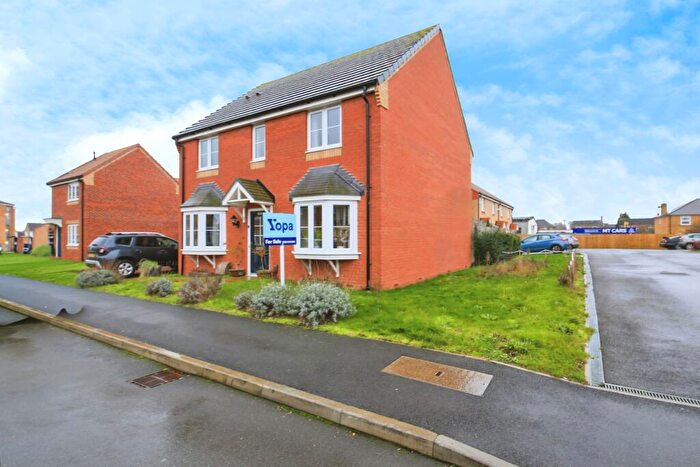
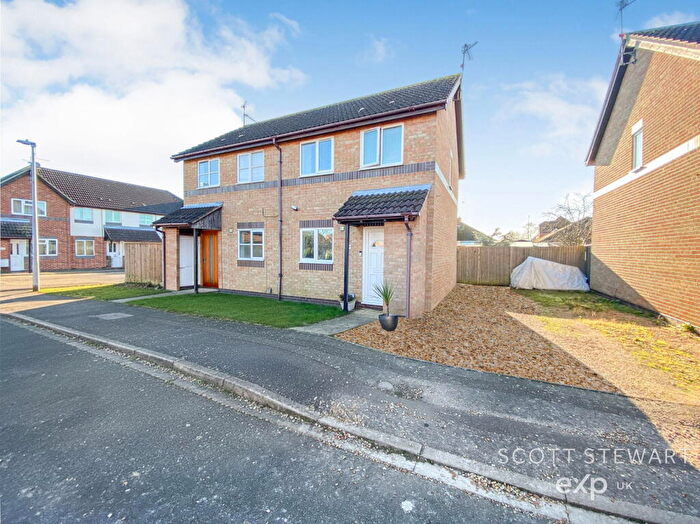
Houses for sale & to rent in Kingsmoor, Peterborough
House Prices in Kingsmoor
Properties in Kingsmoor have an average house price of £219,619.00 and had 73 Property Transactions within the last 3 years¹.
Kingsmoor is an area in Peterborough, Cambridgeshire with 676 households², where the most expensive property was sold for £410,000.00.
Properties for sale in Kingsmoor
Roads and Postcodes in Kingsmoor
Navigate through our locations to find the location of your next house in Kingsmoor, Peterborough for sale or to rent.
| Streets | Postcodes |
|---|---|
| Bassenhally Road | PE7 1RR |
| Cemetery Road | PE7 1ET PE7 1RT |
| Coronation Avenue | PE7 1XD PE7 1XE |
| Crescent Close | PE7 1YB |
| Crescent Road | PE7 1XY PE7 1XZ |
| Drybread Road | PE7 1XL |
| Eastrea Road | PE7 1SG PE7 2AP |
| Elm Park | PE7 1EW |
| Feldale Place | PE7 1XN PE7 1YA |
| Guildenburgh Crescent | PE7 1TZ |
| James Gardens | PE7 1EN |
| Ladysmith Avenue | PE7 1XX |
| Lattersey Close | PE7 1SQ |
| Moretons Close | PE7 1XP |
| Richardson Way | PE7 1RS |
| Roman Close | PE7 1XW |
| The Paddocks | PE7 1PL |
| Victory Avenue | PE7 1XT PE7 1XU |
Transport near Kingsmoor
- FAQ
- Price Paid By Year
- Property Type Price
Frequently asked questions about Kingsmoor
What is the average price for a property for sale in Kingsmoor?
The average price for a property for sale in Kingsmoor is £219,619. This amount is 20% lower than the average price in Peterborough. There are 895 property listings for sale in Kingsmoor.
What streets have the most expensive properties for sale in Kingsmoor?
The streets with the most expensive properties for sale in Kingsmoor are Bassenhally Road at an average of £277,500, Moretons Close at an average of £253,000 and Elm Park at an average of £250,875.
What streets have the most affordable properties for sale in Kingsmoor?
The streets with the most affordable properties for sale in Kingsmoor are Coronation Avenue at an average of £183,350, Victory Avenue at an average of £196,742 and Feldale Place at an average of £211,888.
Which train stations are available in or near Kingsmoor?
Some of the train stations available in or near Kingsmoor are Whittlesea, Peterborough and March.
Property Price Paid in Kingsmoor by Year
The average sold property price by year was:
| Year | Average Sold Price | Price Change |
Sold Properties
|
|---|---|---|---|
| 2025 | £222,292 | -1% |
22 Properties |
| 2024 | £225,250 | 8% |
31 Properties |
| 2023 | £207,950 | -6% |
20 Properties |
| 2022 | £220,633 | 14% |
22 Properties |
| 2021 | £188,716 | 6% |
27 Properties |
| 2020 | £178,029 | 1% |
17 Properties |
| 2019 | £175,392 | -7% |
28 Properties |
| 2018 | £186,950 | 20% |
18 Properties |
| 2017 | £149,818 | -0,2% |
24 Properties |
| 2016 | £150,124 | -2% |
24 Properties |
| 2015 | £153,156 | 15% |
16 Properties |
| 2014 | £129,977 | -14% |
22 Properties |
| 2013 | £148,413 | 21% |
22 Properties |
| 2012 | £117,986 | 9% |
18 Properties |
| 2011 | £107,854 | -32% |
14 Properties |
| 2010 | £142,200 | 23% |
15 Properties |
| 2009 | £110,117 | -14% |
17 Properties |
| 2008 | £126,068 | -7% |
18 Properties |
| 2007 | £134,695 | 7% |
40 Properties |
| 2006 | £125,025 | 2% |
39 Properties |
| 2005 | £122,068 | -4% |
21 Properties |
| 2004 | £126,443 | 14% |
28 Properties |
| 2003 | £108,356 | 20% |
35 Properties |
| 2002 | £86,830 | 20% |
38 Properties |
| 2001 | £69,787 | 7% |
36 Properties |
| 2000 | £64,689 | 2% |
38 Properties |
| 1999 | £63,364 | 5% |
37 Properties |
| 1998 | £60,201 | 27% |
52 Properties |
| 1997 | £43,877 | -13% |
22 Properties |
| 1996 | £49,650 | 17% |
20 Properties |
| 1995 | £41,413 | - |
20 Properties |
Property Price per Property Type in Kingsmoor
Here you can find historic sold price data in order to help with your property search.
The average Property Paid Price for specific property types in the last three years are:
| Property Type | Average Sold Price | Sold Properties |
|---|---|---|
| Semi Detached House | £221,437.00 | 41 Semi Detached Houses |
| Terraced House | £197,910.00 | 14 Terraced Houses |
| Flat | £100,000.00 | 2 Flats |
| Detached House | £248,906.00 | 16 Detached Houses |

