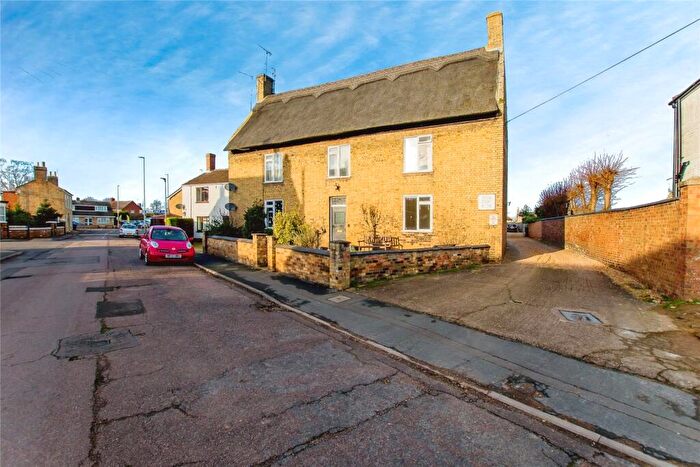
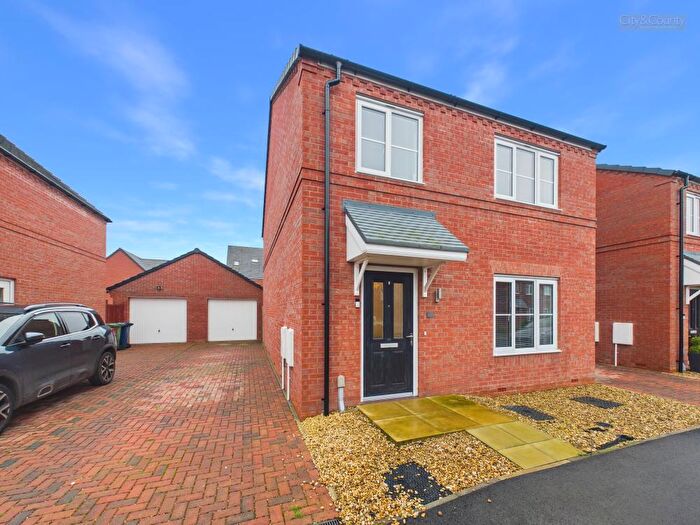
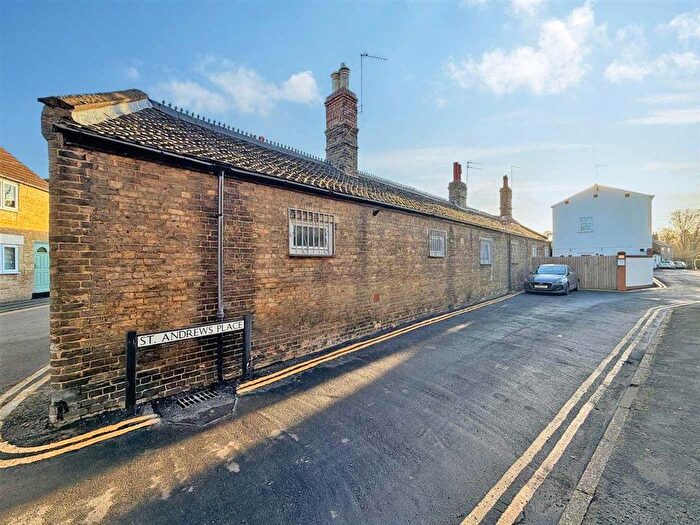
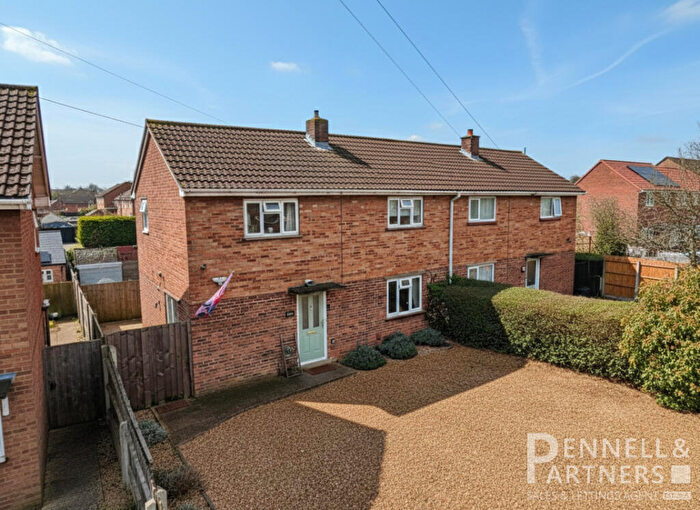
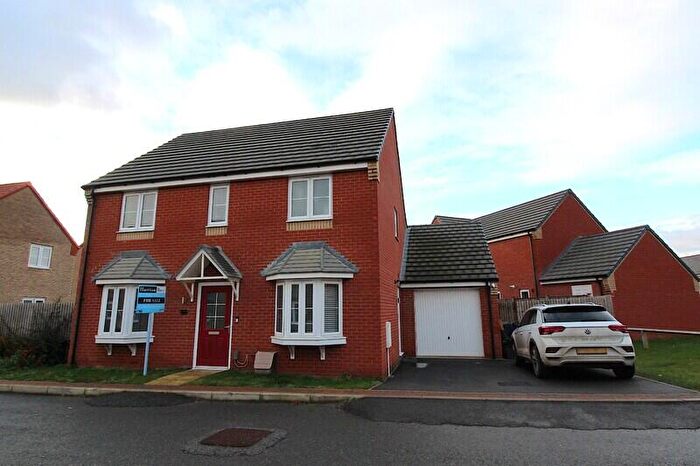
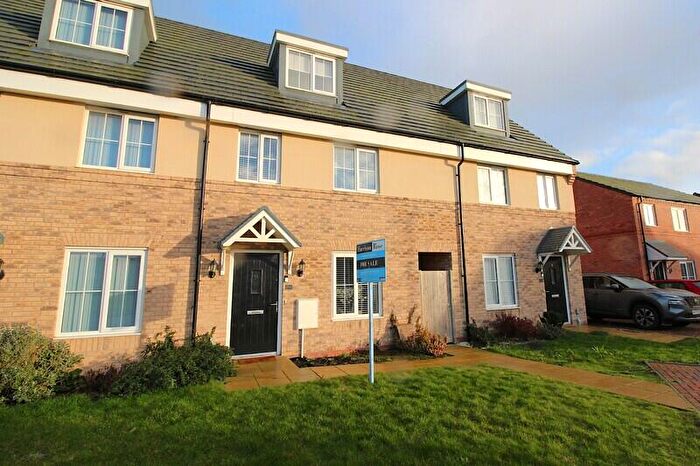
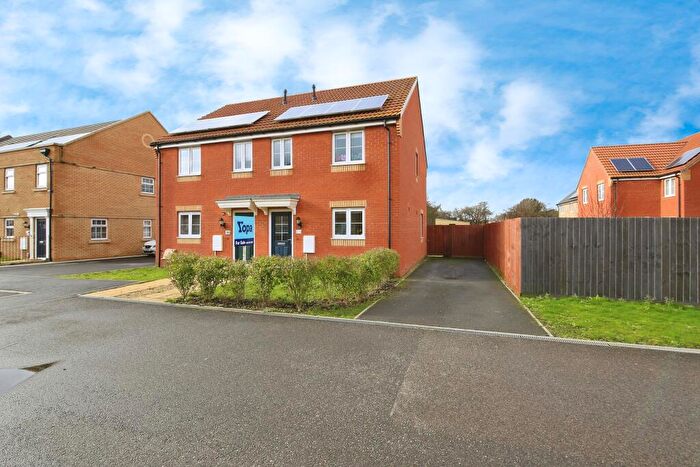
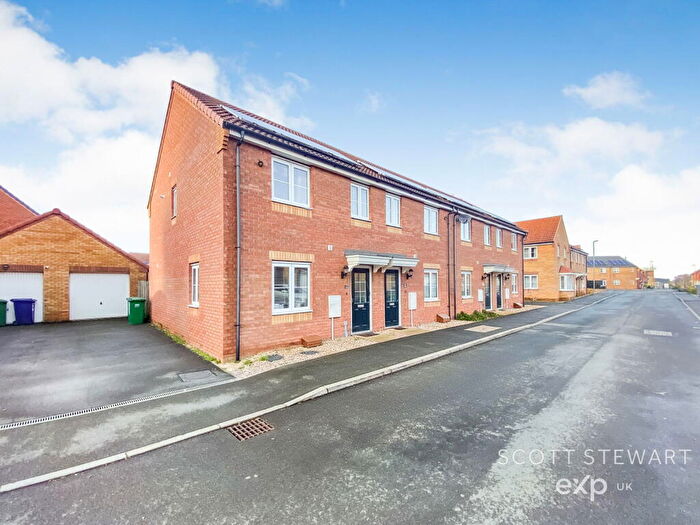
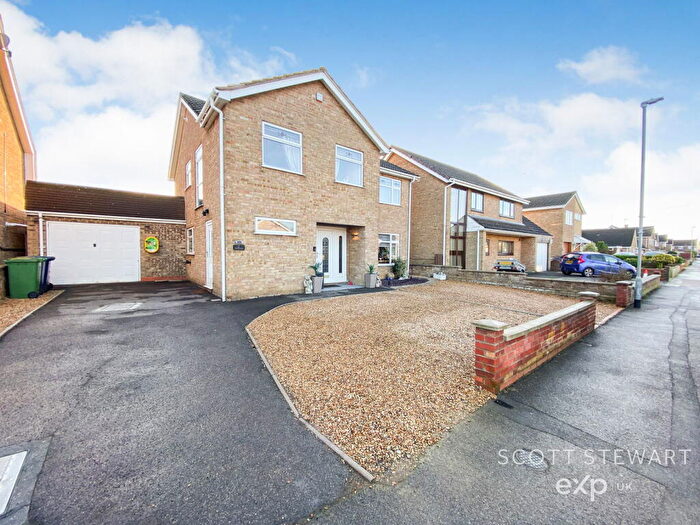
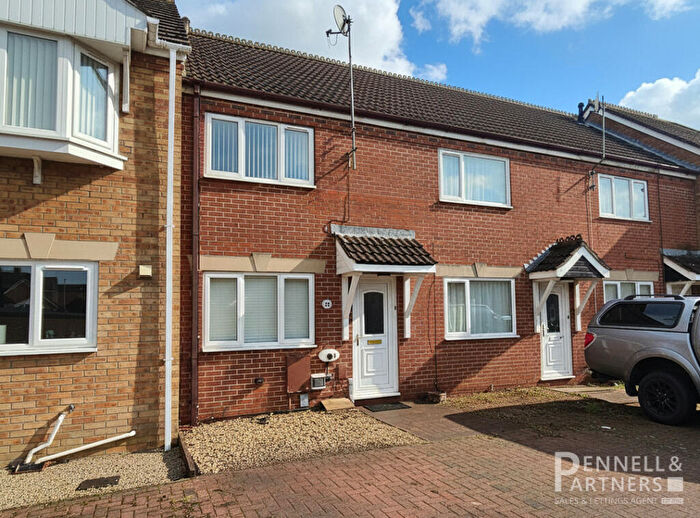
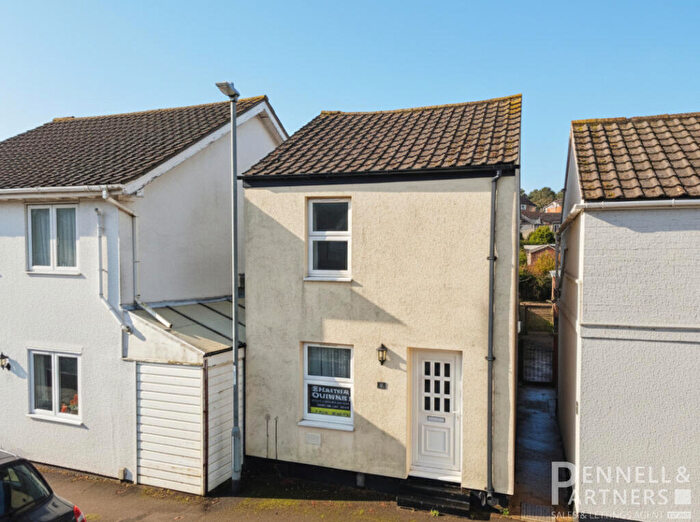
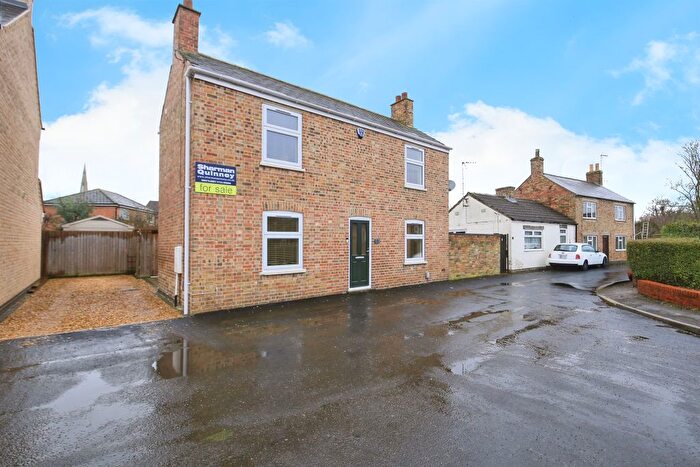
Houses for sale & to rent in Lattersey, Peterborough
House Prices in Lattersey
Properties in Lattersey have an average house price of £264,042.00 and had 93 Property Transactions within the last 3 years¹.
Lattersey is an area in Peterborough, Cambridgeshire with 1,066 households², where the most expensive property was sold for £530,000.00.
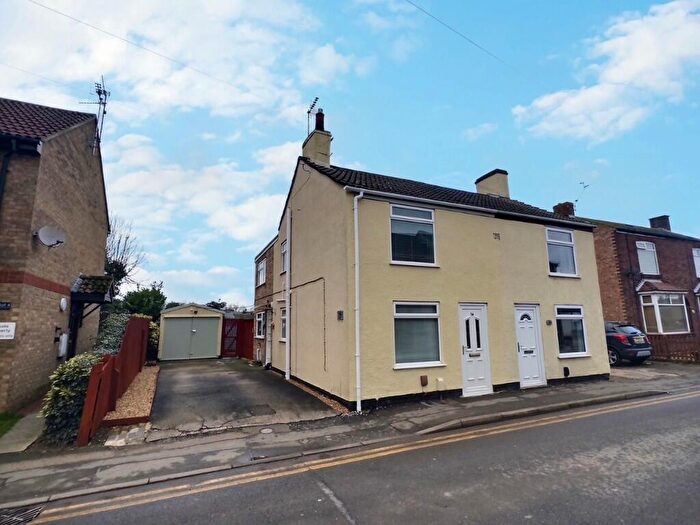
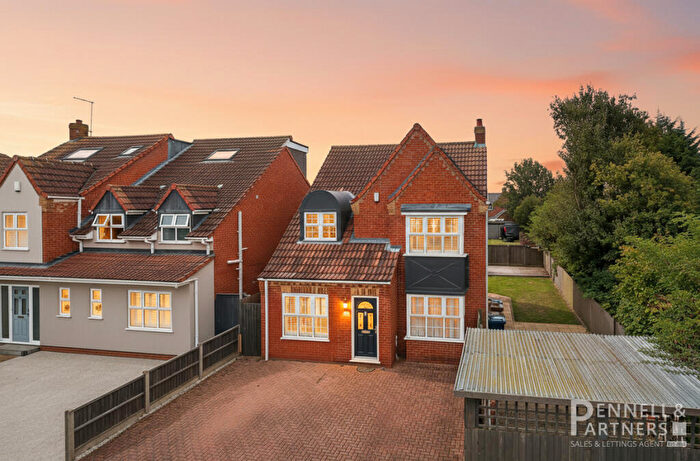
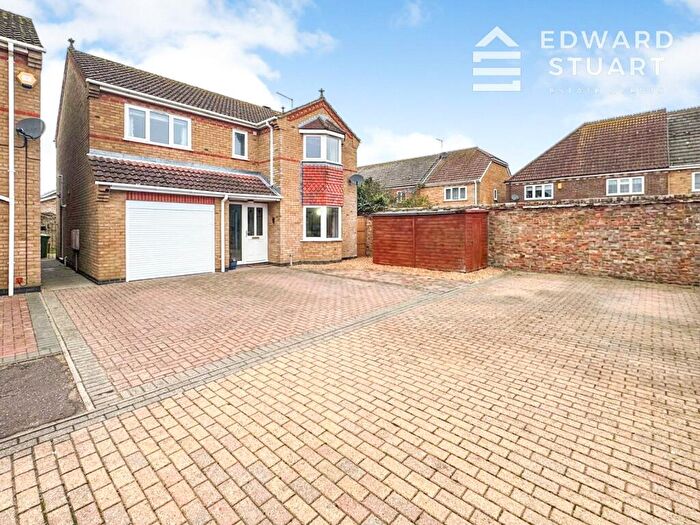
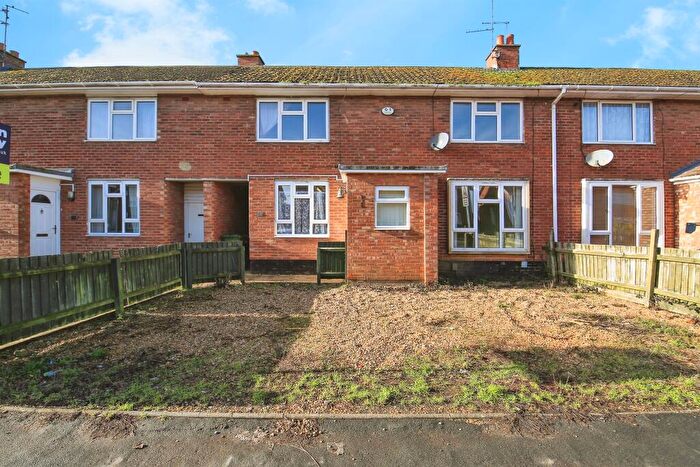
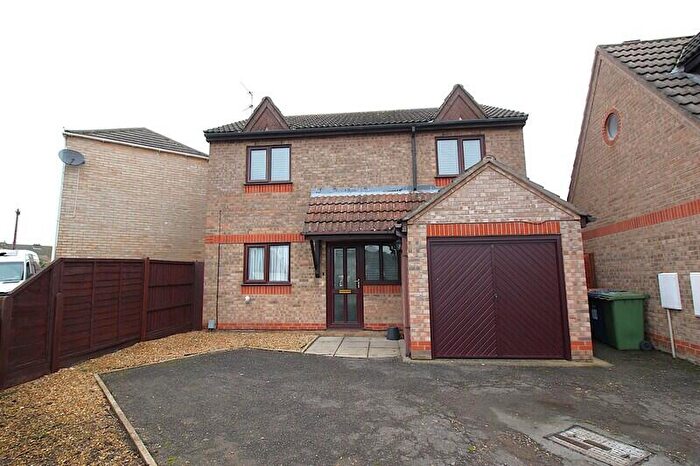
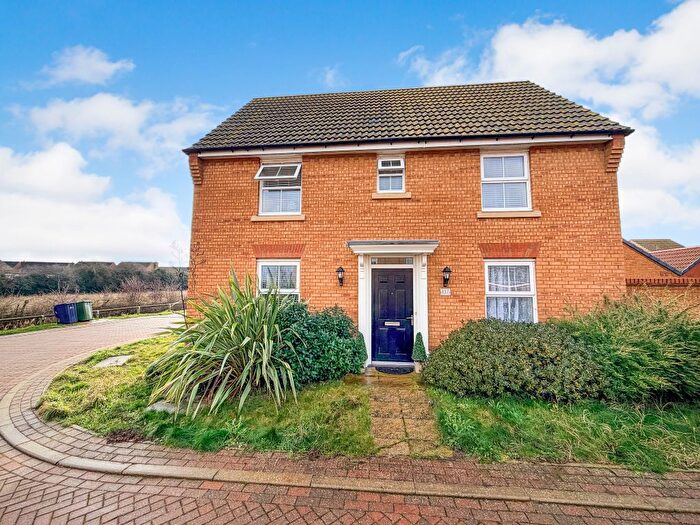
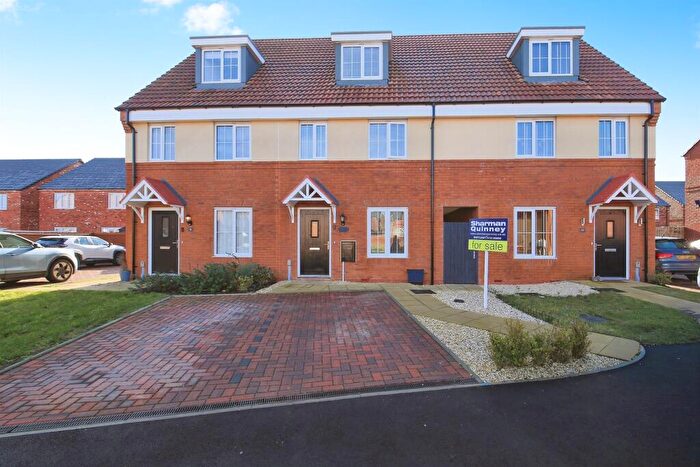
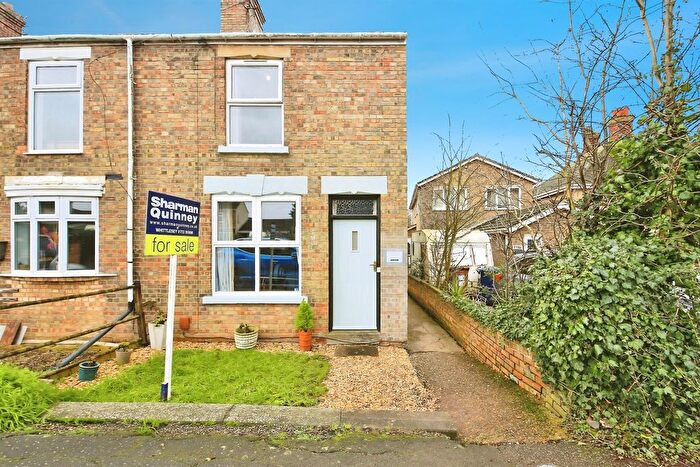
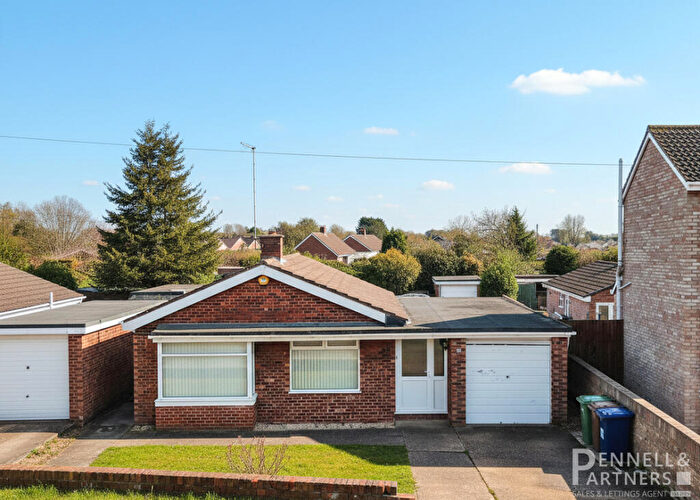
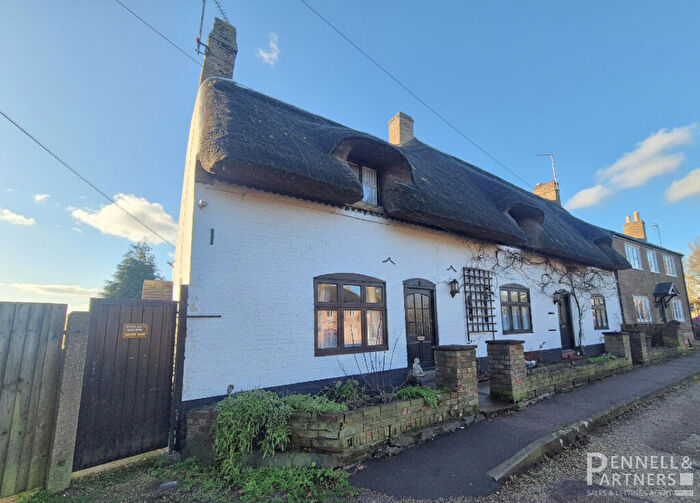
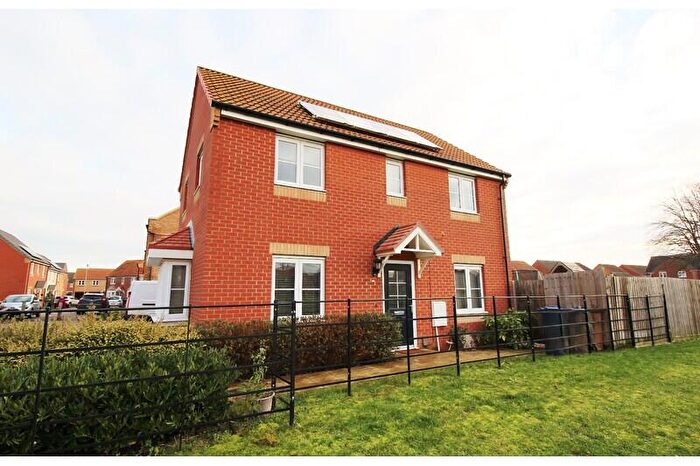
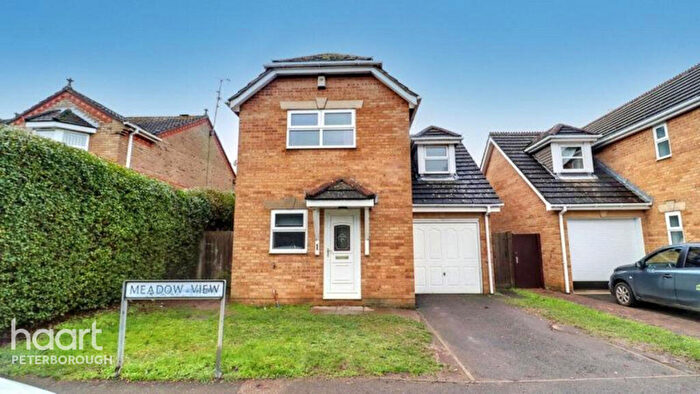
Properties for sale in Lattersey
Roads and Postcodes in Lattersey
Navigate through our locations to find the location of your next house in Lattersey, Peterborough for sale or to rent.
| Streets | Postcodes |
|---|---|
| Acorn Gardens | PE7 1WA |
| Bellmans Close | PE7 1TU |
| Bellmans Grove | PE7 1TX |
| Bellmans Road | PE7 1TY |
| Bens Close | PE7 1UZ |
| Bramble Close | PE7 1UP |
| Buckles Gardens | PE7 1NS |
| Burdett Grove | PE7 1JG |
| Charles Road | PE7 2RG |
| Cherrytree Grove | PE7 1TN |
| Chestnut Crescent | PE7 1TW |
| Debdale Court | PE7 1EB |
| Diana Close | PE7 2RJ |
| Duckworth Close | PE7 1PX |
| Eastfield Drive | PE7 1SH |
| Eastrea Road | PE7 1XA PE7 2AJ PE7 2AQ |
| Florence Close | PE7 1EF |
| Ford Close | PE7 1LH |
| Hannington Close | PE7 1LJ |
| Hawthorne Drive | PE7 1TH PE7 1TJ |
| Hunsbury Close | PE7 1NH |
| Inhams Court | PE7 1TS PE7 1SY |
| Inhams Road | PE7 1SS PE7 1TT |
| Kendall Croft | PE7 1UJ |
| Leeward Gardens | PE7 1TB |
| Linley Road | PE7 1TP |
| Mill Road | PE7 1SJ PE7 1SN |
| Millfield Way | PE7 1SP PE7 1SR |
| Mountbatten Way | PE7 1ND |
| Nene Close | PE7 1SL |
| New Road | PE7 1ST PE7 1SU PE7 1SX PE7 1SZ |
| Newlin Gardens | PE7 1WB |
| Nursery Gardens | PE7 1TE |
| Oldeamere Way | PE7 2RH |
| Palmer Close | PE7 1TA |
| Quinion Close | PE7 1TG |
| Rosewood Close | PE7 1WG |
| Stafford Road | PE7 1UY |
| Sycamore Road | PE7 1TL PE7 1TQ PE7 1TR |
| The Byres | PE7 1JJ |
| The Grove | PE7 2RF |
| The Rookery | PE7 1PH |
| Walnut Close | PE7 1LL |
| Windsor Place | PE7 1NB |
Transport near Lattersey
- FAQ
- Price Paid By Year
- Property Type Price
Frequently asked questions about Lattersey
What is the average price for a property for sale in Lattersey?
The average price for a property for sale in Lattersey is £264,042. This amount is 4% lower than the average price in Peterborough. There are 944 property listings for sale in Lattersey.
What streets have the most expensive properties for sale in Lattersey?
The streets with the most expensive properties for sale in Lattersey are The Grove at an average of £434,000, Oldeamere Way at an average of £388,000 and Bellmans Grove at an average of £375,000.
What streets have the most affordable properties for sale in Lattersey?
The streets with the most affordable properties for sale in Lattersey are Bellmans Road at an average of £175,799, Burdett Grove at an average of £187,623 and Inhams Road at an average of £188,000.
Which train stations are available in or near Lattersey?
Some of the train stations available in or near Lattersey are Whittlesea, Peterborough and March.
Property Price Paid in Lattersey by Year
The average sold property price by year was:
| Year | Average Sold Price | Price Change |
Sold Properties
|
|---|---|---|---|
| 2025 | £264,416 | 2% |
30 Properties |
| 2024 | £258,832 | -5% |
36 Properties |
| 2023 | £270,574 | 6% |
27 Properties |
| 2022 | £255,023 | 2% |
41 Properties |
| 2021 | £249,303 | 1% |
51 Properties |
| 2020 | £247,499 | 2% |
21 Properties |
| 2019 | £243,631 | 12% |
38 Properties |
| 2018 | £213,943 | 2% |
47 Properties |
| 2017 | £210,533 | 5% |
33 Properties |
| 2016 | £200,193 | 15% |
31 Properties |
| 2015 | £169,984 | 8% |
25 Properties |
| 2014 | £157,130 | 6% |
42 Properties |
| 2013 | £147,396 | -12% |
34 Properties |
| 2012 | £165,346 | 12% |
13 Properties |
| 2011 | £144,952 | -5% |
21 Properties |
| 2010 | £151,500 | -3% |
17 Properties |
| 2009 | £155,499 | -2% |
17 Properties |
| 2008 | £158,578 | -3% |
19 Properties |
| 2007 | £164,098 | 7% |
49 Properties |
| 2006 | £153,277 | 1% |
50 Properties |
| 2005 | £151,942 | 19% |
51 Properties |
| 2004 | £123,823 | -1% |
44 Properties |
| 2003 | £125,586 | 25% |
56 Properties |
| 2002 | £94,303 | 5% |
43 Properties |
| 2001 | £89,817 | 20% |
64 Properties |
| 2000 | £72,063 | 3% |
51 Properties |
| 1999 | £70,237 | 19% |
70 Properties |
| 1998 | £56,880 | -5% |
89 Properties |
| 1997 | £59,463 | -14% |
49 Properties |
| 1996 | £67,757 | 20% |
32 Properties |
| 1995 | £54,122 | - |
22 Properties |
Property Price per Property Type in Lattersey
Here you can find historic sold price data in order to help with your property search.
The average Property Paid Price for specific property types in the last three years are:
| Property Type | Average Sold Price | Sold Properties |
|---|---|---|
| Semi Detached House | £229,250.00 | 40 Semi Detached Houses |
| Detached House | £331,783.00 | 37 Detached Houses |
| Terraced House | £194,374.00 | 16 Terraced Houses |

