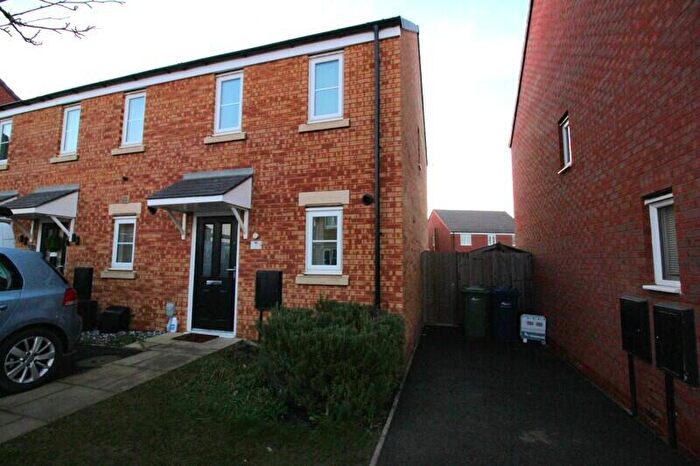
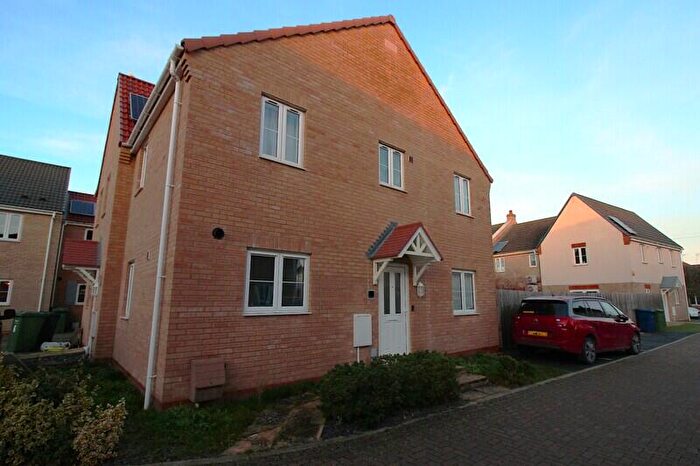
Houses for sale & to rent in St Marys, Peterborough
House Prices in St Marys
Properties in St Marys have an average house price of £235,830.00 and had 110 Property Transactions within the last 3 years¹.
St Marys is an area in Peterborough, Cambridgeshire with 1,074 households², where the most expensive property was sold for £650,000.00.
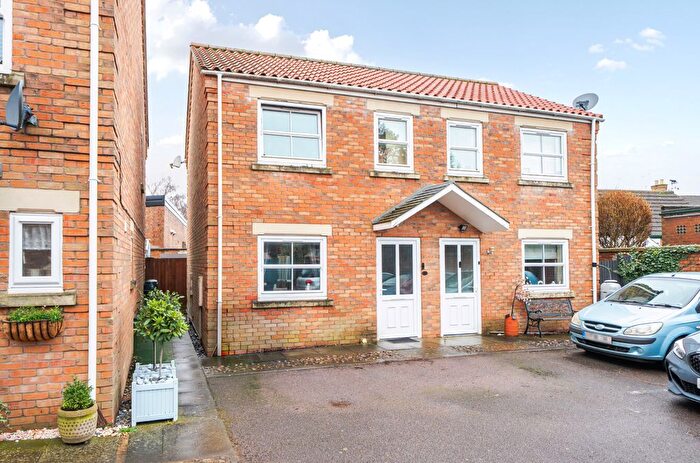
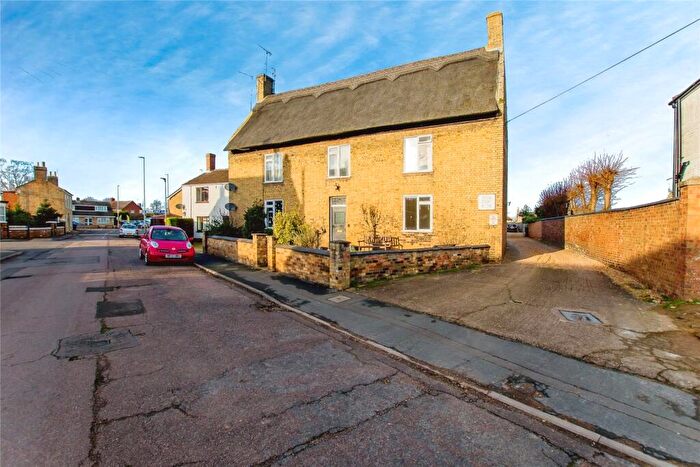
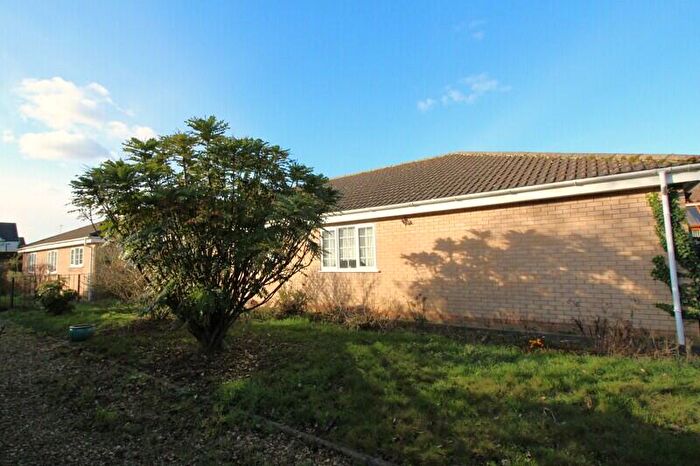
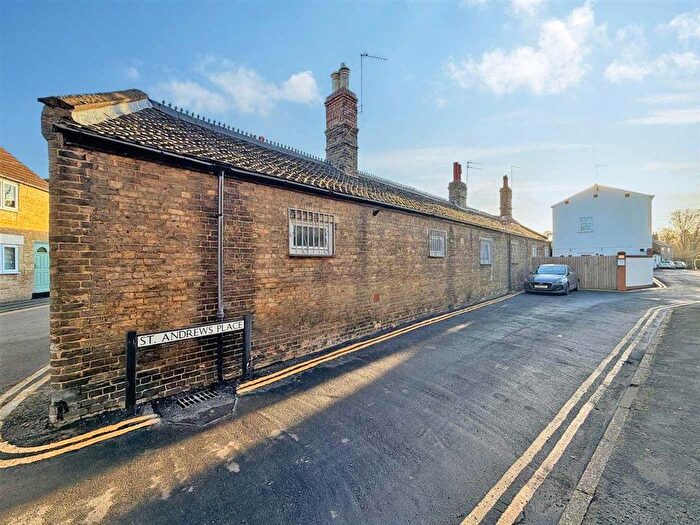
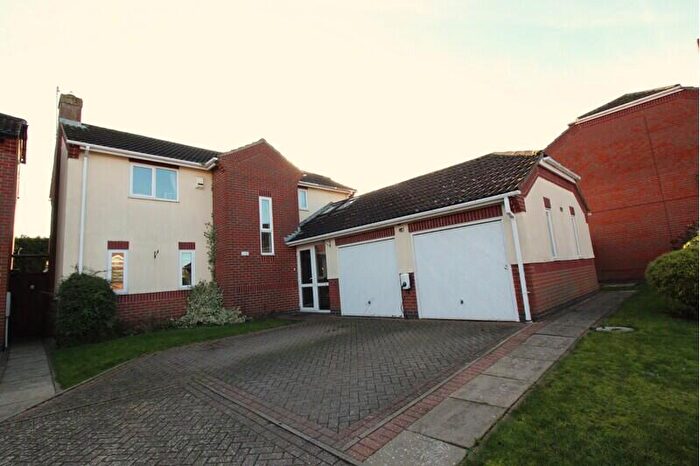
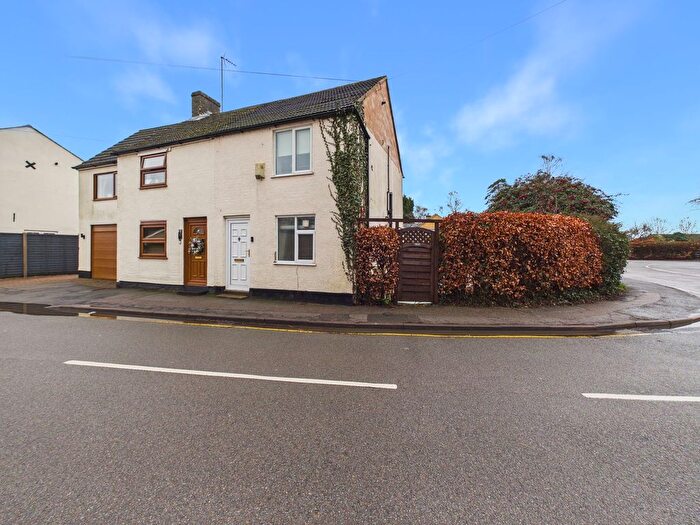
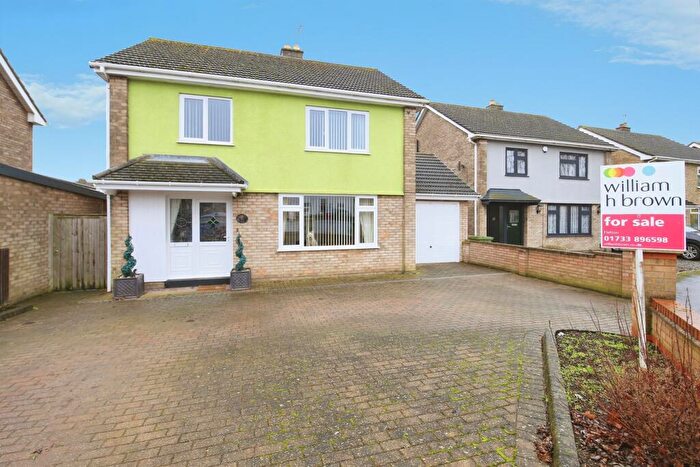
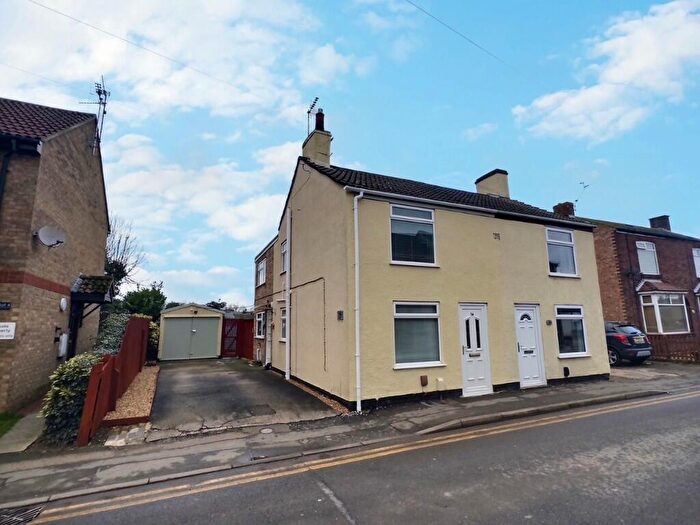
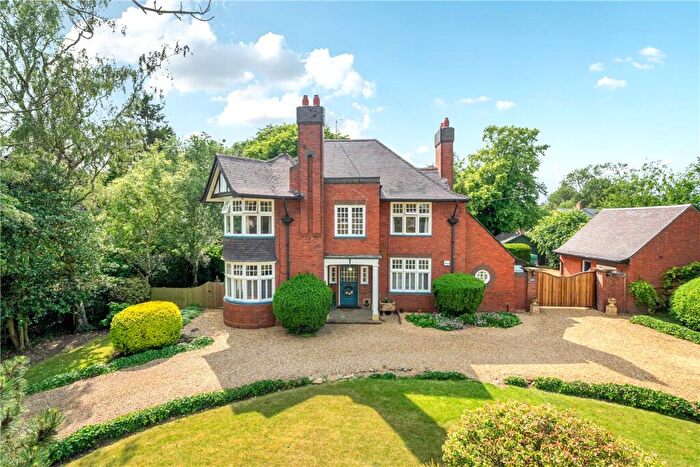
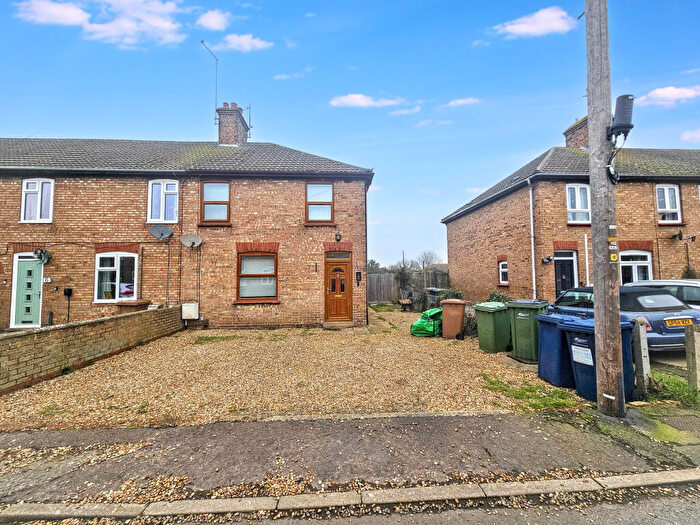
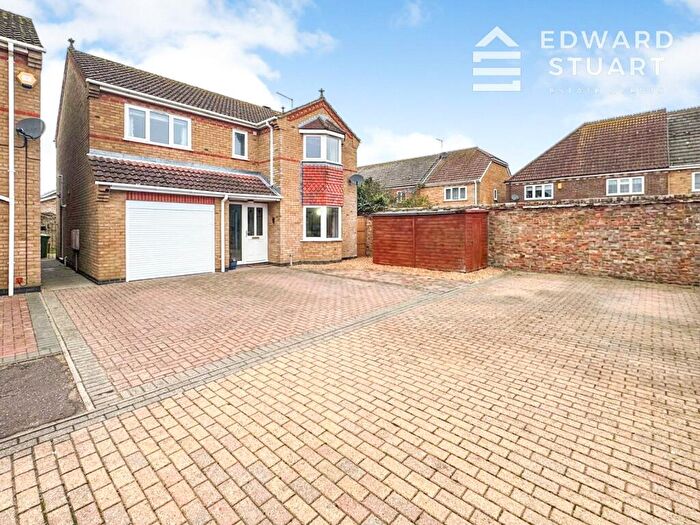
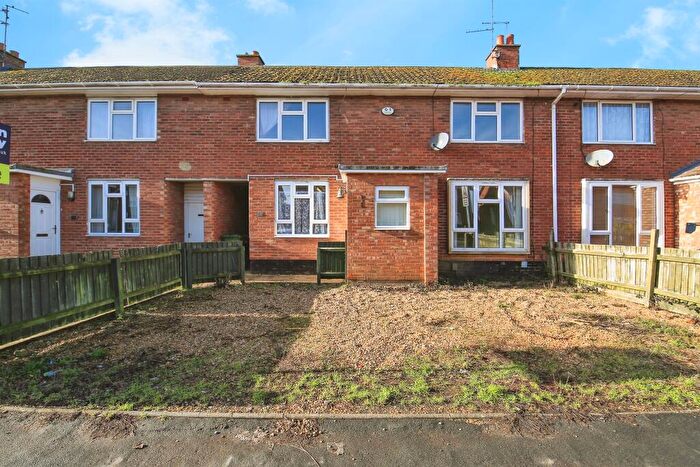
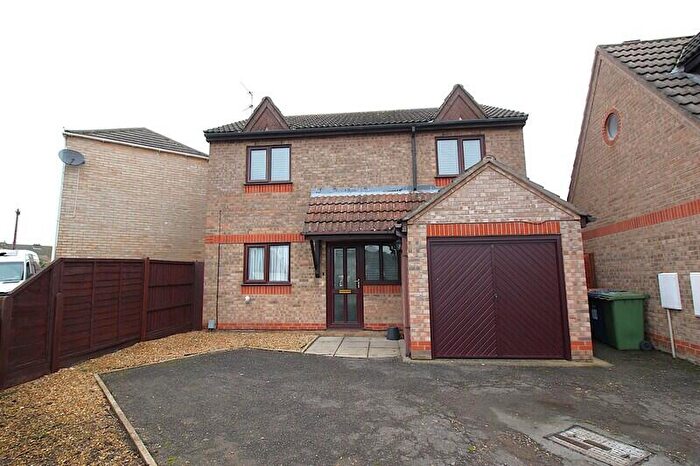
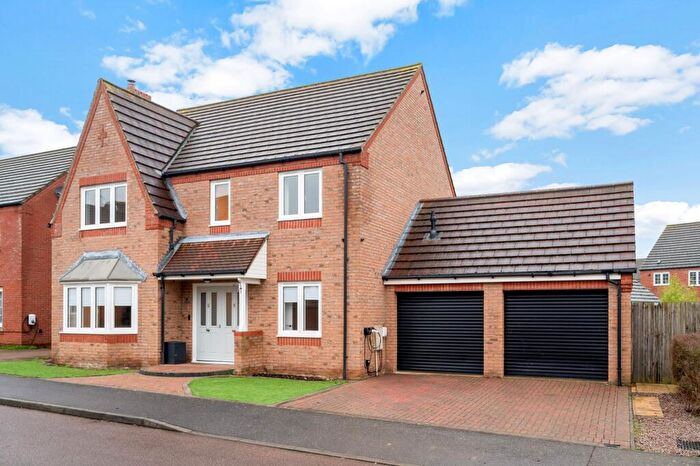
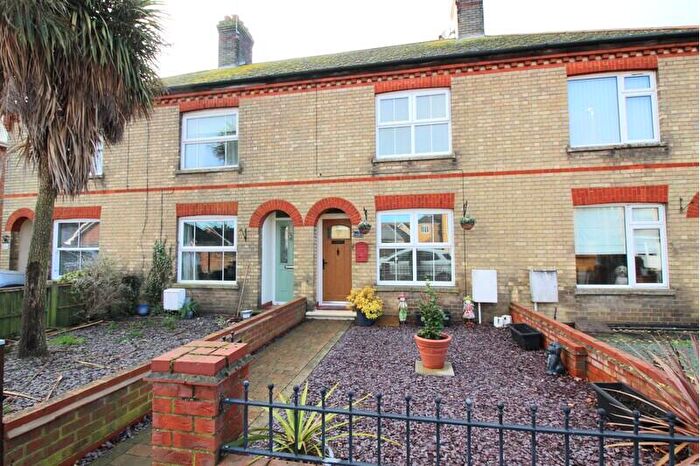
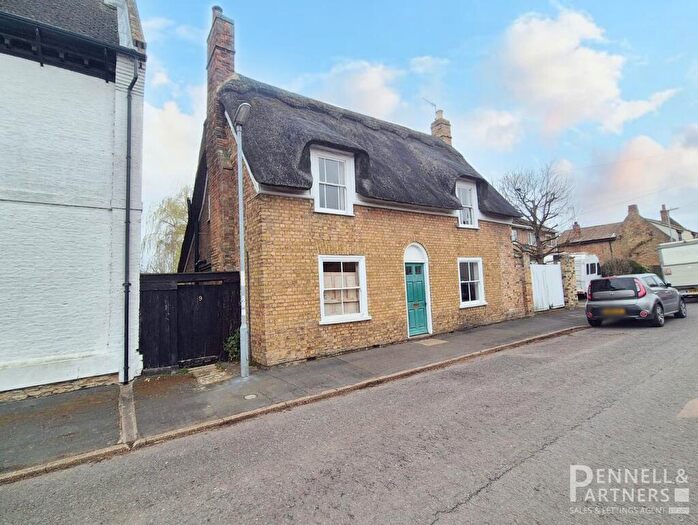
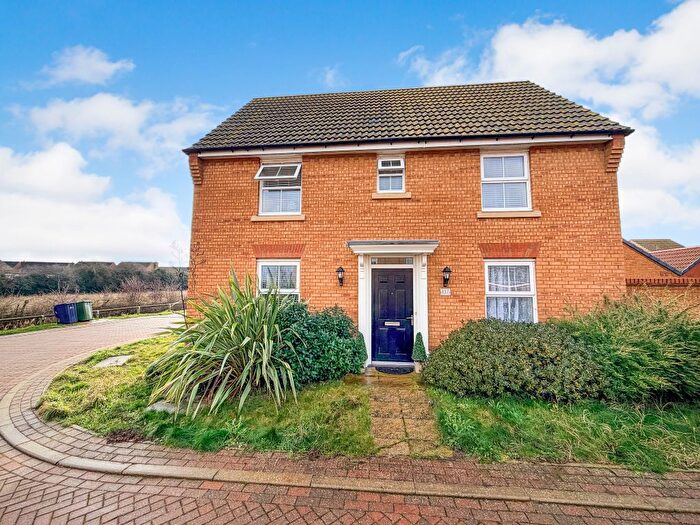
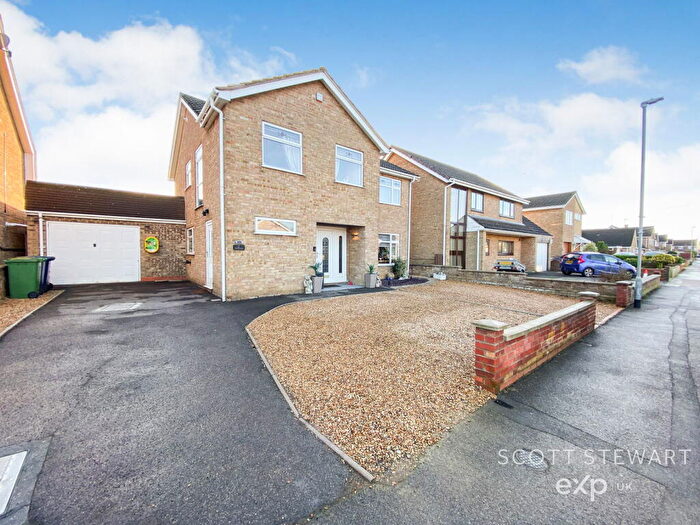
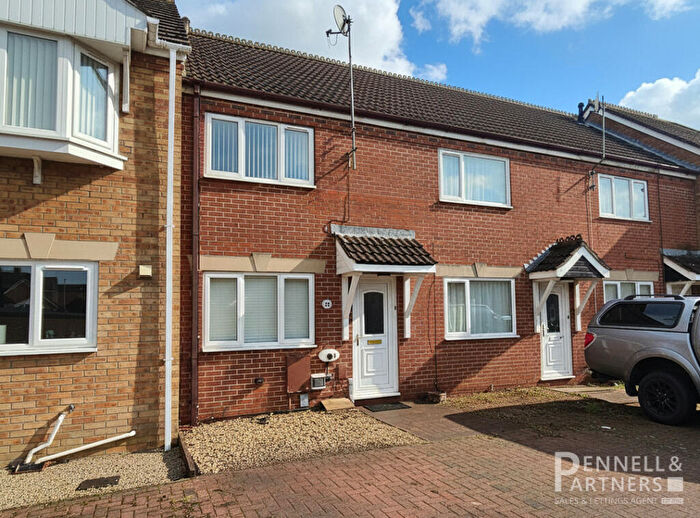
Properties for sale in St Marys
Roads and Postcodes in St Marys
Navigate through our locations to find the location of your next house in St Marys, Peterborough for sale or to rent.
| Streets | Postcodes |
|---|---|
| Aliwal Road | PE7 1UG PE7 1UH |
| Arnolds Lane | PE7 1QD |
| Ashline Grove | PE7 1DW |
| Ayres Grove | PE7 1WD |
| Bank Close | PE7 1UN |
| Barrs Street | PE7 1DA |
| Bassenhally Court | PE7 1PN |
| Blunts Lane | PE7 1AH |
| Braemar Gardens | PE7 1DT |
| Briggate Crescent | PE7 1DN |
| Briggate East | PE7 1EG |
| Briggate West | PE7 1DJ |
| Broad Street | PE7 1HA |
| Bruces Court | PE7 1AL |
| Cemetery Road | PE7 1RU PE7 1SF |
| Claygate | PE7 1QL |
| Collins Court | PE7 1UB |
| Delph | PE7 1QH |
| Delph Street | PE7 1FN PE7 1QQ |
| Duddington Gardens | PE7 1GJ |
| Eastgate | PE7 1PU PE7 1SE |
| Edgars Row | PE7 1HB |
| Falcon Lane | PE7 1BJ |
| Forge Close | PE7 1NG |
| Gale Gardens | PE7 1BF |
| Garden Grove | PE7 1EL |
| George Gardens | PE7 1RQ |
| Gilbert Close | PE7 1HZ |
| Gracious Street | PE7 1AP PE7 1AR PE7 1HU |
| Harts Lane | PE7 1NA |
| High Causeway | PE7 1AE PE7 1AJ PE7 1AN PE7 1QA |
| London Street | PE7 1BH PE7 1BP PE7 1BT PE7 1BY |
| Low Cross | PE7 1HW PE7 1LZ |
| Manor View | PE7 1TF |
| Market Street | PE7 1BA PE7 1BD |
| Marne Road | PE7 1UQ |
| Meadow View | PE7 1EZ |
| Merefield View | PE7 1EY |
| Monks Close | PE7 1PS |
| Mulberry Close | PE7 1UL |
| Old Crown Lane | PE7 1BB |
| Oldfield Gardens | PE7 1NX |
| Orchard Street | PE7 1QJ |
| Paradise Lane | PE7 1BL |
| Parkinsons Lane | PE7 1BZ |
| Pinewood Avenue | PE7 1EU PE7 1EX |
| Portland Place | PE7 1SB |
| Queen Street | PE7 1AY |
| Ramsey Road | PE7 1DR |
| Riverside Close | PE7 1DL |
| Scaldgate | PE7 1SD |
| Scaldgate Court | PE7 1UX |
| Searles Court | PE7 1PQ |
| St Andrews Place | PE7 1BX |
| St Marys Street | PE7 1BG |
| Station Road | PE7 1UA PE7 1UD PE7 1UE PE7 1UF |
| Stonald Road | PE7 1RE |
| Syers Lane | PE7 1AT |
| The Limes | PE7 1DS |
| The Old School Mews | PE7 1GB |
| Turners Lane | PE7 1EH |
| Whitmore Street | PE7 1AX PE7 1HE PE7 1HQ |
| Wild Boar Close | PE7 1NF |
| Windmill Street | PE7 1HJ PE7 1QN |
| Woolpack Lane | PE7 1BS |
Transport near St Marys
- FAQ
- Price Paid By Year
- Property Type Price
Frequently asked questions about St Marys
What is the average price for a property for sale in St Marys?
The average price for a property for sale in St Marys is £235,830. This amount is 14% lower than the average price in Peterborough. There are 977 property listings for sale in St Marys.
What streets have the most expensive properties for sale in St Marys?
The streets with the most expensive properties for sale in St Marys are Manor View at an average of £650,000, Searles Court at an average of £485,000 and Blunts Lane at an average of £335,000.
What streets have the most affordable properties for sale in St Marys?
The streets with the most affordable properties for sale in St Marys are Bruces Court at an average of £130,000, Eastgate at an average of £137,250 and Broad Street at an average of £147,500.
Which train stations are available in or near St Marys?
Some of the train stations available in or near St Marys are Whittlesea, Peterborough and March.
Property Price Paid in St Marys by Year
The average sold property price by year was:
| Year | Average Sold Price | Price Change |
Sold Properties
|
|---|---|---|---|
| 2025 | £226,999 | -7% |
35 Properties |
| 2024 | £243,486 | 3% |
37 Properties |
| 2023 | £236,510 | -0,2% |
38 Properties |
| 2022 | £237,067 | 12% |
53 Properties |
| 2021 | £208,806 | -0,2% |
79 Properties |
| 2020 | £209,277 | 8% |
27 Properties |
| 2019 | £192,415 | 2% |
54 Properties |
| 2018 | £189,411 | 6% |
60 Properties |
| 2017 | £178,628 | 9% |
58 Properties |
| 2016 | £162,804 | 4% |
67 Properties |
| 2015 | £155,951 | 5% |
58 Properties |
| 2014 | £148,457 | 14% |
47 Properties |
| 2013 | £127,461 | -16% |
50 Properties |
| 2012 | £147,301 | -14% |
33 Properties |
| 2011 | £168,277 | 21% |
27 Properties |
| 2010 | £132,424 | 12% |
30 Properties |
| 2009 | £116,037 | -41% |
48 Properties |
| 2008 | £163,945 | 12% |
49 Properties |
| 2007 | £143,788 | 4% |
87 Properties |
| 2006 | £137,896 | -13% |
73 Properties |
| 2005 | £155,372 | 7% |
58 Properties |
| 2004 | £144,853 | 23% |
61 Properties |
| 2003 | £110,816 | 22% |
72 Properties |
| 2002 | £86,375 | 11% |
95 Properties |
| 2001 | £76,559 | 17% |
80 Properties |
| 2000 | £63,334 | -1% |
81 Properties |
| 1999 | £63,861 | 13% |
83 Properties |
| 1998 | £55,559 | 11% |
70 Properties |
| 1997 | £49,288 | 14% |
67 Properties |
| 1996 | £42,560 | -14% |
65 Properties |
| 1995 | £48,706 | - |
57 Properties |
Property Price per Property Type in St Marys
Here you can find historic sold price data in order to help with your property search.
The average Property Paid Price for specific property types in the last three years are:
| Property Type | Average Sold Price | Sold Properties |
|---|---|---|
| Semi Detached House | £225,449.00 | 25 Semi Detached Houses |
| Detached House | £301,233.00 | 47 Detached Houses |
| Terraced House | £171,069.00 | 31 Terraced Houses |
| Flat | £120,571.00 | 7 Flats |

