Houses for sale & to rent in St Andrews, Peterborough
House Prices in St Andrews
Properties in St Andrews have an average house price of £259,057.00 and had 124 Property Transactions within the last 3 years¹.
St Andrews is an area in Peterborough, Cambridgeshire with 1,159 households², where the most expensive property was sold for £600,000.00.
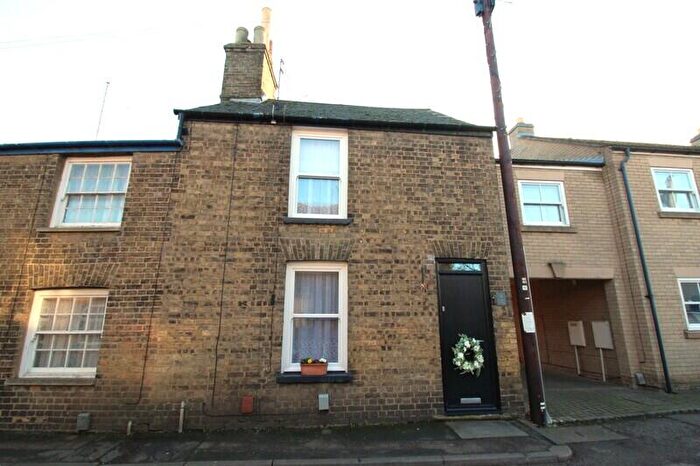
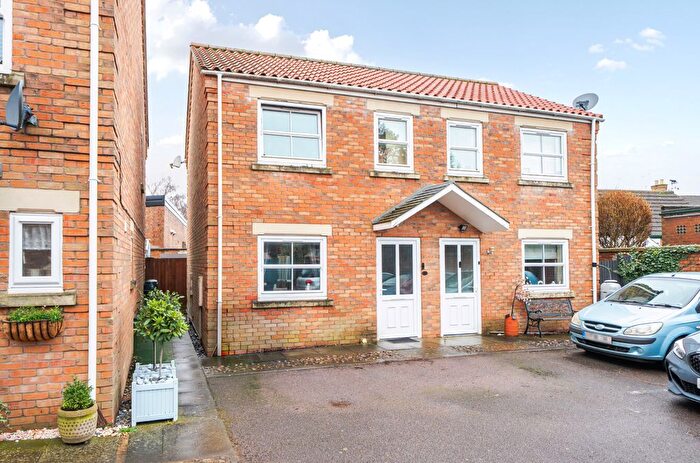
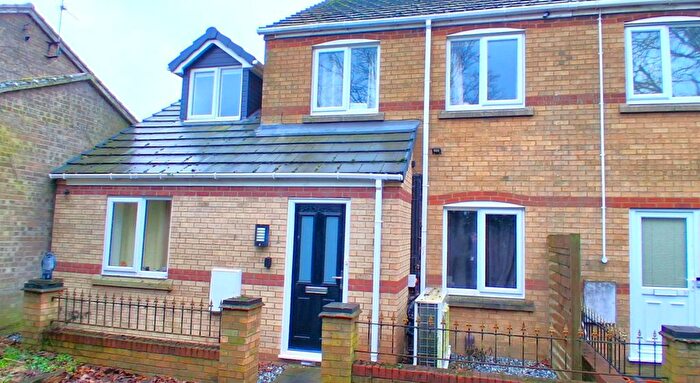
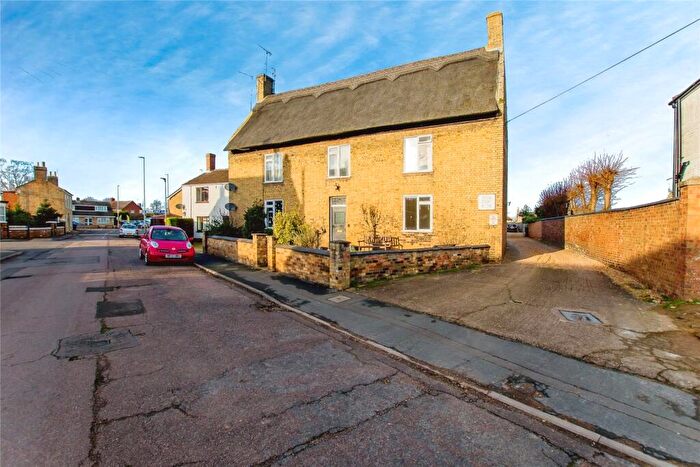
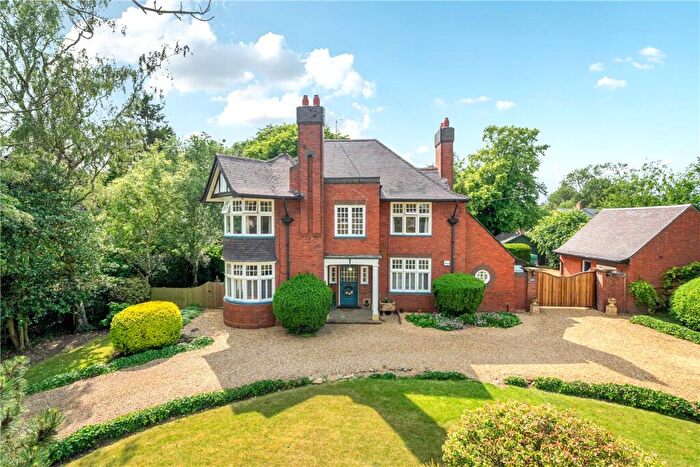
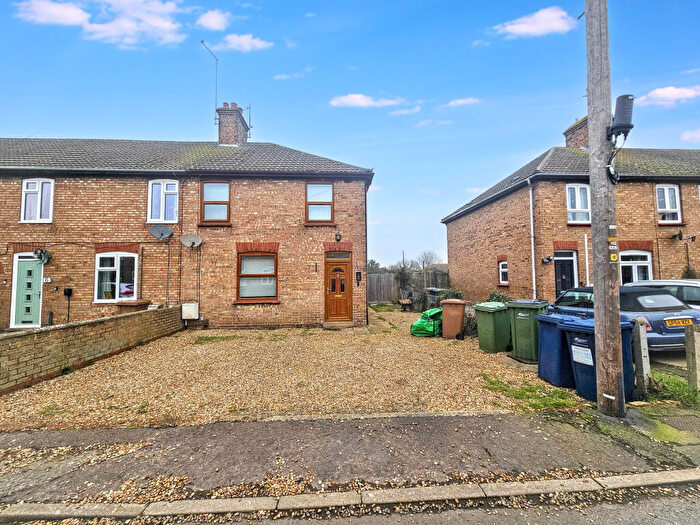
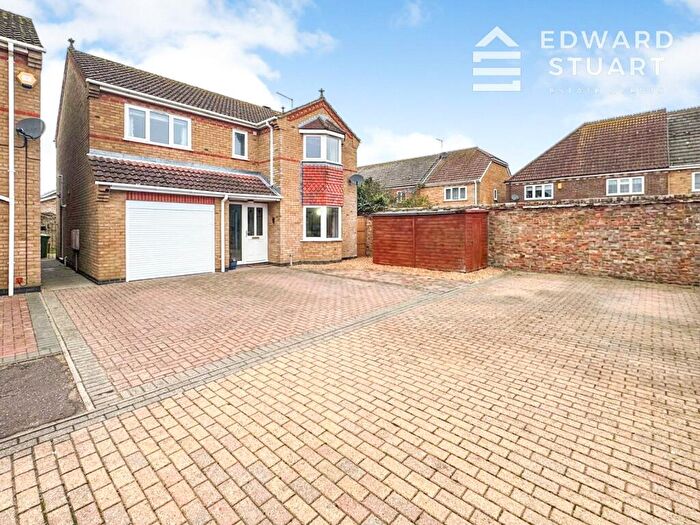
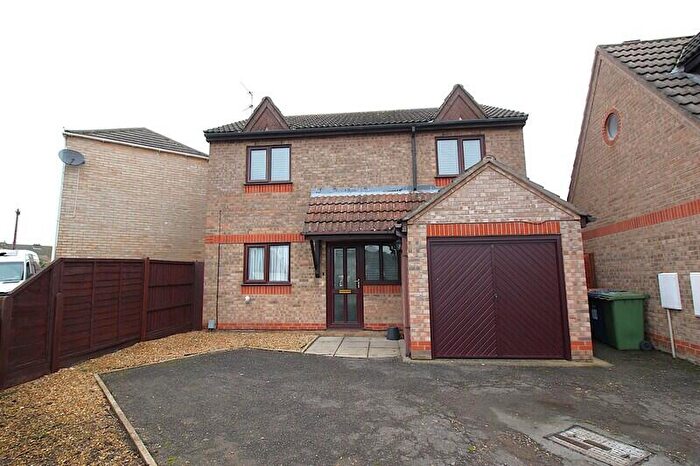
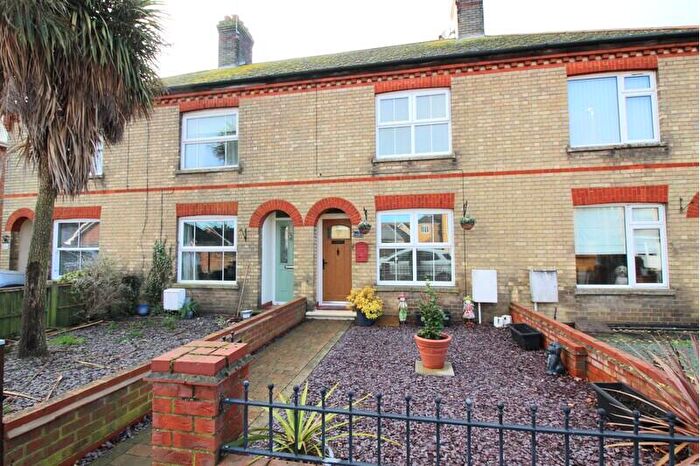
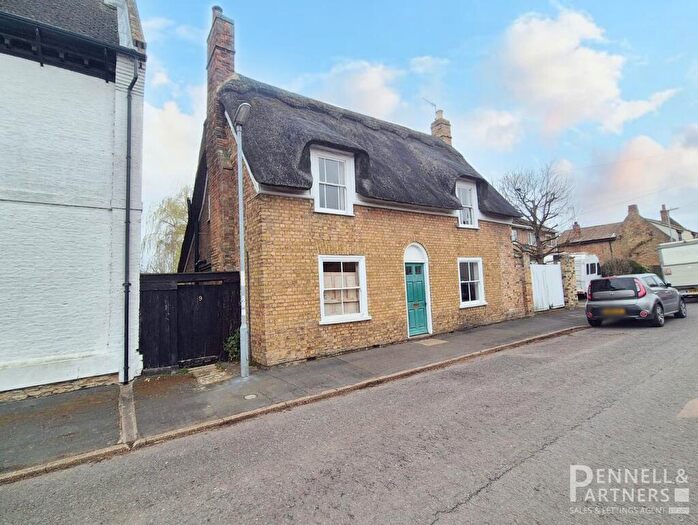
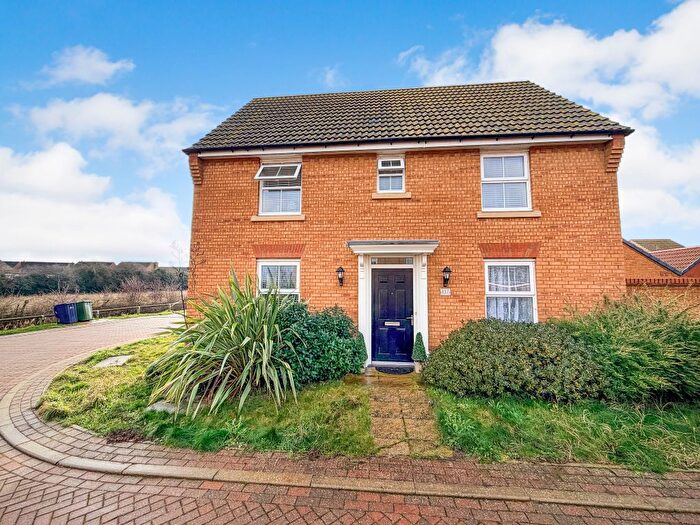
Properties for sale in St Andrews
Roads and Postcodes in St Andrews
Navigate through our locations to find the location of your next house in St Andrews, Peterborough for sale or to rent.
| Streets | Postcodes |
|---|---|
| Abbey Way | PE7 1LD |
| Anthony Close | PE7 1UR |
| Barnes Way | PE7 1LE |
| Barratts Close | PE7 1LU |
| Bates Court | PE7 1GN |
| Boyce Close | PE7 1JF |
| Bretts Way | PE7 1NQ |
| Briggate East | PE7 1BN PE7 1DG |
| Briggate Quay | PE7 1DH |
| Childers Street | PE7 1PZ |
| Church Street | PE7 1DB PE7 1DE PE7 1DD |
| Churchfield Way | PE7 1JU PE7 1JX PE7 1JY PE7 1JZ |
| Crease Bank | PE7 1GR |
| Cross Road | PE7 1LX |
| Crossway Hand | PE7 1PB |
| Finkle Court | PE7 1FZ |
| Finkle Lane | PE7 1HT |
| Hallcroft Road | PE7 1JW PE7 1LP |
| Horsegate | PE7 1JD |
| Horsegate Lane | PE7 1JN |
| Irving Burgess Close | PE7 1QB |
| Love Lane | PE7 1JE |
| Mansion Gardens | PE7 1AD |
| Market Place | PE7 1AB |
| Owens Gardens | PE7 1PE |
| Oxford Gardens | PE7 1LF |
| Park Lane | PE7 1JA PE7 1JB |
| Peterborough Road | PE7 1NJ PE7 1PA PE7 1PD PE7 1PJ |
| Picketts Close | PE7 1HF |
| Pingle Close | PE7 1NW |
| Plough Crescent | PE7 1LY |
| Plough Road | PE7 1LT |
| Poles Court | PE7 1LN |
| Priors Road | PE7 1JR PE7 1LQ |
| Saxon Road | PE7 1NP |
| Snoots Road | PE7 1LA PE7 1LB PE7 1NL PE7 1NN |
| Station Road | PE7 1SA |
| Stonald Road | PE7 1QG PE7 1QP |
| The Bower | PE7 1EQ |
| The Stables | PE7 1HL |
| Thorofare Lane | PE7 1HH |
| Tower Close | PE7 1QF |
| Tudor Close | PE7 1QE |
| Turners Lane | PE7 1EJ |
| Wakelyn Road | PE7 1JT |
| West End | PE7 1HR PE7 1LR PE7 1LS |
| Whitmore Street | PE7 1HG |
| Willow Close | PE7 1JP |
Transport near St Andrews
- FAQ
- Price Paid By Year
- Property Type Price
Frequently asked questions about St Andrews
What is the average price for a property for sale in St Andrews?
The average price for a property for sale in St Andrews is £259,057. This amount is 6% lower than the average price in Peterborough. There are 862 property listings for sale in St Andrews.
What streets have the most expensive properties for sale in St Andrews?
The streets with the most expensive properties for sale in St Andrews are Boyce Close at an average of £600,000, Love Lane at an average of £530,000 and Oxford Gardens at an average of £391,665.
What streets have the most affordable properties for sale in St Andrews?
The streets with the most affordable properties for sale in St Andrews are Plough Crescent at an average of £165,000, Barnes Way at an average of £191,600 and Wakelyn Road at an average of £207,927.
Which train stations are available in or near St Andrews?
Some of the train stations available in or near St Andrews are Whittlesea, Peterborough and March.
Property Price Paid in St Andrews by Year
The average sold property price by year was:
| Year | Average Sold Price | Price Change |
Sold Properties
|
|---|---|---|---|
| 2025 | £271,169 | 7% |
38 Properties |
| 2024 | £252,967 | -1% |
47 Properties |
| 2023 | £254,595 | -3% |
39 Properties |
| 2022 | £263,499 | 14% |
69 Properties |
| 2021 | £227,298 | 4% |
70 Properties |
| 2020 | £218,636 | 3% |
44 Properties |
| 2019 | £212,733 | -5% |
38 Properties |
| 2018 | £222,619 | 12% |
37 Properties |
| 2017 | £196,559 | 8% |
42 Properties |
| 2016 | £180,008 | 10% |
54 Properties |
| 2015 | £162,631 | 1% |
53 Properties |
| 2014 | £161,713 | 13% |
63 Properties |
| 2013 | £141,335 | -10% |
44 Properties |
| 2012 | £155,374 | 13% |
32 Properties |
| 2011 | £134,673 | -5% |
36 Properties |
| 2010 | £141,397 | 10% |
25 Properties |
| 2009 | £126,577 | -41% |
32 Properties |
| 2008 | £178,709 | -1% |
40 Properties |
| 2007 | £181,089 | 7% |
72 Properties |
| 2006 | £169,258 | 14% |
64 Properties |
| 2005 | £144,892 | 3% |
56 Properties |
| 2004 | £140,928 | 15% |
68 Properties |
| 2003 | £119,804 | 19% |
80 Properties |
| 2002 | £96,985 | 18% |
76 Properties |
| 2001 | £79,697 | 14% |
74 Properties |
| 2000 | £68,385 | 14% |
59 Properties |
| 1999 | £59,057 | -3% |
56 Properties |
| 1998 | £60,943 | 12% |
61 Properties |
| 1997 | £53,698 | 9% |
59 Properties |
| 1996 | £49,085 | 3% |
41 Properties |
| 1995 | £47,550 | - |
37 Properties |
Property Price per Property Type in St Andrews
Here you can find historic sold price data in order to help with your property search.
The average Property Paid Price for specific property types in the last three years are:
| Property Type | Average Sold Price | Sold Properties |
|---|---|---|
| Semi Detached House | £216,895.00 | 53 Semi Detached Houses |
| Detached House | £312,415.00 | 60 Detached Houses |
| Terraced House | £174,775.00 | 10 Terraced Houses |
| Flat | £134,995.00 | 1 Flat |

